

Key Insights
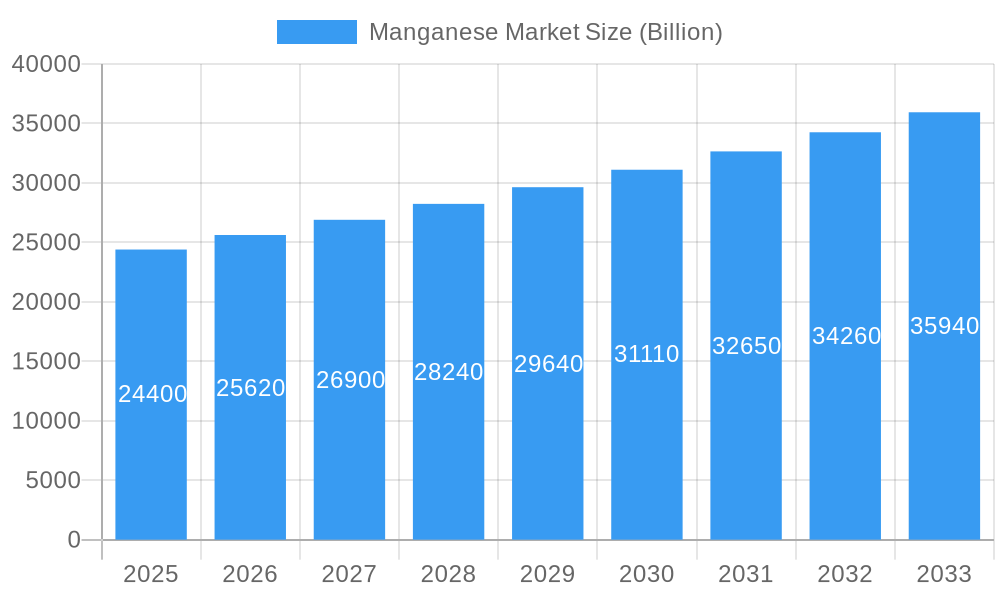
The manganese market, valued at $24.4 billion in 2025, is projected to experience robust growth, driven by a compound annual growth rate (CAGR) of 5% from 2025 to 2033. This expansion is fueled by several key factors. The increasing demand for manganese in steel production, particularly in construction and infrastructure development, significantly contributes to market growth. The burgeoning renewable energy sector, specifically in battery technologies for electric vehicles and energy storage systems, represents another major driver. The rising adoption of manganese-based cathode materials in lithium-ion batteries is further bolstering market demand. Furthermore, advancements in manganese extraction and processing techniques are enhancing efficiency and cost-effectiveness, contributing to the overall market expansion. The diverse applications of manganese across various industries, including its use as a coloring and oxidizing agent, further broaden its market reach. Geographic expansion, with significant growth potential in developing economies in Asia-Pacific and South America, also contributes to the market's positive outlook.
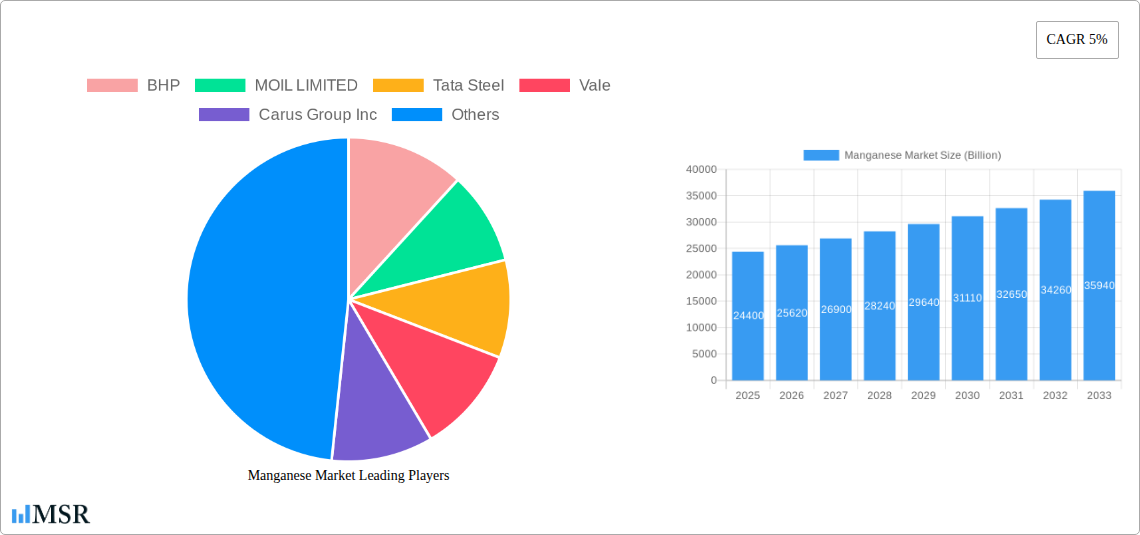
Manganese Market Market Size (In Billion)
However, the manganese market faces certain restraints. Fluctuations in raw material prices and the geopolitical landscape can impact supply chains and market stability. Environmental concerns surrounding manganese mining and processing necessitate the implementation of sustainable practices to mitigate negative impacts. Competition from alternative materials in specific applications also presents a challenge. To navigate these challenges, market players are focusing on strategic partnerships, technological innovation, and environmentally responsible production methods to maintain a competitive edge and ensure long-term growth. The market segmentation, encompassing various manganese types (high, medium, and low carbon ferromanganese, silico-manganese, etc.) and applications (alloying, batteries, etc.), offers opportunities for specialized product development and market penetration. Key players, including BHP, MOIL Limited, Tata Steel, Vale, and others, are actively involved in shaping the market landscape through strategic investments and expansion initiatives.
Manganese Market Company Market Share
Manganese Market: A Comprehensive Report (2019-2033)
This comprehensive report provides a detailed analysis of the global manganese market, encompassing market size, growth drivers, key players, and future trends. Covering the period from 2019 to 2033, with a base year of 2025, this in-depth study offers invaluable insights for industry stakeholders seeking to navigate this dynamic market. The report projects a market value exceeding XX Billion by 2033, showcasing significant growth potential. This report is crucial for strategic decision-making, investment analysis, and competitive intelligence within the manganese industry.
Manganese Market Concentration & Dynamics
The global manganese market exhibits a moderately concentrated landscape, with a handful of major players holding significant market share. BHP, Vale, and Anglo American PLC are among the leading producers, collectively accounting for an estimated xx% of global production. However, a significant number of smaller, regional players also contribute to the overall market supply. Market concentration is influenced by factors like geographical distribution of manganese reserves, production capacity, and strategic mergers and acquisitions (M&A) activities.
- Market Share: BHP (xx%), Vale (xx%), Anglo American PLC (xx%), Others (xx%).
- M&A Activity: The past five years have witnessed xx M&A deals in the manganese sector, primarily driven by the pursuit of economies of scale, diversification, and access to new markets. The acquisition of TEMCO by GFG Alliance in 2020 exemplifies this trend.
- Innovation Ecosystems: The manganese industry is characterized by ongoing innovation in extraction technologies, processing methods, and downstream applications, particularly within the power storage and electricity sector.
- Regulatory Frameworks: Environmental regulations and mining legislation play a crucial role in shaping the market dynamics, particularly concerning sustainable mining practices and waste management.
- Substitute Products: While limited, certain alternative materials are used in specific applications, posing a subtle challenge to manganese's dominance.
- End-User Trends: Growing demand from the automotive, steel, and battery industries is a significant driver of market expansion.
Manganese Market Industry Insights & Trends
The global manganese market is experiencing robust growth, fueled by rising industrialization, urbanization, and the expanding adoption of manganese in high-growth sectors. The market size was valued at XX Billion in 2024 and is projected to reach XX Billion by 2033, exhibiting a compound annual growth rate (CAGR) of xx% during the forecast period (2025-2033). This growth is driven by several key factors: the increasing demand for steel, expanding electric vehicle (EV) production, which requires significant amounts of manganese in batteries, and the rising construction activity globally. Technological advancements in manganese extraction and processing techniques are also enhancing efficiency and cost-effectiveness, further stimulating market expansion. Evolving consumer preferences towards sustainable and environmentally friendly products are prompting the industry to embrace responsible sourcing and recycling practices.
Key Markets & Segments Leading Manganese Market
The Asia-Pacific region currently dominates the global manganese market, driven primarily by robust industrial growth in China and India. Within the market segmentation, High Carbon Ferromanganese holds the largest market share by type, followed by Medium Carbon Ferromanganese. The alloying additive application segment holds the largest share by application, reflecting the widespread use of manganese in steel production. The industrial sector is the largest end-use sector for manganese, primarily due to its extensive use in steel manufacturing and other industrial processes.
Key Growth Drivers:
- Economic Growth: Rapid industrialization and urbanization in developing economies are driving demand.
- Infrastructure Development: Extensive infrastructure projects necessitate large quantities of manganese.
- Technological Advancements: Innovations in battery technology are boosting demand for electrolytic manganese.
Dominance Analysis:
The Asia-Pacific region's dominance stems from its vast manganese reserves, large-scale steel production, and rapidly expanding battery manufacturing industry. China's influence is particularly prominent due to its position as a leading steel producer and a major consumer of manganese-based products.
Manganese Market Product Developments
Recent years have witnessed significant advancements in manganese-based products, driven primarily by the increasing demand for high-performance materials in various applications. This includes the development of improved high-purity manganese products for battery applications, as well as innovative alloys with enhanced properties for use in specialized steel grades. These advancements are aimed at improving performance characteristics, reducing costs, and enhancing sustainability. The focus is on high purity manganese for lithium-ion batteries and improving the efficiency of its extraction and processing.
Challenges in the Manganese Market Market
The manganese market faces several challenges, including fluctuating raw material prices, environmental regulations impacting mining operations, and competition from substitute materials in niche applications. Supply chain disruptions caused by geopolitical instability and the COVID-19 pandemic have also impacted the market. These factors can lead to price volatility and affect the overall market growth. The quantified impact of these factors is estimated to be a reduction in market growth by approximately xx% in specific years.
Forces Driving Manganese Market Growth
Several factors are driving the growth of the manganese market. The increasing demand for steel in construction, automotive, and infrastructure projects fuels the market. The rise of electric vehicles and energy storage systems significantly boosts the demand for electrolytic manganese. Government initiatives promoting sustainable development and infrastructure also positively influence market expansion. Stringent environmental regulations are driving the adoption of more efficient and environmentally friendly manganese extraction and processing technologies.
Long-Term Growth Catalysts in Manganese Market
Long-term growth will be driven by advancements in battery technology requiring high-purity manganese, increasing collaboration between mining companies and battery manufacturers, and expansion into new applications like water treatment and agriculture. Sustainable mining practices will become a significant driver of long-term growth, ensuring responsible sourcing and minimizing environmental impact.
Emerging Opportunities in Manganese Market
Emerging opportunities include the growing demand for manganese in specialized alloys for aerospace and defense applications, the expansion of the renewable energy sector requiring manganese in solar panels and wind turbines, and the development of advanced manganese-based catalysts for various industrial processes. Recycled manganese is gaining traction, reducing reliance on primary sources and creating a circular economy model.
Leading Players in the Manganese Market Sector
- BHP
- MOIL LIMITED
- Tata Steel
- Vale
- Carus Group Inc
- Jupiter Mines Limited
- Sibelco
- Mesa Minerals Limited
- NIPPON DENKO CO LTD
- Ningxia Tianyuan Manganese Industry Group Co Ltd
- Eramet
- Anglo American PLC
- Assore Limited (Assmang Proprietary Limited)
Key Milestones in Manganese Market Industry
- August 2020: South32 Ltd. sold its stake in TEMCO to GFG Alliance, strengthening GFG Alliance's market position. This consolidation highlights the ongoing M&A activity in the industry.
Strategic Outlook for Manganese Market Market
The future of the manganese market looks promising, with strong growth potential driven by the increasing demand from key sectors like electric vehicles, energy storage, and steel production. Strategic partnerships between mining companies and technology providers will be crucial for driving innovation and unlocking new opportunities. Focus on sustainable practices and responsible sourcing will be paramount for long-term success in this dynamic market.
Manganese Market Segmentation
-
1. Application
- 1.1. Alloys
- 1.2. Electrolytic Manganese Dioxide
- 1.3. Electrolytic Manganese Metals
- 1.4. Other Applications
-
2. End-use Sector
- 2.1. Industrial
- 2.2. Construction
- 2.3. Power Storage and Electricity
- 2.4. Other End-use Sectors
Manganese Market Segmentation By Geography
-
1. Asia Pacific
- 1.1. China
- 1.2. India
- 1.3. Japan
- 1.4. South Korea
- 1.5. Rest of Asia Pacific
-
2. North America
- 2.1. United States
- 2.2. Canada
- 2.3. Mexico
-
3. Europe
- 3.1. Germany
- 3.2. United Kingdom
- 3.3. Italy
- 3.4. France
- 3.5. Rest of Europe
-
4. South America
- 4.1. Brazil
- 4.2. Argentina
- 4.3. Rest of South America
-
5. Middle East and Africa
- 5.1. Saudi Arabia
- 5.2. South Africa
- 5.3. Rest of Middle East and Africa
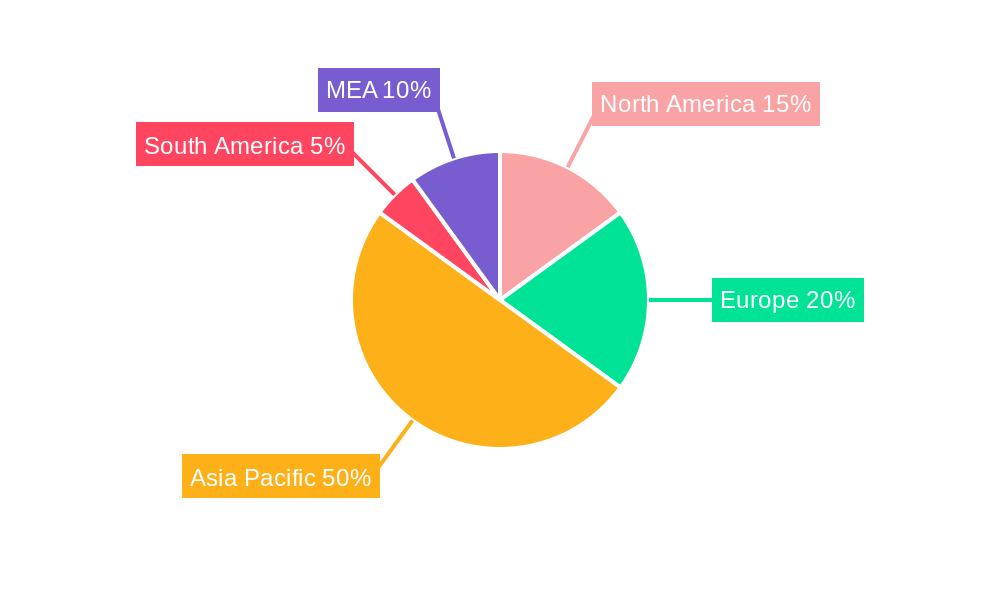
Manganese Market Regional Market Share
Geographic Coverage of Manganese Market
Manganese Market REPORT HIGHLIGHTS
| Aspects | Details |
|---|---|
| Study Period | 2020-2034 |
| Base Year | 2025 |
| Estimated Year | 2026 |
| Forecast Period | 2026-2034 |
| Historical Period | 2020-2025 |
| Growth Rate | CAGR of 5% from 2020-2034 |
| Segmentation |
|
Table of Contents
- 1. Introduction
- 1.1. Research Scope
- 1.2. Market Segmentation
- 1.3. Research Objective
- 1.4. Definitions and Assumptions
- 2. Executive Summary
- 2.1. Market Snapshot
- 3. Market Dynamics
- 3.1. Market Drivers
- 3.2. Market Restrains
- 3.3. Market Trends
- 3.4. Market Opportunities
- 4. Market Factor Analysis
- 4.1. Porters Five Forces
- 4.1.1. Bargaining Power of Suppliers
- 4.1.2. Bargaining Power of Buyers
- 4.1.3. Threat of New Entrants
- 4.1.4. Threat of Substitutes
- 4.1.5. Competitive Rivalry
- 4.2. PESTEL analysis
- 4.3. BCG Analysis
- 4.3.1. Stars (High Growth, High Market Share)
- 4.3.2. Cash Cows (Low Growth, High Market Share)
- 4.3.3. Question Mark (High Growth, Low Market Share)
- 4.3.4. Dogs (Low Growth, Low Market Share)
- 4.4. Ansoff Matrix Analysis
- 4.5. Supply Chain Analysis
- 4.6. Regulatory Landscape
- 4.7. Current Market Potential and Opportunity Assessment (TAM–SAM–SOM Framework)
- 4.8. MSR Analyst Note
- 4.1. Porters Five Forces
- 5. Market Analysis, Insights and Forecast 2021-2033
- 5.1. Market Analysis, Insights and Forecast - by Application
- 5.1.1. Alloys
- 5.1.2. Electrolytic Manganese Dioxide
- 5.1.3. Electrolytic Manganese Metals
- 5.1.4. Other Applications
- 5.2. Market Analysis, Insights and Forecast - by End-use Sector
- 5.2.1. Industrial
- 5.2.2. Construction
- 5.2.3. Power Storage and Electricity
- 5.2.4. Other End-use Sectors
- 5.3. Market Analysis, Insights and Forecast - by Region
- 5.3.1. Asia Pacific
- 5.3.2. North America
- 5.3.3. Europe
- 5.3.4. South America
- 5.3.5. Middle East and Africa
- 5.1. Market Analysis, Insights and Forecast - by Application
- 6. Global Manganese Market Analysis, Insights and Forecast, 2021-2033
- 6.1. Market Analysis, Insights and Forecast - by Application
- 6.1.1. Alloys
- 6.1.2. Electrolytic Manganese Dioxide
- 6.1.3. Electrolytic Manganese Metals
- 6.1.4. Other Applications
- 6.2. Market Analysis, Insights and Forecast - by End-use Sector
- 6.2.1. Industrial
- 6.2.2. Construction
- 6.2.3. Power Storage and Electricity
- 6.2.4. Other End-use Sectors
- 6.1. Market Analysis, Insights and Forecast - by Application
- 7. Asia Pacific Manganese Market Analysis, Insights and Forecast, 2020-2032
- 7.1. Market Analysis, Insights and Forecast - by Application
- 7.1.1. Alloys
- 7.1.2. Electrolytic Manganese Dioxide
- 7.1.3. Electrolytic Manganese Metals
- 7.1.4. Other Applications
- 7.2. Market Analysis, Insights and Forecast - by End-use Sector
- 7.2.1. Industrial
- 7.2.2. Construction
- 7.2.3. Power Storage and Electricity
- 7.2.4. Other End-use Sectors
- 7.1. Market Analysis, Insights and Forecast - by Application
- 8. North America Manganese Market Analysis, Insights and Forecast, 2020-2032
- 8.1. Market Analysis, Insights and Forecast - by Application
- 8.1.1. Alloys
- 8.1.2. Electrolytic Manganese Dioxide
- 8.1.3. Electrolytic Manganese Metals
- 8.1.4. Other Applications
- 8.2. Market Analysis, Insights and Forecast - by End-use Sector
- 8.2.1. Industrial
- 8.2.2. Construction
- 8.2.3. Power Storage and Electricity
- 8.2.4. Other End-use Sectors
- 8.1. Market Analysis, Insights and Forecast - by Application
- 9. Europe Manganese Market Analysis, Insights and Forecast, 2020-2032
- 9.1. Market Analysis, Insights and Forecast - by Application
- 9.1.1. Alloys
- 9.1.2. Electrolytic Manganese Dioxide
- 9.1.3. Electrolytic Manganese Metals
- 9.1.4. Other Applications
- 9.2. Market Analysis, Insights and Forecast - by End-use Sector
- 9.2.1. Industrial
- 9.2.2. Construction
- 9.2.3. Power Storage and Electricity
- 9.2.4. Other End-use Sectors
- 9.1. Market Analysis, Insights and Forecast - by Application
- 10. South America Manganese Market Analysis, Insights and Forecast, 2020-2032
- 10.1. Market Analysis, Insights and Forecast - by Application
- 10.1.1. Alloys
- 10.1.2. Electrolytic Manganese Dioxide
- 10.1.3. Electrolytic Manganese Metals
- 10.1.4. Other Applications
- 10.2. Market Analysis, Insights and Forecast - by End-use Sector
- 10.2.1. Industrial
- 10.2.2. Construction
- 10.2.3. Power Storage and Electricity
- 10.2.4. Other End-use Sectors
- 10.1. Market Analysis, Insights and Forecast - by Application
- 11. Middle East and Africa Manganese Market Analysis, Insights and Forecast, 2020-2032
- 11.1. Market Analysis, Insights and Forecast - by Application
- 11.1.1. Alloys
- 11.1.2. Electrolytic Manganese Dioxide
- 11.1.3. Electrolytic Manganese Metals
- 11.1.4. Other Applications
- 11.2. Market Analysis, Insights and Forecast - by End-use Sector
- 11.2.1. Industrial
- 11.2.2. Construction
- 11.2.3. Power Storage and Electricity
- 11.2.4. Other End-use Sectors
- 11.1. Market Analysis, Insights and Forecast - by Application
- 12. Competitive Analysis
- 12.1. Company Profiles
- 12.1.1 BHP
- 12.1.1.1. Company Overview
- 12.1.1.2. Products
- 12.1.1.3. Company Financials
- 12.1.1.4. SWOT Analysis
- 12.1.2 MOIL LIMITED
- 12.1.2.1. Company Overview
- 12.1.2.2. Products
- 12.1.2.3. Company Financials
- 12.1.2.4. SWOT Analysis
- 12.1.3 Tata Steel
- 12.1.3.1. Company Overview
- 12.1.3.2. Products
- 12.1.3.3. Company Financials
- 12.1.3.4. SWOT Analysis
- 12.1.4 Vale
- 12.1.4.1. Company Overview
- 12.1.4.2. Products
- 12.1.4.3. Company Financials
- 12.1.4.4. SWOT Analysis
- 12.1.5 Carus Group Inc
- 12.1.5.1. Company Overview
- 12.1.5.2. Products
- 12.1.5.3. Company Financials
- 12.1.5.4. SWOT Analysis
- 12.1.6 Jupiter Mines Limited
- 12.1.6.1. Company Overview
- 12.1.6.2. Products
- 12.1.6.3. Company Financials
- 12.1.6.4. SWOT Analysis
- 12.1.7 Sibelco
- 12.1.7.1. Company Overview
- 12.1.7.2. Products
- 12.1.7.3. Company Financials
- 12.1.7.4. SWOT Analysis
- 12.1.8 Mesa Minerals Limited
- 12.1.8.1. Company Overview
- 12.1.8.2. Products
- 12.1.8.3. Company Financials
- 12.1.8.4. SWOT Analysis
- 12.1.9 NIPPON DENKO CO LTD
- 12.1.9.1. Company Overview
- 12.1.9.2. Products
- 12.1.9.3. Company Financials
- 12.1.9.4. SWOT Analysis
- 12.1.10 Ningxia Tianyuan Manganese Industry Group Co Ltd
- 12.1.10.1. Company Overview
- 12.1.10.2. Products
- 12.1.10.3. Company Financials
- 12.1.10.4. SWOT Analysis
- 12.1.11 Eramet
- 12.1.11.1. Company Overview
- 12.1.11.2. Products
- 12.1.11.3. Company Financials
- 12.1.11.4. SWOT Analysis
- 12.1.12 Anglo American PLC
- 12.1.12.1. Company Overview
- 12.1.12.2. Products
- 12.1.12.3. Company Financials
- 12.1.12.4. SWOT Analysis
- 12.1.13 Assore Limited (Assmang Proprietary Limited)
- 12.1.13.1. Company Overview
- 12.1.13.2. Products
- 12.1.13.3. Company Financials
- 12.1.13.4. SWOT Analysis
- 12.1.1 BHP
- 12.2. Market Entropy
- 12.2.1 Company's Key Areas Served
- 12.2.2 Recent Developments
- 12.3. Company Market Share Analysis 2025
- 12.3.1 Top 5 Companies Market Share Analysis
- 12.3.2 Top 3 Companies Market Share Analysis
- 12.4. List of Potential Customers
- 13. Research Methodology
List of Figures
- Figure 1: Global Manganese Market Revenue Breakdown (Billion, %) by Region 2025 & 2033
- Figure 2: Global Manganese Market Volume Breakdown (K Tons, %) by Region 2025 & 2033
- Figure 3: Asia Pacific Manganese Market Revenue (Billion), by Application 2025 & 2033
- Figure 4: Asia Pacific Manganese Market Volume (K Tons), by Application 2025 & 2033
- Figure 5: Asia Pacific Manganese Market Revenue Share (%), by Application 2025 & 2033
- Figure 6: Asia Pacific Manganese Market Volume Share (%), by Application 2025 & 2033
- Figure 7: Asia Pacific Manganese Market Revenue (Billion), by End-use Sector 2025 & 2033
- Figure 8: Asia Pacific Manganese Market Volume (K Tons), by End-use Sector 2025 & 2033
- Figure 9: Asia Pacific Manganese Market Revenue Share (%), by End-use Sector 2025 & 2033
- Figure 10: Asia Pacific Manganese Market Volume Share (%), by End-use Sector 2025 & 2033
- Figure 11: Asia Pacific Manganese Market Revenue (Billion), by Country 2025 & 2033
- Figure 12: Asia Pacific Manganese Market Volume (K Tons), by Country 2025 & 2033
- Figure 13: Asia Pacific Manganese Market Revenue Share (%), by Country 2025 & 2033
- Figure 14: Asia Pacific Manganese Market Volume Share (%), by Country 2025 & 2033
- Figure 15: North America Manganese Market Revenue (Billion), by Application 2025 & 2033
- Figure 16: North America Manganese Market Volume (K Tons), by Application 2025 & 2033
- Figure 17: North America Manganese Market Revenue Share (%), by Application 2025 & 2033
- Figure 18: North America Manganese Market Volume Share (%), by Application 2025 & 2033
- Figure 19: North America Manganese Market Revenue (Billion), by End-use Sector 2025 & 2033
- Figure 20: North America Manganese Market Volume (K Tons), by End-use Sector 2025 & 2033
- Figure 21: North America Manganese Market Revenue Share (%), by End-use Sector 2025 & 2033
- Figure 22: North America Manganese Market Volume Share (%), by End-use Sector 2025 & 2033
- Figure 23: North America Manganese Market Revenue (Billion), by Country 2025 & 2033
- Figure 24: North America Manganese Market Volume (K Tons), by Country 2025 & 2033
- Figure 25: North America Manganese Market Revenue Share (%), by Country 2025 & 2033
- Figure 26: North America Manganese Market Volume Share (%), by Country 2025 & 2033
- Figure 27: Europe Manganese Market Revenue (Billion), by Application 2025 & 2033
- Figure 28: Europe Manganese Market Volume (K Tons), by Application 2025 & 2033
- Figure 29: Europe Manganese Market Revenue Share (%), by Application 2025 & 2033
- Figure 30: Europe Manganese Market Volume Share (%), by Application 2025 & 2033
- Figure 31: Europe Manganese Market Revenue (Billion), by End-use Sector 2025 & 2033
- Figure 32: Europe Manganese Market Volume (K Tons), by End-use Sector 2025 & 2033
- Figure 33: Europe Manganese Market Revenue Share (%), by End-use Sector 2025 & 2033
- Figure 34: Europe Manganese Market Volume Share (%), by End-use Sector 2025 & 2033
- Figure 35: Europe Manganese Market Revenue (Billion), by Country 2025 & 2033
- Figure 36: Europe Manganese Market Volume (K Tons), by Country 2025 & 2033
- Figure 37: Europe Manganese Market Revenue Share (%), by Country 2025 & 2033
- Figure 38: Europe Manganese Market Volume Share (%), by Country 2025 & 2033
- Figure 39: South America Manganese Market Revenue (Billion), by Application 2025 & 2033
- Figure 40: South America Manganese Market Volume (K Tons), by Application 2025 & 2033
- Figure 41: South America Manganese Market Revenue Share (%), by Application 2025 & 2033
- Figure 42: South America Manganese Market Volume Share (%), by Application 2025 & 2033
- Figure 43: South America Manganese Market Revenue (Billion), by End-use Sector 2025 & 2033
- Figure 44: South America Manganese Market Volume (K Tons), by End-use Sector 2025 & 2033
- Figure 45: South America Manganese Market Revenue Share (%), by End-use Sector 2025 & 2033
- Figure 46: South America Manganese Market Volume Share (%), by End-use Sector 2025 & 2033
- Figure 47: South America Manganese Market Revenue (Billion), by Country 2025 & 2033
- Figure 48: South America Manganese Market Volume (K Tons), by Country 2025 & 2033
- Figure 49: South America Manganese Market Revenue Share (%), by Country 2025 & 2033
- Figure 50: South America Manganese Market Volume Share (%), by Country 2025 & 2033
- Figure 51: Middle East and Africa Manganese Market Revenue (Billion), by Application 2025 & 2033
- Figure 52: Middle East and Africa Manganese Market Volume (K Tons), by Application 2025 & 2033
- Figure 53: Middle East and Africa Manganese Market Revenue Share (%), by Application 2025 & 2033
- Figure 54: Middle East and Africa Manganese Market Volume Share (%), by Application 2025 & 2033
- Figure 55: Middle East and Africa Manganese Market Revenue (Billion), by End-use Sector 2025 & 2033
- Figure 56: Middle East and Africa Manganese Market Volume (K Tons), by End-use Sector 2025 & 2033
- Figure 57: Middle East and Africa Manganese Market Revenue Share (%), by End-use Sector 2025 & 2033
- Figure 58: Middle East and Africa Manganese Market Volume Share (%), by End-use Sector 2025 & 2033
- Figure 59: Middle East and Africa Manganese Market Revenue (Billion), by Country 2025 & 2033
- Figure 60: Middle East and Africa Manganese Market Volume (K Tons), by Country 2025 & 2033
- Figure 61: Middle East and Africa Manganese Market Revenue Share (%), by Country 2025 & 2033
- Figure 62: Middle East and Africa Manganese Market Volume Share (%), by Country 2025 & 2033
List of Tables
- Table 1: Global Manganese Market Revenue Billion Forecast, by Application 2020 & 2033
- Table 2: Global Manganese Market Volume K Tons Forecast, by Application 2020 & 2033
- Table 3: Global Manganese Market Revenue Billion Forecast, by End-use Sector 2020 & 2033
- Table 4: Global Manganese Market Volume K Tons Forecast, by End-use Sector 2020 & 2033
- Table 5: Global Manganese Market Revenue Billion Forecast, by Region 2020 & 2033
- Table 6: Global Manganese Market Volume K Tons Forecast, by Region 2020 & 2033
- Table 7: Global Manganese Market Revenue Billion Forecast, by Application 2020 & 2033
- Table 8: Global Manganese Market Volume K Tons Forecast, by Application 2020 & 2033
- Table 9: Global Manganese Market Revenue Billion Forecast, by End-use Sector 2020 & 2033
- Table 10: Global Manganese Market Volume K Tons Forecast, by End-use Sector 2020 & 2033
- Table 11: Global Manganese Market Revenue Billion Forecast, by Country 2020 & 2033
- Table 12: Global Manganese Market Volume K Tons Forecast, by Country 2020 & 2033
- Table 13: China Manganese Market Revenue (Billion) Forecast, by Application 2020 & 2033
- Table 14: China Manganese Market Volume (K Tons) Forecast, by Application 2020 & 2033
- Table 15: India Manganese Market Revenue (Billion) Forecast, by Application 2020 & 2033
- Table 16: India Manganese Market Volume (K Tons) Forecast, by Application 2020 & 2033
- Table 17: Japan Manganese Market Revenue (Billion) Forecast, by Application 2020 & 2033
- Table 18: Japan Manganese Market Volume (K Tons) Forecast, by Application 2020 & 2033
- Table 19: South Korea Manganese Market Revenue (Billion) Forecast, by Application 2020 & 2033
- Table 20: South Korea Manganese Market Volume (K Tons) Forecast, by Application 2020 & 2033
- Table 21: Rest of Asia Pacific Manganese Market Revenue (Billion) Forecast, by Application 2020 & 2033
- Table 22: Rest of Asia Pacific Manganese Market Volume (K Tons) Forecast, by Application 2020 & 2033
- Table 23: Global Manganese Market Revenue Billion Forecast, by Application 2020 & 2033
- Table 24: Global Manganese Market Volume K Tons Forecast, by Application 2020 & 2033
- Table 25: Global Manganese Market Revenue Billion Forecast, by End-use Sector 2020 & 2033
- Table 26: Global Manganese Market Volume K Tons Forecast, by End-use Sector 2020 & 2033
- Table 27: Global Manganese Market Revenue Billion Forecast, by Country 2020 & 2033
- Table 28: Global Manganese Market Volume K Tons Forecast, by Country 2020 & 2033
- Table 29: United States Manganese Market Revenue (Billion) Forecast, by Application 2020 & 2033
- Table 30: United States Manganese Market Volume (K Tons) Forecast, by Application 2020 & 2033
- Table 31: Canada Manganese Market Revenue (Billion) Forecast, by Application 2020 & 2033
- Table 32: Canada Manganese Market Volume (K Tons) Forecast, by Application 2020 & 2033
- Table 33: Mexico Manganese Market Revenue (Billion) Forecast, by Application 2020 & 2033
- Table 34: Mexico Manganese Market Volume (K Tons) Forecast, by Application 2020 & 2033
- Table 35: Global Manganese Market Revenue Billion Forecast, by Application 2020 & 2033
- Table 36: Global Manganese Market Volume K Tons Forecast, by Application 2020 & 2033
- Table 37: Global Manganese Market Revenue Billion Forecast, by End-use Sector 2020 & 2033
- Table 38: Global Manganese Market Volume K Tons Forecast, by End-use Sector 2020 & 2033
- Table 39: Global Manganese Market Revenue Billion Forecast, by Country 2020 & 2033
- Table 40: Global Manganese Market Volume K Tons Forecast, by Country 2020 & 2033
- Table 41: Germany Manganese Market Revenue (Billion) Forecast, by Application 2020 & 2033
- Table 42: Germany Manganese Market Volume (K Tons) Forecast, by Application 2020 & 2033
- Table 43: United Kingdom Manganese Market Revenue (Billion) Forecast, by Application 2020 & 2033
- Table 44: United Kingdom Manganese Market Volume (K Tons) Forecast, by Application 2020 & 2033
- Table 45: Italy Manganese Market Revenue (Billion) Forecast, by Application 2020 & 2033
- Table 46: Italy Manganese Market Volume (K Tons) Forecast, by Application 2020 & 2033
- Table 47: France Manganese Market Revenue (Billion) Forecast, by Application 2020 & 2033
- Table 48: France Manganese Market Volume (K Tons) Forecast, by Application 2020 & 2033
- Table 49: Rest of Europe Manganese Market Revenue (Billion) Forecast, by Application 2020 & 2033
- Table 50: Rest of Europe Manganese Market Volume (K Tons) Forecast, by Application 2020 & 2033
- Table 51: Global Manganese Market Revenue Billion Forecast, by Application 2020 & 2033
- Table 52: Global Manganese Market Volume K Tons Forecast, by Application 2020 & 2033
- Table 53: Global Manganese Market Revenue Billion Forecast, by End-use Sector 2020 & 2033
- Table 54: Global Manganese Market Volume K Tons Forecast, by End-use Sector 2020 & 2033
- Table 55: Global Manganese Market Revenue Billion Forecast, by Country 2020 & 2033
- Table 56: Global Manganese Market Volume K Tons Forecast, by Country 2020 & 2033
- Table 57: Brazil Manganese Market Revenue (Billion) Forecast, by Application 2020 & 2033
- Table 58: Brazil Manganese Market Volume (K Tons) Forecast, by Application 2020 & 2033
- Table 59: Argentina Manganese Market Revenue (Billion) Forecast, by Application 2020 & 2033
- Table 60: Argentina Manganese Market Volume (K Tons) Forecast, by Application 2020 & 2033
- Table 61: Rest of South America Manganese Market Revenue (Billion) Forecast, by Application 2020 & 2033
- Table 62: Rest of South America Manganese Market Volume (K Tons) Forecast, by Application 2020 & 2033
- Table 63: Global Manganese Market Revenue Billion Forecast, by Application 2020 & 2033
- Table 64: Global Manganese Market Volume K Tons Forecast, by Application 2020 & 2033
- Table 65: Global Manganese Market Revenue Billion Forecast, by End-use Sector 2020 & 2033
- Table 66: Global Manganese Market Volume K Tons Forecast, by End-use Sector 2020 & 2033
- Table 67: Global Manganese Market Revenue Billion Forecast, by Country 2020 & 2033
- Table 68: Global Manganese Market Volume K Tons Forecast, by Country 2020 & 2033
- Table 69: Saudi Arabia Manganese Market Revenue (Billion) Forecast, by Application 2020 & 2033
- Table 70: Saudi Arabia Manganese Market Volume (K Tons) Forecast, by Application 2020 & 2033
- Table 71: South Africa Manganese Market Revenue (Billion) Forecast, by Application 2020 & 2033
- Table 72: South Africa Manganese Market Volume (K Tons) Forecast, by Application 2020 & 2033
- Table 73: Rest of Middle East and Africa Manganese Market Revenue (Billion) Forecast, by Application 2020 & 2033
- Table 74: Rest of Middle East and Africa Manganese Market Volume (K Tons) Forecast, by Application 2020 & 2033
Frequently Asked Questions
1. What is the projected Compound Annual Growth Rate (CAGR) of the Manganese Market?
The projected CAGR is approximately 5%.
2. Which companies are prominent players in the Manganese Market?
Key companies in the market include BHP, MOIL LIMITED, Tata Steel, Vale, Carus Group Inc, Jupiter Mines Limited, Sibelco, Mesa Minerals Limited, NIPPON DENKO CO LTD, Ningxia Tianyuan Manganese Industry Group Co Ltd, Eramet, Anglo American PLC, Assore Limited (Assmang Proprietary Limited).
3. What are the main segments of the Manganese Market?
The market segments include Application, End-use Sector.
4. Can you provide details about the market size?
The market size is estimated to be USD 24.4 Billion as of 2022.
5. What are some drivers contributing to market growth?
Increasing Demand of Electric Vehicles; Other Drivers.
6. What are the notable trends driving market growth?
Increasing Demand from Construction Sector.
7. Are there any restraints impacting market growth?
Other Restraints.
8. Can you provide examples of recent developments in the market?
In August 2020, South32 Ltd. announced that it would sell its entire stake in the manganese alloy smelter, Tasmanian Electro Metallurgical Company (TEMCO) to UK-based conglomerate GFG Alliance and thereby enhancing the business of GFG Alliance.
9. What pricing options are available for accessing the report?
Pricing options include single-user, multi-user, and enterprise licenses priced at USD 4750, USD 5250, and USD 8750 respectively.
10. Is the market size provided in terms of value or volume?
The market size is provided in terms of value, measured in Billion and volume, measured in K Tons.
11. Are there any specific market keywords associated with the report?
Yes, the market keyword associated with the report is "Manganese Market," which aids in identifying and referencing the specific market segment covered.
12. How do I determine which pricing option suits my needs best?
The pricing options vary based on user requirements and access needs. Individual users may opt for single-user licenses, while businesses requiring broader access may choose multi-user or enterprise licenses for cost-effective access to the report.
13. Are there any additional resources or data provided in the Manganese Market report?
While the report offers comprehensive insights, it's advisable to review the specific contents or supplementary materials provided to ascertain if additional resources or data are available.
14. How can I stay updated on further developments or reports in the Manganese Market?
To stay informed about further developments, trends, and reports in the Manganese Market, consider subscribing to industry newsletters, following relevant companies and organizations, or regularly checking reputable industry news sources and publications.
Methodology
Step 1 - Identification of Relevant Samples Size from Population Database


Step 2 - Approaches for Defining Global Market Size (Value, Volume* & Price*)

Note*: In applicable scenarios
Step 3 - Data Sources
Primary Research
- Web Analytics
- Survey Reports
- Research Institute
- Latest Research Reports
- Opinion Leaders
Secondary Research
- Annual Reports
- White Paper
- Latest Press Release
- Industry Association
- Paid Database
- Investor Presentations

Step 4 - Data Triangulation
Involves using different sources of information in order to increase the validity of a study
These sources are likely to be stakeholders in a program - participants, other researchers, program staff, other community members, and so on.
Then we put all data in single framework & apply various statistical tools to find out the dynamic on the market.
During the analysis stage, feedback from the stakeholder groups would be compared to determine areas of agreement as well as areas of divergence