

Key Insights
The Middle East and Africa (MEA) waterborne adhesives market is projected for significant expansion, with an estimated market size of 38.63 billion by 2024. The market is expected to grow at a Compound Annual Growth Rate (CAGR) of 9.5% from the base year 2024 through the forecast period to 2033. Key growth drivers include robust demand from the building and construction sector, fueled by extensive infrastructure development and urbanization. The expanding paper, board, and packaging industry also presents substantial opportunities, with a growing preference for sustainable adhesive solutions. The woodworking and joinery segment benefits from increased residential and commercial construction. Furthermore, the healthcare sector's need for advanced medical devices and packaging contributes to market momentum.
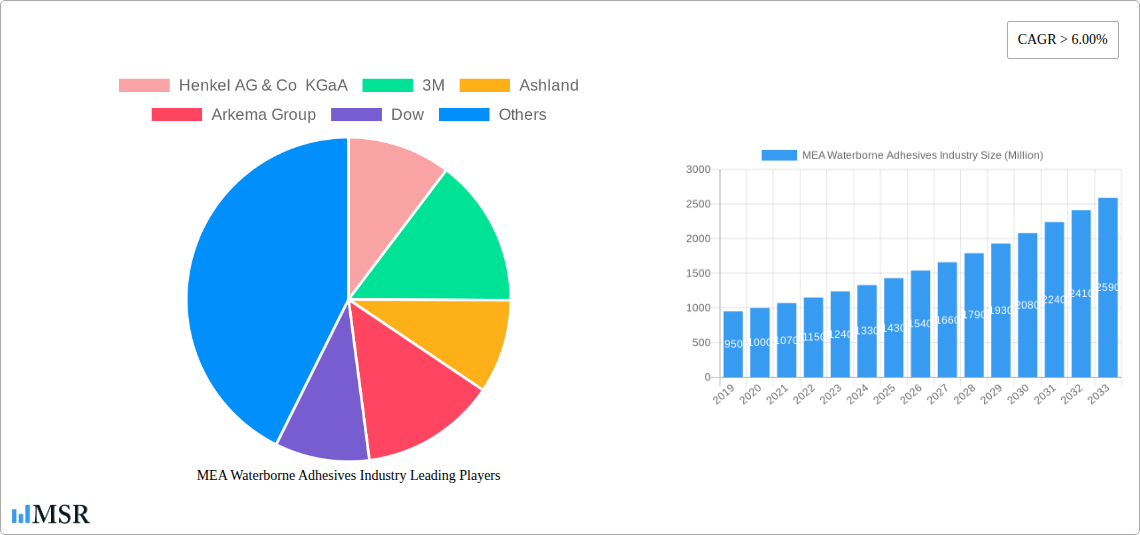
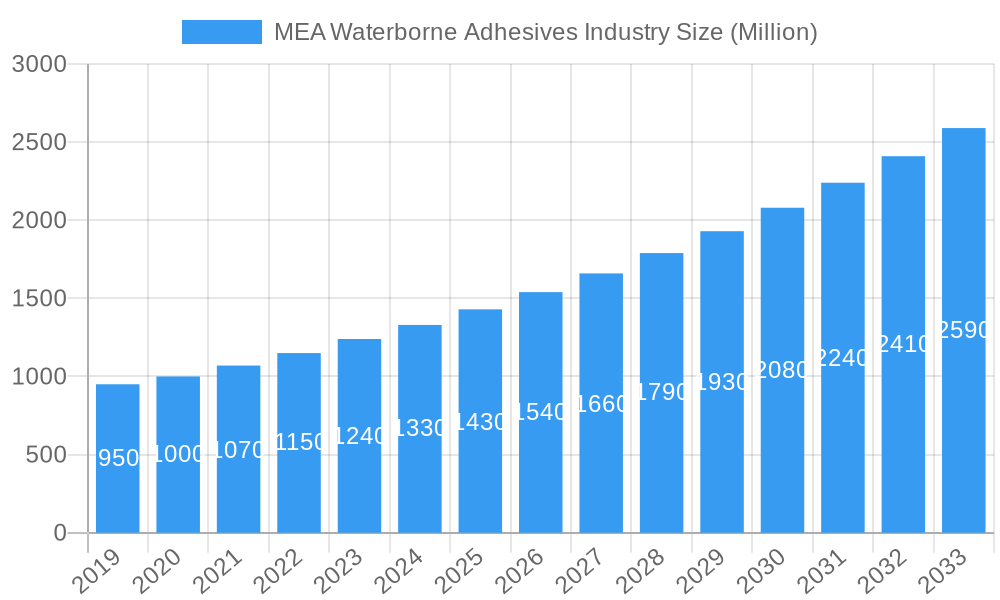
MEA Waterborne Adhesives Industry Market Size (In Billion)
Market expansion is underpinned by stringent environmental regulations that promote the adoption of low-VOC and water-based adhesives. Technological advancements in adhesive formulations, offering enhanced adhesion, faster curing, and improved durability, are also critical factors. The increasing availability of raw materials and strategic investments by key industry players in research and development and manufacturing expansion within the MEA region further support growth. Potential restraints include the initial higher cost of some waterborne adhesives and the requirement for specialized application equipment. However, the long-term environmental and safety benefits are increasingly offsetting these challenges.
MEA Waterborne Adhesives Industry Company Market Share
This comprehensive market research report offers a detailed analysis of the Middle East and Africa (MEA) Waterborne Adhesives Industry. Covering the historical period from 2019 to 2024, with a base year of 2024 and a forecast period extending to 2033, this study is essential for understanding the dynamics, growth prospects, and strategic opportunities within this vital sector. Gain insights into market size, CAGR projections, and actionable intelligence for stakeholders targeting sustainable adhesive solutions in the MEA region.
MEA Waterborne Adhesives Industry Market Concentration & Dynamics
The MEA Waterborne Adhesives Industry is characterized by a moderate to high level of market concentration, with key players like Henkel AG & Co KGaA, 3M, Ashland, Arkema Group, Dow, Avery Dennison Corporation, Sika AG, and Wacker Chemie AG holding significant market shares. The innovation ecosystem is driven by increasing demand for eco-friendly and low-VOC (Volatile Organic Compound) adhesive solutions, spurred by stringent environmental regulations across several MEA countries. Regulatory frameworks are gradually aligning with global standards, promoting the adoption of waterborne technologies over solvent-based alternatives. Substitute products, primarily solvent-based adhesives and mechanical fastening methods, present a continuous challenge, though their market penetration is declining due to performance limitations and environmental concerns. End-user trends indicate a strong preference for high-performance, versatile adhesives in the Building & Construction and Paper, Board, and Packaging sectors, driven by rapid urbanization and e-commerce growth respectively. Merger and acquisition (M&A) activities are on the rise as larger companies seek to expand their geographical reach and product portfolios within the MEA region, with an estimated XX M&A deal counts observed in the historical period.
MEA Waterborne Adhesives Industry Industry Insights & Trends
The MEA Waterborne Adhesives Industry is experiencing robust growth, projected to reach an estimated market size of $X.XX Billion by 2025 and further expand to $X.XX Billion by 2033, exhibiting a Compound Annual Growth Rate (CAGR) of XX% during the forecast period. This growth is predominantly fueled by escalating demand for sustainable and environmentally compliant adhesive solutions. Governments across the MEA region are implementing stricter regulations concerning VOC emissions, consequently driving manufacturers to transition towards waterborne formulations. The burgeoning construction sector, particularly in emerging economies within the MEA, necessitates advanced bonding solutions for infrastructure development, residential buildings, and commercial projects, thereby bolstering the demand for waterborne adhesives. Furthermore, the rapidly expanding paper, board, and packaging industry, propelled by the surge in e-commerce and consumer goods consumption, presents a significant market opportunity for high-performance waterborne adhesives used in lamination, labeling, and flexible packaging. Technological disruptions are playing a pivotal role, with ongoing research and development focused on enhancing the performance characteristics of waterborne adhesives, including improved bond strength, faster curing times, and greater resistance to environmental factors like moisture and temperature fluctuations. Innovations in resin technology, such as advancements in acrylics and polyurethane dispersions, are enabling the development of specialized adhesives for diverse applications, from automotive assembly to healthcare products. Evolving consumer behaviors, including a heightened awareness of health and environmental issues, are further accelerating the adoption of non-toxic, low-odor waterborne adhesives. The healthcare industry's increasing reliance on medical-grade adhesives for wound care, device assembly, and drug delivery systems also contributes to market expansion.
Key Markets & Segments Leading MEA Waterborne Adhesives Industry
The MEA Waterborne Adhesives Industry is witnessing dominant growth driven by specific regions and end-user segments.
Dominant Geography: Saudi Arabia and South Africa are emerging as key growth engines within the MEA region, owing to significant investments in infrastructure development, manufacturing capabilities, and a growing emphasis on adopting sustainable practices. The Rest of the Middle East and Africa also presents substantial untapped potential, fueled by economic diversification and increasing industrialization.
Dominant Resin Type: Acrylics currently hold the largest market share due to their versatility, excellent weatherability, and good adhesion properties across a wide range of substrates. Polyvinyl Acetate (PVA) Emulsion remains a cost-effective and widely used option, particularly in the woodworking and paper sectors. Ethylene Vinyl Acetate (EVA) Emulsion is gaining traction for its flexibility and strong bonding capabilities in packaging applications. Polyurethanes are increasingly sought after for high-performance applications requiring superior strength and durability.
- Acrylics: Driven by demand in building & construction, transportation, and healthcare sectors for their superior performance characteristics.
- Polyvinyl Acetate (PVA) Emulsion: Strong presence in paper, board, and packaging, and woodworking due to cost-effectiveness.
- Ethylene Vinyl Acetate (EVA) Emulsion: Growing applications in flexible packaging and laminations.
- Polyurethane: Increasing adoption in demanding applications within automotive and construction for enhanced durability.
- Other Resin Types: Emerging niche applications driving incremental growth.
Dominant End-user Industry: Building & Construction is the leading end-user industry, propelled by extensive infrastructure projects, residential development, and renovation activities across the MEA region. The Paper, Board, and Packaging sector is a close second, fueled by the e-commerce boom and the demand for sustainable packaging solutions.
- Building & Construction: Significant driver due to ongoing infrastructure projects, urbanization, and a focus on green building materials. Economic growth and government initiatives supporting housing and commercial development are key factors.
- Paper, Board, and Packaging: Experiencing rapid expansion due to the surge in e-commerce, demand for flexible packaging, and a shift towards recyclable and biodegradable materials.
- Woodworking & Joinery: Consistent demand from furniture manufacturing and construction applications.
- Transportation: Growing adoption in automotive assembly for lightweighting and interior components.
- Healthcare: Increasing use in medical device assembly, wound care, and drug delivery systems.
- Electrical & Electronics: Niche applications requiring specialized bonding solutions.
- Other End-user Industries: Emerging sectors contributing to market diversification.
MEA Waterborne Adhesives Industry Product Developments
Product innovation in the MEA Waterborne Adhesives Industry is focused on enhancing performance and sustainability. Manufacturers are developing advanced formulations with improved adhesion to challenging substrates, faster drying times, and increased resistance to heat, moisture, and chemicals. Key developments include the introduction of bio-based and renewable resin technologies, further reducing the environmental footprint of these adhesives. New applications are emerging in the automotive sector for lightweighting and interior trim, in the healthcare industry for advanced medical devices, and in the electronics sector for specialized component assembly. These technological advancements provide a competitive edge and cater to the evolving needs of a discerning market.
Challenges in the MEA Waterborne Adhesives Industry Market
Despite its growth potential, the MEA Waterborne Adhesives Industry faces several challenges. Stringent and sometimes inconsistent regulatory frameworks across different countries can hinder market entry and product standardization. Supply chain disruptions, exacerbated by geopolitical factors and logistical complexities within the region, can impact raw material availability and cost. Furthermore, competition from established solvent-based adhesives and the higher initial cost of some high-performance waterborne alternatives can present adoption barriers. The need for specialized application equipment and skilled labor for certain waterborne technologies also poses a hurdle in some developing economies.
Forces Driving MEA Waterborne Adhesives Industry Growth
Several potent forces are propelling the growth of the MEA Waterborne Adhesives Industry. The escalating global emphasis on sustainability and environmental protection is a primary driver, compelling industries to adopt low-VOC and eco-friendly solutions. Government initiatives promoting green building practices and stricter emission regulations are further accelerating this transition. Rapid urbanization and significant infrastructure development projects across key MEA economies are creating immense demand for construction adhesives. The booming e-commerce sector is spurring growth in the paper, board, and packaging industry, which heavily relies on waterborne adhesives for lamination and sealing. Technological advancements in waterborne adhesive formulations are improving their performance characteristics, making them viable alternatives for previously solvent-dependent applications.
Challenges in the MEA Waterborne Adhesives Industry Market
Long-term growth catalysts for the MEA Waterborne Adhesives Industry lie in continued innovation and strategic market expansion. The development of next-generation waterborne adhesives with superior properties, such as enhanced temperature resistance, chemical inertness, and faster curing capabilities, will unlock new application areas and solidify their market position. Strategic partnerships and collaborations between adhesive manufacturers, raw material suppliers, and end-users can foster the development of tailored solutions and accelerate market penetration. Investments in R&D focused on bio-based and recyclable adhesive technologies will align with evolving consumer preferences and regulatory demands. Furthermore, strategic market expansions into underserved regions within Africa and further diversification of applications in sectors like renewable energy and advanced manufacturing will ensure sustained long-term growth.
Emerging Opportunities in MEA Waterborne Adhesives Industry
The MEA Waterborne Adhesives Industry is ripe with emerging opportunities. The increasing focus on renewable energy infrastructure, particularly solar power installations, presents a significant opportunity for specialized adhesives used in panel assembly and maintenance. The growing demand for lightweight and sustainable materials in the automotive and aerospace sectors offers new avenues for high-performance waterborne bonding solutions. The expansion of the healthcare sector and the rising need for advanced medical devices and biocompatible adhesives create a lucrative niche. Furthermore, the exploration of new markets within Sub-Saharan Africa, characterized by rapid industrialization and infrastructure development, offers substantial untapped potential for waterborne adhesive suppliers.
Leading Players in the MEA Waterborne Adhesives Industry Sector
- Henkel AG & Co KGaA
- 3M
- Ashland
- Arkema Group
- Dow
- Avery Dennison Corporation
- Sika AG
- Wacker Chemie AG
Key Milestones in MEA Waterborne Adhesives Industry Industry
- 2019: Increased regulatory focus on VOC emissions across several MEA countries, driving early adoption of waterborne solutions.
- 2020: Surge in demand for packaging adhesives due to accelerated e-commerce growth during the global pandemic.
- 2021: Launch of new bio-based waterborne adhesive formulations by key players, signaling a commitment to sustainability.
- 2022: Significant infrastructure development projects announced in Saudi Arabia, boosting demand in the construction sector.
- 2023: Growing interest in waterborne adhesives for automotive lightweighting initiatives in the region.
- 2024: Continued advancements in acrylic and PVA emulsion technologies, expanding application possibilities.
Strategic Outlook for MEA Waterborne Adhesives Industry Market
The strategic outlook for the MEA Waterborne Adhesives Industry remains exceptionally positive, driven by a confluence of strong economic growth, favorable regulatory tailwinds, and a growing consumer preference for sustainable products. Key growth accelerators include intensified R&D efforts focused on performance enhancement and cost optimization of waterborne formulations, strategic acquisitions to consolidate market presence and expand product portfolios, and targeted market penetration into emerging African economies. Future market potential lies in the continuous innovation of specialized adhesives for high-growth sectors like renewable energy, electric vehicles, and advanced medical devices. By capitalizing on these opportunities, stakeholders can secure a robust and sustainable future within this dynamic industry.
MEA Waterborne Adhesives Industry Segmentation
-
1. Resin Type
- 1.1. Acrylics
- 1.2. Polyvinyl Acetate (PVA) Emulsion
- 1.3. Ethylene Vinyl Acetate (EVA) Emulsion
- 1.4. Polyuret
- 1.5. Other Resin Types
-
2. End-user Industry
- 2.1. Building & Construction
- 2.2. Paper, Board, and Packaging
- 2.3. Woodworking & Joinery
- 2.4. Transportation
- 2.5. Healthcare
- 2.6. Electrical & Electronics
- 2.7. Other End-user Industries
-
3. Geography
- 3.1. Saudi Arabia
- 3.2. South Africa
- 3.3. Rest of Middle-East and Africa
MEA Waterborne Adhesives Industry Segmentation By Geography
- 1. Saudi Arabia
- 2. South Africa
- 3. Rest of Middle East and Africa
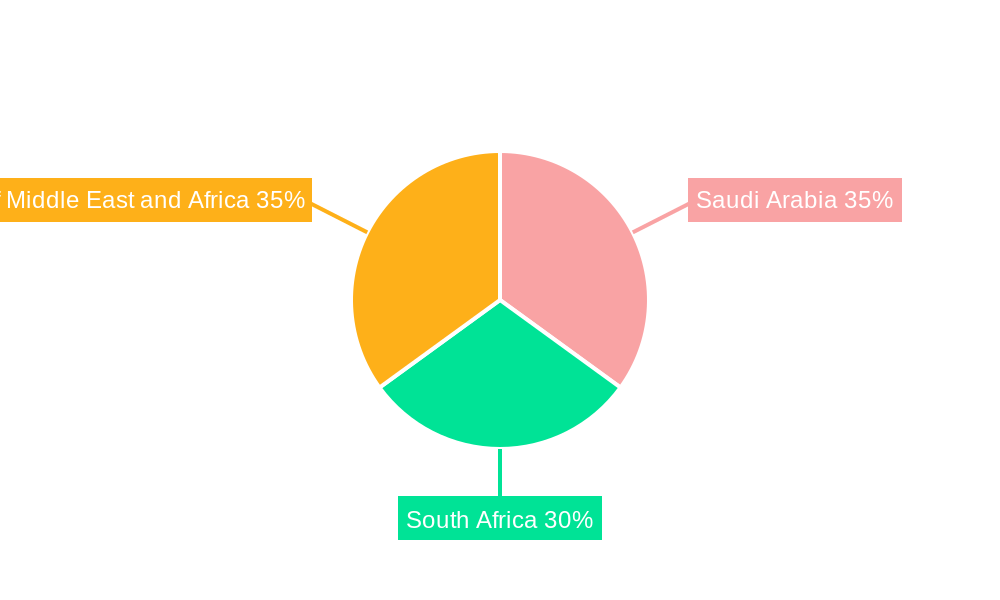
MEA Waterborne Adhesives Industry Regional Market Share
Geographic Coverage of MEA Waterborne Adhesives Industry
MEA Waterborne Adhesives Industry REPORT HIGHLIGHTS
| Aspects | Details |
|---|---|
| Study Period | 2020-2034 |
| Base Year | 2025 |
| Estimated Year | 2026 |
| Forecast Period | 2026-2034 |
| Historical Period | 2020-2025 |
| Growth Rate | CAGR of 9.5% from 2020-2034 |
| Segmentation |
|
Table of Contents
- 1. Introduction
- 1.1. Research Scope
- 1.2. Market Segmentation
- 1.3. Research Objective
- 1.4. Definitions and Assumptions
- 2. Executive Summary
- 2.1. Market Snapshot
- 3. Market Dynamics
- 3.1. Market Drivers
- 3.2. Market Restrains
- 3.3. Market Trends
- 3.4. Market Opportunities
- 4. Market Factor Analysis
- 4.1. Porters Five Forces
- 4.1.1. Bargaining Power of Suppliers
- 4.1.2. Bargaining Power of Buyers
- 4.1.3. Threat of New Entrants
- 4.1.4. Threat of Substitutes
- 4.1.5. Competitive Rivalry
- 4.2. PESTEL analysis
- 4.3. BCG Analysis
- 4.3.1. Stars (High Growth, High Market Share)
- 4.3.2. Cash Cows (Low Growth, High Market Share)
- 4.3.3. Question Mark (High Growth, Low Market Share)
- 4.3.4. Dogs (Low Growth, Low Market Share)
- 4.4. Ansoff Matrix Analysis
- 4.5. Supply Chain Analysis
- 4.6. Regulatory Landscape
- 4.7. Current Market Potential and Opportunity Assessment (TAM–SAM–SOM Framework)
- 4.8. MSR Analyst Note
- 4.1. Porters Five Forces
- 5. Market Analysis, Insights and Forecast 2021-2033
- 5.1. Market Analysis, Insights and Forecast - by Resin Type
- 5.1.1. Acrylics
- 5.1.2. Polyvinyl Acetate (PVA) Emulsion
- 5.1.3. Ethylene Vinyl Acetate (EVA) Emulsion
- 5.1.4. Polyuret
- 5.1.5. Other Resin Types
- 5.2. Market Analysis, Insights and Forecast - by End-user Industry
- 5.2.1. Building & Construction
- 5.2.2. Paper, Board, and Packaging
- 5.2.3. Woodworking & Joinery
- 5.2.4. Transportation
- 5.2.5. Healthcare
- 5.2.6. Electrical & Electronics
- 5.2.7. Other End-user Industries
- 5.3. Market Analysis, Insights and Forecast - by Geography
- 5.3.1. Saudi Arabia
- 5.3.2. South Africa
- 5.3.3. Rest of Middle-East and Africa
- 5.4. Market Analysis, Insights and Forecast - by Region
- 5.4.1. Saudi Arabia
- 5.4.2. South Africa
- 5.4.3. Rest of Middle East and Africa
- 5.1. Market Analysis, Insights and Forecast - by Resin Type
- 6. Global MEA Waterborne Adhesives Industry Analysis, Insights and Forecast, 2021-2033
- 6.1. Market Analysis, Insights and Forecast - by Resin Type
- 6.1.1. Acrylics
- 6.1.2. Polyvinyl Acetate (PVA) Emulsion
- 6.1.3. Ethylene Vinyl Acetate (EVA) Emulsion
- 6.1.4. Polyuret
- 6.1.5. Other Resin Types
- 6.2. Market Analysis, Insights and Forecast - by End-user Industry
- 6.2.1. Building & Construction
- 6.2.2. Paper, Board, and Packaging
- 6.2.3. Woodworking & Joinery
- 6.2.4. Transportation
- 6.2.5. Healthcare
- 6.2.6. Electrical & Electronics
- 6.2.7. Other End-user Industries
- 6.3. Market Analysis, Insights and Forecast - by Geography
- 6.3.1. Saudi Arabia
- 6.3.2. South Africa
- 6.3.3. Rest of Middle-East and Africa
- 6.1. Market Analysis, Insights and Forecast - by Resin Type
- 7. Saudi Arabia MEA Waterborne Adhesives Industry Analysis, Insights and Forecast, 2020-2032
- 7.1. Market Analysis, Insights and Forecast - by Resin Type
- 7.1.1. Acrylics
- 7.1.2. Polyvinyl Acetate (PVA) Emulsion
- 7.1.3. Ethylene Vinyl Acetate (EVA) Emulsion
- 7.1.4. Polyuret
- 7.1.5. Other Resin Types
- 7.2. Market Analysis, Insights and Forecast - by End-user Industry
- 7.2.1. Building & Construction
- 7.2.2. Paper, Board, and Packaging
- 7.2.3. Woodworking & Joinery
- 7.2.4. Transportation
- 7.2.5. Healthcare
- 7.2.6. Electrical & Electronics
- 7.2.7. Other End-user Industries
- 7.3. Market Analysis, Insights and Forecast - by Geography
- 7.3.1. Saudi Arabia
- 7.3.2. South Africa
- 7.3.3. Rest of Middle-East and Africa
- 7.1. Market Analysis, Insights and Forecast - by Resin Type
- 8. South Africa MEA Waterborne Adhesives Industry Analysis, Insights and Forecast, 2020-2032
- 8.1. Market Analysis, Insights and Forecast - by Resin Type
- 8.1.1. Acrylics
- 8.1.2. Polyvinyl Acetate (PVA) Emulsion
- 8.1.3. Ethylene Vinyl Acetate (EVA) Emulsion
- 8.1.4. Polyuret
- 8.1.5. Other Resin Types
- 8.2. Market Analysis, Insights and Forecast - by End-user Industry
- 8.2.1. Building & Construction
- 8.2.2. Paper, Board, and Packaging
- 8.2.3. Woodworking & Joinery
- 8.2.4. Transportation
- 8.2.5. Healthcare
- 8.2.6. Electrical & Electronics
- 8.2.7. Other End-user Industries
- 8.3. Market Analysis, Insights and Forecast - by Geography
- 8.3.1. Saudi Arabia
- 8.3.2. South Africa
- 8.3.3. Rest of Middle-East and Africa
- 8.1. Market Analysis, Insights and Forecast - by Resin Type
- 9. Rest of Middle East and Africa MEA Waterborne Adhesives Industry Analysis, Insights and Forecast, 2020-2032
- 9.1. Market Analysis, Insights and Forecast - by Resin Type
- 9.1.1. Acrylics
- 9.1.2. Polyvinyl Acetate (PVA) Emulsion
- 9.1.3. Ethylene Vinyl Acetate (EVA) Emulsion
- 9.1.4. Polyuret
- 9.1.5. Other Resin Types
- 9.2. Market Analysis, Insights and Forecast - by End-user Industry
- 9.2.1. Building & Construction
- 9.2.2. Paper, Board, and Packaging
- 9.2.3. Woodworking & Joinery
- 9.2.4. Transportation
- 9.2.5. Healthcare
- 9.2.6. Electrical & Electronics
- 9.2.7. Other End-user Industries
- 9.3. Market Analysis, Insights and Forecast - by Geography
- 9.3.1. Saudi Arabia
- 9.3.2. South Africa
- 9.3.3. Rest of Middle-East and Africa
- 9.1. Market Analysis, Insights and Forecast - by Resin Type
- 10. Competitive Analysis
- 10.1. Company Profiles
- 10.1.1 Henkel AG & Co KGaA
- 10.1.1.1. Company Overview
- 10.1.1.2. Products
- 10.1.1.3. Company Financials
- 10.1.1.4. SWOT Analysis
- 10.1.2 3M
- 10.1.2.1. Company Overview
- 10.1.2.2. Products
- 10.1.2.3. Company Financials
- 10.1.2.4. SWOT Analysis
- 10.1.3 Ashland
- 10.1.3.1. Company Overview
- 10.1.3.2. Products
- 10.1.3.3. Company Financials
- 10.1.3.4. SWOT Analysis
- 10.1.4 Arkema Group
- 10.1.4.1. Company Overview
- 10.1.4.2. Products
- 10.1.4.3. Company Financials
- 10.1.4.4. SWOT Analysis
- 10.1.5 Dow
- 10.1.5.1. Company Overview
- 10.1.5.2. Products
- 10.1.5.3. Company Financials
- 10.1.5.4. SWOT Analysis
- 10.1.6 Avery Dennison Corporation
- 10.1.6.1. Company Overview
- 10.1.6.2. Products
- 10.1.6.3. Company Financials
- 10.1.6.4. SWOT Analysis
- 10.1.7 Sika AG
- 10.1.7.1. Company Overview
- 10.1.7.2. Products
- 10.1.7.3. Company Financials
- 10.1.7.4. SWOT Analysis
- 10.1.8 Wacker Chemie AG*List Not Exhaustive
- 10.1.8.1. Company Overview
- 10.1.8.2. Products
- 10.1.8.3. Company Financials
- 10.1.8.4. SWOT Analysis
- 10.1.1 Henkel AG & Co KGaA
- 10.2. Market Entropy
- 10.2.1 Company's Key Areas Served
- 10.2.2 Recent Developments
- 10.3. Company Market Share Analysis 2025
- 10.3.1 Top 5 Companies Market Share Analysis
- 10.3.2 Top 3 Companies Market Share Analysis
- 10.4. List of Potential Customers
- 11. Research Methodology
List of Figures
- Figure 1: Global MEA Waterborne Adhesives Industry Revenue Breakdown (billion, %) by Region 2025 & 2033
- Figure 2: Saudi Arabia MEA Waterborne Adhesives Industry Revenue (billion), by Resin Type 2025 & 2033
- Figure 3: Saudi Arabia MEA Waterborne Adhesives Industry Revenue Share (%), by Resin Type 2025 & 2033
- Figure 4: Saudi Arabia MEA Waterborne Adhesives Industry Revenue (billion), by End-user Industry 2025 & 2033
- Figure 5: Saudi Arabia MEA Waterborne Adhesives Industry Revenue Share (%), by End-user Industry 2025 & 2033
- Figure 6: Saudi Arabia MEA Waterborne Adhesives Industry Revenue (billion), by Geography 2025 & 2033
- Figure 7: Saudi Arabia MEA Waterborne Adhesives Industry Revenue Share (%), by Geography 2025 & 2033
- Figure 8: Saudi Arabia MEA Waterborne Adhesives Industry Revenue (billion), by Country 2025 & 2033
- Figure 9: Saudi Arabia MEA Waterborne Adhesives Industry Revenue Share (%), by Country 2025 & 2033
- Figure 10: South Africa MEA Waterborne Adhesives Industry Revenue (billion), by Resin Type 2025 & 2033
- Figure 11: South Africa MEA Waterborne Adhesives Industry Revenue Share (%), by Resin Type 2025 & 2033
- Figure 12: South Africa MEA Waterborne Adhesives Industry Revenue (billion), by End-user Industry 2025 & 2033
- Figure 13: South Africa MEA Waterborne Adhesives Industry Revenue Share (%), by End-user Industry 2025 & 2033
- Figure 14: South Africa MEA Waterborne Adhesives Industry Revenue (billion), by Geography 2025 & 2033
- Figure 15: South Africa MEA Waterborne Adhesives Industry Revenue Share (%), by Geography 2025 & 2033
- Figure 16: South Africa MEA Waterborne Adhesives Industry Revenue (billion), by Country 2025 & 2033
- Figure 17: South Africa MEA Waterborne Adhesives Industry Revenue Share (%), by Country 2025 & 2033
- Figure 18: Rest of Middle East and Africa MEA Waterborne Adhesives Industry Revenue (billion), by Resin Type 2025 & 2033
- Figure 19: Rest of Middle East and Africa MEA Waterborne Adhesives Industry Revenue Share (%), by Resin Type 2025 & 2033
- Figure 20: Rest of Middle East and Africa MEA Waterborne Adhesives Industry Revenue (billion), by End-user Industry 2025 & 2033
- Figure 21: Rest of Middle East and Africa MEA Waterborne Adhesives Industry Revenue Share (%), by End-user Industry 2025 & 2033
- Figure 22: Rest of Middle East and Africa MEA Waterborne Adhesives Industry Revenue (billion), by Geography 2025 & 2033
- Figure 23: Rest of Middle East and Africa MEA Waterborne Adhesives Industry Revenue Share (%), by Geography 2025 & 2033
- Figure 24: Rest of Middle East and Africa MEA Waterborne Adhesives Industry Revenue (billion), by Country 2025 & 2033
- Figure 25: Rest of Middle East and Africa MEA Waterborne Adhesives Industry Revenue Share (%), by Country 2025 & 2033
List of Tables
- Table 1: Global MEA Waterborne Adhesives Industry Revenue billion Forecast, by Resin Type 2020 & 2033
- Table 2: Global MEA Waterborne Adhesives Industry Revenue billion Forecast, by End-user Industry 2020 & 2033
- Table 3: Global MEA Waterborne Adhesives Industry Revenue billion Forecast, by Geography 2020 & 2033
- Table 4: Global MEA Waterborne Adhesives Industry Revenue billion Forecast, by Region 2020 & 2033
- Table 5: Global MEA Waterborne Adhesives Industry Revenue billion Forecast, by Resin Type 2020 & 2033
- Table 6: Global MEA Waterborne Adhesives Industry Revenue billion Forecast, by End-user Industry 2020 & 2033
- Table 7: Global MEA Waterborne Adhesives Industry Revenue billion Forecast, by Geography 2020 & 2033
- Table 8: Global MEA Waterborne Adhesives Industry Revenue billion Forecast, by Country 2020 & 2033
- Table 9: Global MEA Waterborne Adhesives Industry Revenue billion Forecast, by Resin Type 2020 & 2033
- Table 10: Global MEA Waterborne Adhesives Industry Revenue billion Forecast, by End-user Industry 2020 & 2033
- Table 11: Global MEA Waterborne Adhesives Industry Revenue billion Forecast, by Geography 2020 & 2033
- Table 12: Global MEA Waterborne Adhesives Industry Revenue billion Forecast, by Country 2020 & 2033
- Table 13: Global MEA Waterborne Adhesives Industry Revenue billion Forecast, by Resin Type 2020 & 2033
- Table 14: Global MEA Waterborne Adhesives Industry Revenue billion Forecast, by End-user Industry 2020 & 2033
- Table 15: Global MEA Waterborne Adhesives Industry Revenue billion Forecast, by Geography 2020 & 2033
- Table 16: Global MEA Waterborne Adhesives Industry Revenue billion Forecast, by Country 2020 & 2033
Frequently Asked Questions
1. What is the projected Compound Annual Growth Rate (CAGR) of the MEA Waterborne Adhesives Industry?
The projected CAGR is approximately 9.5%.
2. Which companies are prominent players in the MEA Waterborne Adhesives Industry?
Key companies in the market include Henkel AG & Co KGaA, 3M, Ashland, Arkema Group, Dow, Avery Dennison Corporation, Sika AG, Wacker Chemie AG*List Not Exhaustive.
3. What are the main segments of the MEA Waterborne Adhesives Industry?
The market segments include Resin Type, End-user Industry, Geography.
4. Can you provide details about the market size?
The market size is estimated to be USD 38.63 billion as of 2022.
5. What are some drivers contributing to market growth?
; Availability of Raw Materials and Low Production Cost; Increasing Demand from Construction Industry.
6. What are the notable trends driving market growth?
Building & Construction to Dominate the Market.
7. Are there any restraints impacting market growth?
; Limited Usage in High End Applications; Other Restraints.
8. Can you provide examples of recent developments in the market?
N/A
9. What pricing options are available for accessing the report?
Pricing options include single-user, multi-user, and enterprise licenses priced at USD 4750, USD 5250, and USD 8750 respectively.
10. Is the market size provided in terms of value or volume?
The market size is provided in terms of value, measured in billion.
11. Are there any specific market keywords associated with the report?
Yes, the market keyword associated with the report is "MEA Waterborne Adhesives Industry," which aids in identifying and referencing the specific market segment covered.
12. How do I determine which pricing option suits my needs best?
The pricing options vary based on user requirements and access needs. Individual users may opt for single-user licenses, while businesses requiring broader access may choose multi-user or enterprise licenses for cost-effective access to the report.
13. Are there any additional resources or data provided in the MEA Waterborne Adhesives Industry report?
While the report offers comprehensive insights, it's advisable to review the specific contents or supplementary materials provided to ascertain if additional resources or data are available.
14. How can I stay updated on further developments or reports in the MEA Waterborne Adhesives Industry?
To stay informed about further developments, trends, and reports in the MEA Waterborne Adhesives Industry, consider subscribing to industry newsletters, following relevant companies and organizations, or regularly checking reputable industry news sources and publications.
Methodology
Step 1 - Identification of Relevant Samples Size from Population Database


Step 2 - Approaches for Defining Global Market Size (Value, Volume* & Price*)

Note*: In applicable scenarios
Step 3 - Data Sources
Primary Research
- Web Analytics
- Survey Reports
- Research Institute
- Latest Research Reports
- Opinion Leaders
Secondary Research
- Annual Reports
- White Paper
- Latest Press Release
- Industry Association
- Paid Database
- Investor Presentations

Step 4 - Data Triangulation
Involves using different sources of information in order to increase the validity of a study
These sources are likely to be stakeholders in a program - participants, other researchers, program staff, other community members, and so on.
Then we put all data in single framework & apply various statistical tools to find out the dynamic on the market.
During the analysis stage, feedback from the stakeholder groups would be compared to determine areas of agreement as well as areas of divergence