

Key Insights
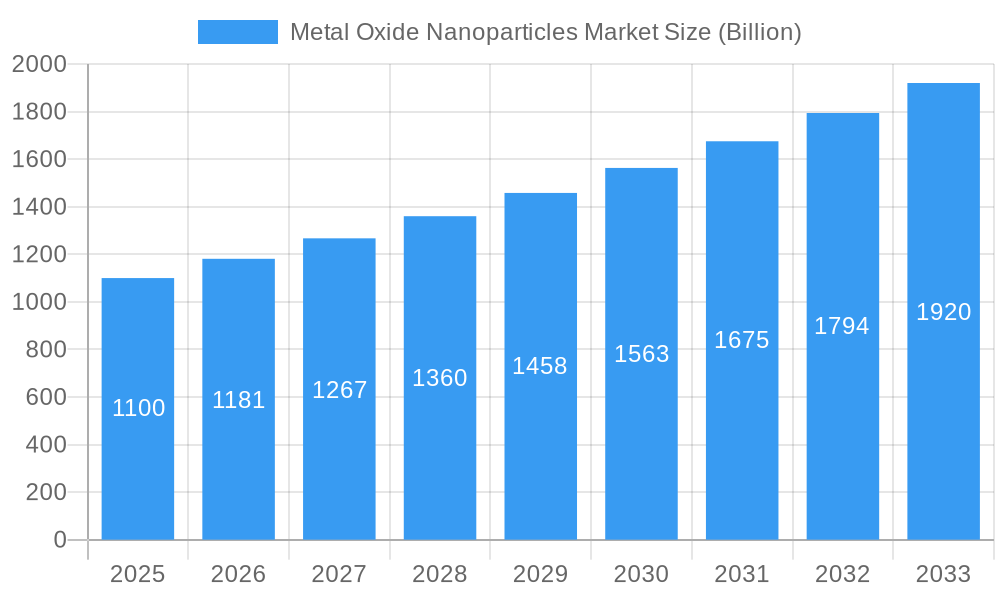
The Metal Oxide Nanoparticles market is experiencing robust growth, projected to reach a value of $1.1 billion in 2025 and maintain a Compound Annual Growth Rate (CAGR) of 7.28% from 2025 to 2033. This expansion is driven by several key factors. The increasing demand for advanced materials in optics and electronics, fueled by the proliferation of smartphones, displays, and other electronic devices, is a significant contributor. Furthermore, the healthcare sector's growing adoption of metal oxide nanoparticles in drug delivery systems, diagnostics, and biomedical imaging is boosting market growth. The construction industry's utilization of these nanoparticles for enhanced building materials, along with their increasing application in the automotive and transportation sectors for improved performance and durability, further contributes to market expansion. The diverse range of applications across various end-use industries, encompassing personal care products to specialized industrial applications, ensures a broad and resilient market.
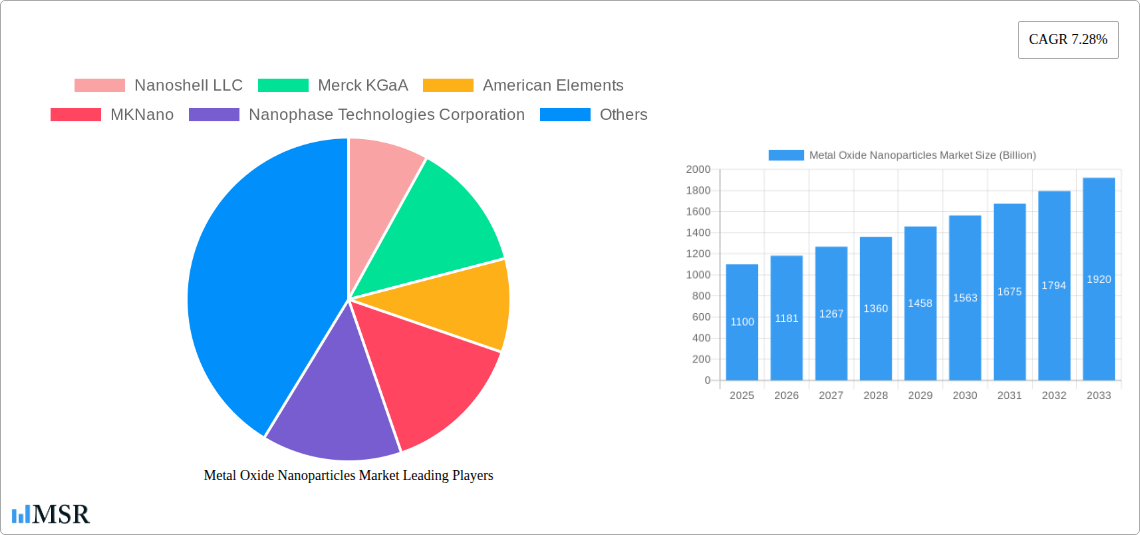
Metal Oxide Nanoparticles Market Market Size (In Billion)
However, challenges remain. Cost considerations associated with the production and processing of metal oxide nanoparticles can present barriers to entry and widespread adoption. Moreover, regulatory concerns regarding the potential health and environmental impacts of these materials necessitate careful consideration and adherence to stringent safety standards, potentially influencing market trajectory. The market is segmented by product type (Aluminum Oxide, Titanium Dioxide, Silicon Dioxide, Magnesium Oxide, Zinc Oxide, and Others) and end-user industry (Optics & Electronics, Healthcare, Construction, Automotive & Transportation, Personal Care, and Others). Competition within the market is dynamic, with key players including Nanoshell LLC, Merck KGaA, American Elements, and others constantly innovating and striving for market share. Geographical expansion, particularly within the rapidly developing economies of Asia-Pacific, presents significant opportunities for future growth. The market's ongoing evolution is expected to be shaped by technological advancements, regulatory landscape changes, and the continuous search for more efficient and sustainable production methods.
Metal Oxide Nanoparticles Market Company Market Share
Dive Deep into the Thriving Metal Oxide Nanoparticles Market: A Comprehensive Report (2019-2033)
This meticulously researched report provides a comprehensive analysis of the Metal Oxide Nanoparticles market, offering invaluable insights for stakeholders seeking to navigate this dynamic landscape. Valued at $XX Billion in 2025, the market is poised for significant growth, projected to reach $XX Billion by 2033, exhibiting a CAGR of XX%. This in-depth study covers the period 2019-2033, with 2025 serving as the base year.
Metal Oxide Nanoparticles Market Concentration & Dynamics
The Metal Oxide Nanoparticles market demonstrates a moderately concentrated landscape, with key players like Merck KGaA, Nanoshell LLC, and American Elements holding significant market share. The market is characterized by a dynamic interplay of innovation ecosystems, stringent regulatory frameworks (varying by region), and the emergence of substitute materials. End-user trends, particularly in the healthcare and electronics sectors, significantly influence market growth. M&A activity has been moderate, with approximately XX deals recorded between 2019 and 2024. This suggests a landscape ripe for strategic partnerships and acquisitions.
- Market Share: Top 5 players account for approximately XX% of the global market.
- M&A Activity: An average of XX M&A deals per year were observed during the historical period.
- Regulatory Landscape: Stringent regulations concerning nanoparticle safety and environmental impact vary across different geographical regions.
- Substitute Products: The market faces competition from alternative materials with similar functionalities, driving innovation in cost-effectiveness and performance.
- End-User Trends: Growing demand from sectors like healthcare (drug delivery, diagnostics) and electronics (displays, sensors) are major growth drivers.
Metal Oxide Nanoparticles Market Industry Insights & Trends
The Metal Oxide Nanoparticles market is experiencing robust growth, driven by technological advancements, expanding applications, and increasing demand across diverse end-user industries. The market size is estimated at $XX Billion in 2025 and is projected to reach $XX Billion by 2033. The consistent growth is fueled by several factors: the rising adoption of metal oxide nanoparticles in various applications; the increasing demand for advanced materials with enhanced properties; and continuous research and development efforts leading to innovative product development. Furthermore, evolving consumer preferences for sustainable and eco-friendly products are influencing the market's growth trajectory. Technological disruptions, particularly in nanotechnology and materials science, are further accelerating innovation and expansion.
Key Markets & Segments Leading Metal Oxide Nanoparticles Market
The Asia Pacific region is currently the dominant market for Metal Oxide Nanoparticles, fueled by rapid industrialization and economic growth, particularly in countries like China and India. Within product segments, Titanium Dioxide and Zinc Oxide are the leading materials due to their widespread applications in cosmetics, paints, and sunscreens. In end-user industries, the Optics & Electronics sector holds the largest share, driven by the increasing demand for advanced electronic devices and optical components.
- Regional Dominance: Asia Pacific holds the largest market share due to rapid economic growth and expanding industrial sectors.
- Product Segment Leaders: Titanium Dioxide and Zinc Oxide dominate due to high demand in diverse applications.
- End-User Industry Dominance: Optics & Electronics shows the highest demand due to widespread use in advanced technologies.
- Growth Drivers:
- Rapid industrialization in developing economies
- Growing demand for advanced materials in diverse sectors
- Technological advancements driving innovation and application expansion
Metal Oxide Nanoparticles Market Product Developments
Recent years have witnessed significant advancements in Metal Oxide Nanoparticle production techniques, leading to improved quality, enhanced properties, and wider applications. This includes the development of more efficient synthesis methods, improved surface functionalization techniques, and the exploration of novel nanoparticle compositions. These innovations are crucial for addressing specific industrial needs and expanding into new markets, thereby fostering competitiveness.
Challenges in the Metal Oxide Nanoparticles Market Market
The Metal Oxide Nanoparticles market faces several challenges, including stringent regulatory requirements regarding safety and environmental impact, complexities in the supply chain, and intense competition among established and emerging players. These factors can lead to increased production costs and market entry barriers, potentially limiting market growth. Concerns over potential health and environmental risks associated with nanoparticles also present ongoing challenges. The fluctuation of raw material prices can also impact the profitability and stability of the market.
Forces Driving Metal Oxide Nanoparticles Market Growth
Key growth drivers include rising demand for advanced materials across various sectors, ongoing technological advancements in nanotechnology, and favorable government initiatives promoting research and development. The increasing adoption of metal oxide nanoparticles in consumer products and industrial applications further fuels market expansion. Economic growth, particularly in developing economies, is also a major contributor.
Long-Term Growth Catalysts in the Metal Oxide Nanoparticles Market
Long-term growth in this market is strongly linked to continuous innovation in nanoparticle synthesis and functionalization, strategic partnerships among industry players, and the exploration of new and expanding application areas. Investment in R&D, coupled with the development of sustainable and cost-effective manufacturing processes, will play a pivotal role in shaping future market dynamics.
Emerging Opportunities in Metal Oxide Nanoparticles Market
Emerging opportunities lie in the development of novel applications for metal oxide nanoparticles, particularly in areas like targeted drug delivery, advanced sensors, and sustainable energy solutions. Exploring new markets in developing economies, coupled with the advancement of eco-friendly and sustainable manufacturing methods, presents significant potential for growth.
Leading Players in the Metal Oxide Nanoparticles Market Sector
- Nanoshell LLC
- Merck KGaA
- American Elements
- MKNano
- Nanophase Technologies Corporation
- EPRUI Biotech Co Ltd
- Xuan Cheng Jing Rui New Material Co Ltd
- NanoResearch Elements Inc
- Meliorum Technologies Inc
- Reinste
- SkySpring Nanomaterials Inc
Key Milestones in Metal Oxide Nanoparticles Market Industry
- 2020: Significant investment in R&D by several key players for developing novel Metal Oxide Nanoparticles with enhanced properties.
- 2021: Launch of several new products with improved functionalities and applications.
- 2022: Introduction of stricter regulatory guidelines in certain regions impacting market dynamics.
- 2023: Strategic alliances formed between major players focusing on collaborative research and development.
- 2024: Several successful product launches significantly impacting market penetration and growth.
Strategic Outlook for Metal Oxide Nanoparticles Market Market
The Metal Oxide Nanoparticles market is poised for substantial growth over the forecast period, driven by technological advancements, increasing demand across various sectors, and strategic collaborations. Companies focusing on innovation, sustainable manufacturing, and expansion into emerging markets are best positioned to capitalize on the market's considerable potential. The market's long-term growth trajectory will be significantly influenced by continuous research and development, addressing regulatory challenges effectively and successfully navigating the competitive landscape.
Metal Oxide Nanoparticles Market Segmentation
-
1. Product
- 1.1. Aluminium Oxide
- 1.2. Titanium Dioxide
- 1.3. Silicon Dioxide
- 1.4. Magnesium Oxide
- 1.5. Zinc Oxide
- 1.6. Others
-
2. End-user Industry
- 2.1. Optics & Electronics
- 2.2. Healthcare
- 2.3. Construction
- 2.4. Automotive & Transportation
- 2.5. Personal Care
- 2.6. Others
Metal Oxide Nanoparticles Market Segmentation By Geography
-
1. Asia Pacific
- 1.1. China
- 1.2. India
- 1.3. Japan
- 1.4. South Korea
- 1.5. Rest of Asia Pacific
-
2. North America
- 2.1. United States
- 2.2. Canada
- 2.3. Mexico
-
3. Europe
- 3.1. Germany
- 3.2. United Kingdom
- 3.3. France
- 3.4. Italy
- 3.5. Rest of Europe
-
4. Rest of the World
- 4.1. South America
- 4.2. Middle East and Africa
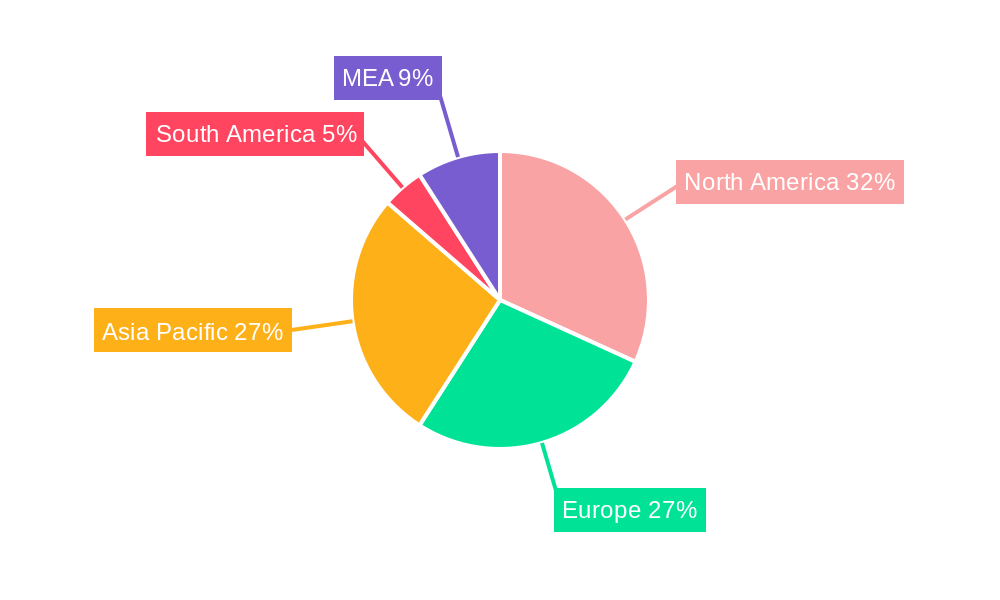
Metal Oxide Nanoparticles Market Regional Market Share
Geographic Coverage of Metal Oxide Nanoparticles Market
Metal Oxide Nanoparticles Market REPORT HIGHLIGHTS
| Aspects | Details |
|---|---|
| Study Period | 2020-2034 |
| Base Year | 2025 |
| Estimated Year | 2026 |
| Forecast Period | 2026-2034 |
| Historical Period | 2020-2025 |
| Growth Rate | CAGR of 7.28% from 2020-2034 |
| Segmentation |
|
Table of Contents
- 1. Introduction
- 1.1. Research Scope
- 1.2. Market Segmentation
- 1.3. Research Methodology
- 1.4. Definitions and Assumptions
- 2. Executive Summary
- 2.1. Introduction
- 3. Market Dynamics
- 3.1. Introduction
- 3.2. Market Drivers
- 3.2.1. ; Growing Electronics Industry; Rising Demand from Pharmaceutical Sector
- 3.3. Market Restrains
- 3.3.1. ; Hazardous Nature of Metal Oxide Nanoparticles; Unfavorable Conditions Arising Due to COVID-19 Outbreak
- 3.4. Market Trends
- 3.4.1. Electronics Sector to Dominate the Market
- 4. Market Factor Analysis
- 4.1. Porters Five Forces
- 4.2. Supply/Value Chain
- 4.3. PESTEL analysis
- 4.4. Market Entropy
- 4.5. Patent/Trademark Analysis
- 5. Global Metal Oxide Nanoparticles Market Analysis, Insights and Forecast, 2020-2032
- 5.1. Market Analysis, Insights and Forecast - by Product
- 5.1.1. Aluminium Oxide
- 5.1.2. Titanium Dioxide
- 5.1.3. Silicon Dioxide
- 5.1.4. Magnesium Oxide
- 5.1.5. Zinc Oxide
- 5.1.6. Others
- 5.2. Market Analysis, Insights and Forecast - by End-user Industry
- 5.2.1. Optics & Electronics
- 5.2.2. Healthcare
- 5.2.3. Construction
- 5.2.4. Automotive & Transportation
- 5.2.5. Personal Care
- 5.2.6. Others
- 5.3. Market Analysis, Insights and Forecast - by Region
- 5.3.1. Asia Pacific
- 5.3.2. North America
- 5.3.3. Europe
- 5.3.4. Rest of the World
- 5.1. Market Analysis, Insights and Forecast - by Product
- 6. Asia Pacific Metal Oxide Nanoparticles Market Analysis, Insights and Forecast, 2020-2032
- 6.1. Market Analysis, Insights and Forecast - by Product
- 6.1.1. Aluminium Oxide
- 6.1.2. Titanium Dioxide
- 6.1.3. Silicon Dioxide
- 6.1.4. Magnesium Oxide
- 6.1.5. Zinc Oxide
- 6.1.6. Others
- 6.2. Market Analysis, Insights and Forecast - by End-user Industry
- 6.2.1. Optics & Electronics
- 6.2.2. Healthcare
- 6.2.3. Construction
- 6.2.4. Automotive & Transportation
- 6.2.5. Personal Care
- 6.2.6. Others
- 6.1. Market Analysis, Insights and Forecast - by Product
- 7. North America Metal Oxide Nanoparticles Market Analysis, Insights and Forecast, 2020-2032
- 7.1. Market Analysis, Insights and Forecast - by Product
- 7.1.1. Aluminium Oxide
- 7.1.2. Titanium Dioxide
- 7.1.3. Silicon Dioxide
- 7.1.4. Magnesium Oxide
- 7.1.5. Zinc Oxide
- 7.1.6. Others
- 7.2. Market Analysis, Insights and Forecast - by End-user Industry
- 7.2.1. Optics & Electronics
- 7.2.2. Healthcare
- 7.2.3. Construction
- 7.2.4. Automotive & Transportation
- 7.2.5. Personal Care
- 7.2.6. Others
- 7.1. Market Analysis, Insights and Forecast - by Product
- 8. Europe Metal Oxide Nanoparticles Market Analysis, Insights and Forecast, 2020-2032
- 8.1. Market Analysis, Insights and Forecast - by Product
- 8.1.1. Aluminium Oxide
- 8.1.2. Titanium Dioxide
- 8.1.3. Silicon Dioxide
- 8.1.4. Magnesium Oxide
- 8.1.5. Zinc Oxide
- 8.1.6. Others
- 8.2. Market Analysis, Insights and Forecast - by End-user Industry
- 8.2.1. Optics & Electronics
- 8.2.2. Healthcare
- 8.2.3. Construction
- 8.2.4. Automotive & Transportation
- 8.2.5. Personal Care
- 8.2.6. Others
- 8.1. Market Analysis, Insights and Forecast - by Product
- 9. Rest of the World Metal Oxide Nanoparticles Market Analysis, Insights and Forecast, 2020-2032
- 9.1. Market Analysis, Insights and Forecast - by Product
- 9.1.1. Aluminium Oxide
- 9.1.2. Titanium Dioxide
- 9.1.3. Silicon Dioxide
- 9.1.4. Magnesium Oxide
- 9.1.5. Zinc Oxide
- 9.1.6. Others
- 9.2. Market Analysis, Insights and Forecast - by End-user Industry
- 9.2.1. Optics & Electronics
- 9.2.2. Healthcare
- 9.2.3. Construction
- 9.2.4. Automotive & Transportation
- 9.2.5. Personal Care
- 9.2.6. Others
- 9.1. Market Analysis, Insights and Forecast - by Product
- 10. Competitive Analysis
- 10.1. Global Market Share Analysis 2025
- 10.2. Company Profiles
- 10.2.1 Nanoshell LLC
- 10.2.1.1. Overview
- 10.2.1.2. Products
- 10.2.1.3. SWOT Analysis
- 10.2.1.4. Recent Developments
- 10.2.1.5. Financials (Based on Availability)
- 10.2.2 Merck KGaA
- 10.2.2.1. Overview
- 10.2.2.2. Products
- 10.2.2.3. SWOT Analysis
- 10.2.2.4. Recent Developments
- 10.2.2.5. Financials (Based on Availability)
- 10.2.3 American Elements
- 10.2.3.1. Overview
- 10.2.3.2. Products
- 10.2.3.3. SWOT Analysis
- 10.2.3.4. Recent Developments
- 10.2.3.5. Financials (Based on Availability)
- 10.2.4 MKNano
- 10.2.4.1. Overview
- 10.2.4.2. Products
- 10.2.4.3. SWOT Analysis
- 10.2.4.4. Recent Developments
- 10.2.4.5. Financials (Based on Availability)
- 10.2.5 Nanophase Technologies Corporation
- 10.2.5.1. Overview
- 10.2.5.2. Products
- 10.2.5.3. SWOT Analysis
- 10.2.5.4. Recent Developments
- 10.2.5.5. Financials (Based on Availability)
- 10.2.6 EPRUI Biotech Co Ltd
- 10.2.6.1. Overview
- 10.2.6.2. Products
- 10.2.6.3. SWOT Analysis
- 10.2.6.4. Recent Developments
- 10.2.6.5. Financials (Based on Availability)
- 10.2.7 Xuan Cheng Jing Rui New Material Co Ltd
- 10.2.7.1. Overview
- 10.2.7.2. Products
- 10.2.7.3. SWOT Analysis
- 10.2.7.4. Recent Developments
- 10.2.7.5. Financials (Based on Availability)
- 10.2.8 NanoResearch Elements Inc
- 10.2.8.1. Overview
- 10.2.8.2. Products
- 10.2.8.3. SWOT Analysis
- 10.2.8.4. Recent Developments
- 10.2.8.5. Financials (Based on Availability)
- 10.2.9 Meliorum Technologies Inc
- 10.2.9.1. Overview
- 10.2.9.2. Products
- 10.2.9.3. SWOT Analysis
- 10.2.9.4. Recent Developments
- 10.2.9.5. Financials (Based on Availability)
- 10.2.10 Reinste
- 10.2.10.1. Overview
- 10.2.10.2. Products
- 10.2.10.3. SWOT Analysis
- 10.2.10.4. Recent Developments
- 10.2.10.5. Financials (Based on Availability)
- 10.2.11 SkySpring Nanomaterials Inc
- 10.2.11.1. Overview
- 10.2.11.2. Products
- 10.2.11.3. SWOT Analysis
- 10.2.11.4. Recent Developments
- 10.2.11.5. Financials (Based on Availability)
- 10.2.1 Nanoshell LLC
List of Figures
- Figure 1: Global Metal Oxide Nanoparticles Market Revenue Breakdown (Billion, %) by Region 2025 & 2033
- Figure 2: Global Metal Oxide Nanoparticles Market Volume Breakdown (K Tons, %) by Region 2025 & 2033
- Figure 3: Asia Pacific Metal Oxide Nanoparticles Market Revenue (Billion), by Product 2025 & 2033
- Figure 4: Asia Pacific Metal Oxide Nanoparticles Market Volume (K Tons), by Product 2025 & 2033
- Figure 5: Asia Pacific Metal Oxide Nanoparticles Market Revenue Share (%), by Product 2025 & 2033
- Figure 6: Asia Pacific Metal Oxide Nanoparticles Market Volume Share (%), by Product 2025 & 2033
- Figure 7: Asia Pacific Metal Oxide Nanoparticles Market Revenue (Billion), by End-user Industry 2025 & 2033
- Figure 8: Asia Pacific Metal Oxide Nanoparticles Market Volume (K Tons), by End-user Industry 2025 & 2033
- Figure 9: Asia Pacific Metal Oxide Nanoparticles Market Revenue Share (%), by End-user Industry 2025 & 2033
- Figure 10: Asia Pacific Metal Oxide Nanoparticles Market Volume Share (%), by End-user Industry 2025 & 2033
- Figure 11: Asia Pacific Metal Oxide Nanoparticles Market Revenue (Billion), by Country 2025 & 2033
- Figure 12: Asia Pacific Metal Oxide Nanoparticles Market Volume (K Tons), by Country 2025 & 2033
- Figure 13: Asia Pacific Metal Oxide Nanoparticles Market Revenue Share (%), by Country 2025 & 2033
- Figure 14: Asia Pacific Metal Oxide Nanoparticles Market Volume Share (%), by Country 2025 & 2033
- Figure 15: North America Metal Oxide Nanoparticles Market Revenue (Billion), by Product 2025 & 2033
- Figure 16: North America Metal Oxide Nanoparticles Market Volume (K Tons), by Product 2025 & 2033
- Figure 17: North America Metal Oxide Nanoparticles Market Revenue Share (%), by Product 2025 & 2033
- Figure 18: North America Metal Oxide Nanoparticles Market Volume Share (%), by Product 2025 & 2033
- Figure 19: North America Metal Oxide Nanoparticles Market Revenue (Billion), by End-user Industry 2025 & 2033
- Figure 20: North America Metal Oxide Nanoparticles Market Volume (K Tons), by End-user Industry 2025 & 2033
- Figure 21: North America Metal Oxide Nanoparticles Market Revenue Share (%), by End-user Industry 2025 & 2033
- Figure 22: North America Metal Oxide Nanoparticles Market Volume Share (%), by End-user Industry 2025 & 2033
- Figure 23: North America Metal Oxide Nanoparticles Market Revenue (Billion), by Country 2025 & 2033
- Figure 24: North America Metal Oxide Nanoparticles Market Volume (K Tons), by Country 2025 & 2033
- Figure 25: North America Metal Oxide Nanoparticles Market Revenue Share (%), by Country 2025 & 2033
- Figure 26: North America Metal Oxide Nanoparticles Market Volume Share (%), by Country 2025 & 2033
- Figure 27: Europe Metal Oxide Nanoparticles Market Revenue (Billion), by Product 2025 & 2033
- Figure 28: Europe Metal Oxide Nanoparticles Market Volume (K Tons), by Product 2025 & 2033
- Figure 29: Europe Metal Oxide Nanoparticles Market Revenue Share (%), by Product 2025 & 2033
- Figure 30: Europe Metal Oxide Nanoparticles Market Volume Share (%), by Product 2025 & 2033
- Figure 31: Europe Metal Oxide Nanoparticles Market Revenue (Billion), by End-user Industry 2025 & 2033
- Figure 32: Europe Metal Oxide Nanoparticles Market Volume (K Tons), by End-user Industry 2025 & 2033
- Figure 33: Europe Metal Oxide Nanoparticles Market Revenue Share (%), by End-user Industry 2025 & 2033
- Figure 34: Europe Metal Oxide Nanoparticles Market Volume Share (%), by End-user Industry 2025 & 2033
- Figure 35: Europe Metal Oxide Nanoparticles Market Revenue (Billion), by Country 2025 & 2033
- Figure 36: Europe Metal Oxide Nanoparticles Market Volume (K Tons), by Country 2025 & 2033
- Figure 37: Europe Metal Oxide Nanoparticles Market Revenue Share (%), by Country 2025 & 2033
- Figure 38: Europe Metal Oxide Nanoparticles Market Volume Share (%), by Country 2025 & 2033
- Figure 39: Rest of the World Metal Oxide Nanoparticles Market Revenue (Billion), by Product 2025 & 2033
- Figure 40: Rest of the World Metal Oxide Nanoparticles Market Volume (K Tons), by Product 2025 & 2033
- Figure 41: Rest of the World Metal Oxide Nanoparticles Market Revenue Share (%), by Product 2025 & 2033
- Figure 42: Rest of the World Metal Oxide Nanoparticles Market Volume Share (%), by Product 2025 & 2033
- Figure 43: Rest of the World Metal Oxide Nanoparticles Market Revenue (Billion), by End-user Industry 2025 & 2033
- Figure 44: Rest of the World Metal Oxide Nanoparticles Market Volume (K Tons), by End-user Industry 2025 & 2033
- Figure 45: Rest of the World Metal Oxide Nanoparticles Market Revenue Share (%), by End-user Industry 2025 & 2033
- Figure 46: Rest of the World Metal Oxide Nanoparticles Market Volume Share (%), by End-user Industry 2025 & 2033
- Figure 47: Rest of the World Metal Oxide Nanoparticles Market Revenue (Billion), by Country 2025 & 2033
- Figure 48: Rest of the World Metal Oxide Nanoparticles Market Volume (K Tons), by Country 2025 & 2033
- Figure 49: Rest of the World Metal Oxide Nanoparticles Market Revenue Share (%), by Country 2025 & 2033
- Figure 50: Rest of the World Metal Oxide Nanoparticles Market Volume Share (%), by Country 2025 & 2033
List of Tables
- Table 1: Global Metal Oxide Nanoparticles Market Revenue Billion Forecast, by Product 2020 & 2033
- Table 2: Global Metal Oxide Nanoparticles Market Volume K Tons Forecast, by Product 2020 & 2033
- Table 3: Global Metal Oxide Nanoparticles Market Revenue Billion Forecast, by End-user Industry 2020 & 2033
- Table 4: Global Metal Oxide Nanoparticles Market Volume K Tons Forecast, by End-user Industry 2020 & 2033
- Table 5: Global Metal Oxide Nanoparticles Market Revenue Billion Forecast, by Region 2020 & 2033
- Table 6: Global Metal Oxide Nanoparticles Market Volume K Tons Forecast, by Region 2020 & 2033
- Table 7: Global Metal Oxide Nanoparticles Market Revenue Billion Forecast, by Product 2020 & 2033
- Table 8: Global Metal Oxide Nanoparticles Market Volume K Tons Forecast, by Product 2020 & 2033
- Table 9: Global Metal Oxide Nanoparticles Market Revenue Billion Forecast, by End-user Industry 2020 & 2033
- Table 10: Global Metal Oxide Nanoparticles Market Volume K Tons Forecast, by End-user Industry 2020 & 2033
- Table 11: Global Metal Oxide Nanoparticles Market Revenue Billion Forecast, by Country 2020 & 2033
- Table 12: Global Metal Oxide Nanoparticles Market Volume K Tons Forecast, by Country 2020 & 2033
- Table 13: China Metal Oxide Nanoparticles Market Revenue (Billion) Forecast, by Application 2020 & 2033
- Table 14: China Metal Oxide Nanoparticles Market Volume (K Tons) Forecast, by Application 2020 & 2033
- Table 15: India Metal Oxide Nanoparticles Market Revenue (Billion) Forecast, by Application 2020 & 2033
- Table 16: India Metal Oxide Nanoparticles Market Volume (K Tons) Forecast, by Application 2020 & 2033
- Table 17: Japan Metal Oxide Nanoparticles Market Revenue (Billion) Forecast, by Application 2020 & 2033
- Table 18: Japan Metal Oxide Nanoparticles Market Volume (K Tons) Forecast, by Application 2020 & 2033
- Table 19: South Korea Metal Oxide Nanoparticles Market Revenue (Billion) Forecast, by Application 2020 & 2033
- Table 20: South Korea Metal Oxide Nanoparticles Market Volume (K Tons) Forecast, by Application 2020 & 2033
- Table 21: Rest of Asia Pacific Metal Oxide Nanoparticles Market Revenue (Billion) Forecast, by Application 2020 & 2033
- Table 22: Rest of Asia Pacific Metal Oxide Nanoparticles Market Volume (K Tons) Forecast, by Application 2020 & 2033
- Table 23: Global Metal Oxide Nanoparticles Market Revenue Billion Forecast, by Product 2020 & 2033
- Table 24: Global Metal Oxide Nanoparticles Market Volume K Tons Forecast, by Product 2020 & 2033
- Table 25: Global Metal Oxide Nanoparticles Market Revenue Billion Forecast, by End-user Industry 2020 & 2033
- Table 26: Global Metal Oxide Nanoparticles Market Volume K Tons Forecast, by End-user Industry 2020 & 2033
- Table 27: Global Metal Oxide Nanoparticles Market Revenue Billion Forecast, by Country 2020 & 2033
- Table 28: Global Metal Oxide Nanoparticles Market Volume K Tons Forecast, by Country 2020 & 2033
- Table 29: United States Metal Oxide Nanoparticles Market Revenue (Billion) Forecast, by Application 2020 & 2033
- Table 30: United States Metal Oxide Nanoparticles Market Volume (K Tons) Forecast, by Application 2020 & 2033
- Table 31: Canada Metal Oxide Nanoparticles Market Revenue (Billion) Forecast, by Application 2020 & 2033
- Table 32: Canada Metal Oxide Nanoparticles Market Volume (K Tons) Forecast, by Application 2020 & 2033
- Table 33: Mexico Metal Oxide Nanoparticles Market Revenue (Billion) Forecast, by Application 2020 & 2033
- Table 34: Mexico Metal Oxide Nanoparticles Market Volume (K Tons) Forecast, by Application 2020 & 2033
- Table 35: Global Metal Oxide Nanoparticles Market Revenue Billion Forecast, by Product 2020 & 2033
- Table 36: Global Metal Oxide Nanoparticles Market Volume K Tons Forecast, by Product 2020 & 2033
- Table 37: Global Metal Oxide Nanoparticles Market Revenue Billion Forecast, by End-user Industry 2020 & 2033
- Table 38: Global Metal Oxide Nanoparticles Market Volume K Tons Forecast, by End-user Industry 2020 & 2033
- Table 39: Global Metal Oxide Nanoparticles Market Revenue Billion Forecast, by Country 2020 & 2033
- Table 40: Global Metal Oxide Nanoparticles Market Volume K Tons Forecast, by Country 2020 & 2033
- Table 41: Germany Metal Oxide Nanoparticles Market Revenue (Billion) Forecast, by Application 2020 & 2033
- Table 42: Germany Metal Oxide Nanoparticles Market Volume (K Tons) Forecast, by Application 2020 & 2033
- Table 43: United Kingdom Metal Oxide Nanoparticles Market Revenue (Billion) Forecast, by Application 2020 & 2033
- Table 44: United Kingdom Metal Oxide Nanoparticles Market Volume (K Tons) Forecast, by Application 2020 & 2033
- Table 45: France Metal Oxide Nanoparticles Market Revenue (Billion) Forecast, by Application 2020 & 2033
- Table 46: France Metal Oxide Nanoparticles Market Volume (K Tons) Forecast, by Application 2020 & 2033
- Table 47: Italy Metal Oxide Nanoparticles Market Revenue (Billion) Forecast, by Application 2020 & 2033
- Table 48: Italy Metal Oxide Nanoparticles Market Volume (K Tons) Forecast, by Application 2020 & 2033
- Table 49: Rest of Europe Metal Oxide Nanoparticles Market Revenue (Billion) Forecast, by Application 2020 & 2033
- Table 50: Rest of Europe Metal Oxide Nanoparticles Market Volume (K Tons) Forecast, by Application 2020 & 2033
- Table 51: Global Metal Oxide Nanoparticles Market Revenue Billion Forecast, by Product 2020 & 2033
- Table 52: Global Metal Oxide Nanoparticles Market Volume K Tons Forecast, by Product 2020 & 2033
- Table 53: Global Metal Oxide Nanoparticles Market Revenue Billion Forecast, by End-user Industry 2020 & 2033
- Table 54: Global Metal Oxide Nanoparticles Market Volume K Tons Forecast, by End-user Industry 2020 & 2033
- Table 55: Global Metal Oxide Nanoparticles Market Revenue Billion Forecast, by Country 2020 & 2033
- Table 56: Global Metal Oxide Nanoparticles Market Volume K Tons Forecast, by Country 2020 & 2033
- Table 57: South America Metal Oxide Nanoparticles Market Revenue (Billion) Forecast, by Application 2020 & 2033
- Table 58: South America Metal Oxide Nanoparticles Market Volume (K Tons) Forecast, by Application 2020 & 2033
- Table 59: Middle East and Africa Metal Oxide Nanoparticles Market Revenue (Billion) Forecast, by Application 2020 & 2033
- Table 60: Middle East and Africa Metal Oxide Nanoparticles Market Volume (K Tons) Forecast, by Application 2020 & 2033
Frequently Asked Questions
1. What is the projected Compound Annual Growth Rate (CAGR) of the Metal Oxide Nanoparticles Market?
The projected CAGR is approximately 7.28%.
2. Which companies are prominent players in the Metal Oxide Nanoparticles Market?
Key companies in the market include Nanoshell LLC, Merck KGaA, American Elements, MKNano, Nanophase Technologies Corporation, EPRUI Biotech Co Ltd, Xuan Cheng Jing Rui New Material Co Ltd, NanoResearch Elements Inc, Meliorum Technologies Inc, Reinste, SkySpring Nanomaterials Inc.
3. What are the main segments of the Metal Oxide Nanoparticles Market?
The market segments include Product, End-user Industry.
4. Can you provide details about the market size?
The market size is estimated to be USD 1.1 Billion as of 2022.
5. What are some drivers contributing to market growth?
; Growing Electronics Industry; Rising Demand from Pharmaceutical Sector.
6. What are the notable trends driving market growth?
Electronics Sector to Dominate the Market.
7. Are there any restraints impacting market growth?
; Hazardous Nature of Metal Oxide Nanoparticles; Unfavorable Conditions Arising Due to COVID-19 Outbreak.
8. Can you provide examples of recent developments in the market?
N/A
9. What pricing options are available for accessing the report?
Pricing options include single-user, multi-user, and enterprise licenses priced at USD 4750, USD 5250, and USD 8750 respectively.
10. Is the market size provided in terms of value or volume?
The market size is provided in terms of value, measured in Billion and volume, measured in K Tons.
11. Are there any specific market keywords associated with the report?
Yes, the market keyword associated with the report is "Metal Oxide Nanoparticles Market," which aids in identifying and referencing the specific market segment covered.
12. How do I determine which pricing option suits my needs best?
The pricing options vary based on user requirements and access needs. Individual users may opt for single-user licenses, while businesses requiring broader access may choose multi-user or enterprise licenses for cost-effective access to the report.
13. Are there any additional resources or data provided in the Metal Oxide Nanoparticles Market report?
While the report offers comprehensive insights, it's advisable to review the specific contents or supplementary materials provided to ascertain if additional resources or data are available.
14. How can I stay updated on further developments or reports in the Metal Oxide Nanoparticles Market?
To stay informed about further developments, trends, and reports in the Metal Oxide Nanoparticles Market, consider subscribing to industry newsletters, following relevant companies and organizations, or regularly checking reputable industry news sources and publications.
Methodology
Step 1 - Identification of Relevant Samples Size from Population Database


Step 2 - Approaches for Defining Global Market Size (Value, Volume* & Price*)

Note*: In applicable scenarios
Step 3 - Data Sources
Primary Research
- Web Analytics
- Survey Reports
- Research Institute
- Latest Research Reports
- Opinion Leaders
Secondary Research
- Annual Reports
- White Paper
- Latest Press Release
- Industry Association
- Paid Database
- Investor Presentations

Step 4 - Data Triangulation
Involves using different sources of information in order to increase the validity of a study
These sources are likely to be stakeholders in a program - participants, other researchers, program staff, other community members, and so on.
Then we put all data in single framework & apply various statistical tools to find out the dynamic on the market.
During the analysis stage, feedback from the stakeholder groups would be compared to determine areas of agreement as well as areas of divergence