

Key Insights
The metamaterials market is experiencing robust growth, driven by increasing demand across diverse sectors like aerospace, defense, telecommunications, and healthcare. The market's compound annual growth rate (CAGR) exceeding 24% from 2019 to 2024 indicates a significant upward trajectory. This rapid expansion is fueled by several key factors. Advancements in material science and manufacturing techniques are enabling the creation of increasingly sophisticated metamaterials with tailored electromagnetic properties. Furthermore, the rising adoption of 5G and 6G technologies is boosting demand for high-performance antennas and components, a key application area for metamaterials. The automotive industry's growing focus on advanced driver-assistance systems (ADAS) and autonomous driving is also contributing to market growth, as metamaterials offer potential solutions for improved radar and sensing capabilities. However, challenges remain, including the relatively high cost of manufacturing and the need for further research and development to overcome limitations in scalability and mass production. Despite these hurdles, the long-term outlook for the metamaterials market remains exceptionally positive, driven by continuous innovation and expanding applications.
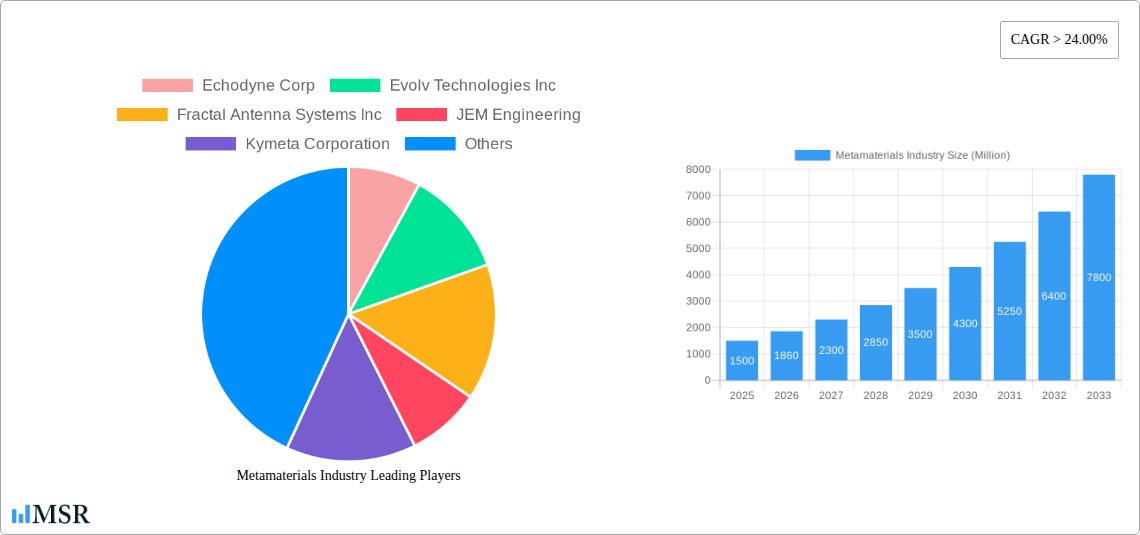
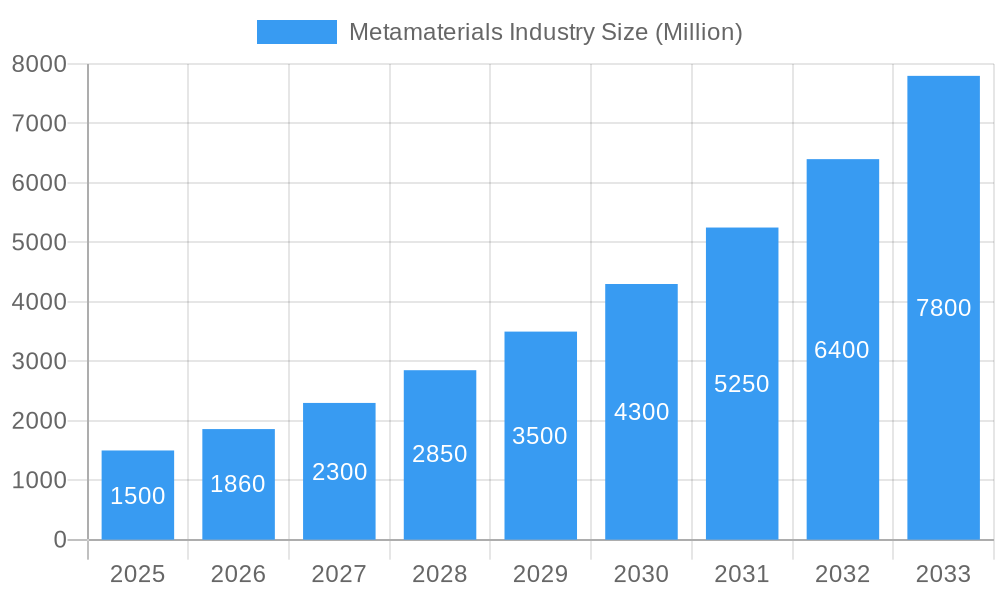
Metamaterials Industry Market Size (In Billion)
The competitive landscape is characterized by a mix of established players and emerging startups. Companies like Echodyne Corp, Kymeta Corporation, and Metamaterials Inc. are at the forefront of innovation, constantly developing new metamaterial technologies and expanding their product portfolios. The market is witnessing increased mergers and acquisitions activity as larger companies seek to acquire smaller firms with specialized expertise. Geographical distribution of the market is expected to be skewed toward North America and Europe initially, due to advanced research infrastructure and technological leadership in these regions. However, Asia-Pacific is anticipated to witness significant growth in the coming years fueled by increasing investments in technological advancements and a strong manufacturing base. The segmentation of the market is expected to evolve as new applications emerge, creating opportunities for niche players specializing in specific sectors. While precise market segmentation data is unavailable, logical estimations based on growth forecasts suggest a gradual shift towards broader applications as technologies mature.
Metamaterials Industry Company Market Share
Metamaterials Industry Market Report: 2019-2033
This comprehensive report provides a detailed analysis of the global metamaterials market, offering actionable insights for stakeholders across the value chain. Covering the period 2019-2033, with a focus on 2025, this report unveils market dynamics, technological advancements, and future growth opportunities within the burgeoning metamaterials sector. The study period spans 2019-2024 (historical), with the base and estimated year being 2025 and the forecast period extending to 2033. Expect detailed analysis of key players, including Echodyne Corp, Evolv Technologies Inc, Fractal Antenna Systems Inc, JEM Engineering, Kymeta Corporation, Metamaterials Inc, Multiwave Technologies AG, Nanohmics Inc, NKT Photonics A/S, TeraView Limited, Metawave Corporation, Aegis Technologies, Metamagnetics, NanoSonic Inc, and Nanoscribe GmbH & Co KG, amongst others. The report values the market in Millions.
Metamaterials Industry Market Concentration & Dynamics
The metamaterials market exhibits a moderately concentrated structure, with several key players vying for market share. Market concentration is influenced by factors including technological advancements, intellectual property rights, and strategic partnerships. The current market share distribution is complex, with xx% held by the top five players. However, the industry is witnessing increasing participation from startups and smaller firms driving innovation.
- Innovation Ecosystems: Collaboration between universities, research institutions, and companies fuels innovation in metamaterial design and applications.
- Regulatory Frameworks: Government regulations related to safety, environmental impact, and specific applications can influence market growth. Variances in regulatory frameworks across different geographies can lead to market complexities.
- Substitute Products: The presence of alternative technologies in specific application areas could pose challenges to metamaterials' market penetration.
- End-User Trends: Growing demand across various sectors, such as defense, telecommunications, and healthcare, is a key growth driver. Specific end-user needs are driving the demand for customized metamaterial solutions.
- M&A Activities: The market has witnessed xx M&A deals in the last five years, highlighting the strategic importance of acquisitions for expanding market reach and technological capabilities. These deals demonstrate a trend towards consolidation and market expansion.
Metamaterials Industry Industry Insights & Trends
The global metamaterials market is experiencing robust growth, driven by technological advancements and increasing demand across diverse sectors. The market size in 2025 is estimated at USD xx Million, exhibiting a Compound Annual Growth Rate (CAGR) of xx% during the forecast period (2025-2033).
Several factors contribute to this growth trajectory: the rising adoption of 5G and 6G technologies, increasing demand for advanced sensing and imaging systems, the growing need for lightweight and high-performance materials, and substantial investments in research and development. Moreover, innovative applications in areas like aerospace, automotive, and biomedical sectors are further expanding the market scope. Technological disruptions, such as the development of novel manufacturing techniques and the integration of AI in metamaterial design, are accelerating the pace of innovation and market expansion. Evolving consumer behaviors, favoring eco-friendly materials and energy-efficient products, provide opportunities for metamaterials to further penetrate relevant markets.
Key Markets & Segments Leading Metamaterials Industry
The North American region currently dominates the metamaterials market, driven by significant investments in R&D, strong government support, and a robust industrial base. Other regions, including Europe and Asia-Pacific, are also showing significant growth potential.
- Drivers in North America:
- Strong government funding for defense and aerospace research.
- Large presence of major players in the metamaterials industry.
- Advanced manufacturing infrastructure and technology.
- Drivers in Europe:
- Growing adoption of metamaterials in telecommunications and automotive sectors.
- Increasing investments in material science research and development.
- Government initiatives promoting sustainable and advanced material technologies.
- Drivers in Asia-Pacific:
- Rapid economic growth and expanding technological infrastructure.
- Growing demand for metamaterials in consumer electronics and healthcare applications.
- Focus on innovation and technological advancements within emerging markets.
The dominance of North America is attributed to the concentration of key players, coupled with robust government funding and substantial investments in research and development initiatives within the defense and aerospace sectors. This region's established technological infrastructure and presence of leading industry players provide a competitive edge.
Metamaterials Industry Product Developments
Recent years have witnessed significant product innovations within the metamaterials sector, including advancements in manufacturing techniques, improved material properties, and the development of novel applications. These advancements have led to more efficient and cost-effective metamaterial devices, with enhanced performance characteristics and a wider range of applications across diverse industries. These developments highlight the competitive edge gained through technological innovation, enabling metamaterials to address crucial challenges in various sectors.
Challenges in the Metamaterials Industry Market
The metamaterials industry faces several challenges impacting its growth trajectory. These include:
- Regulatory Hurdles: Varying regulatory landscapes across different regions pose significant barriers to market entry and expansion. This can involve complexities in compliance and certification processes impacting scalability and cost.
- Supply Chain Issues: The intricate and specialized nature of metamaterial production can lead to supply chain disruptions, affecting production timelines and cost structures. Raw material availability and processing limitations can influence manufacturing efficiency and ultimately, market penetration.
- Competitive Pressures: Intense competition among established players and emerging firms could impact pricing and market share. This necessitates a focus on continuous innovation and strategic positioning to maintain competitiveness.
Forces Driving Metamaterials Industry Growth
Several factors are propelling the growth of the metamaterials industry:
- Technological Advancements: Continuous advancements in nanotechnology and material science enable the development of novel metamaterials with enhanced properties and functionalities. This ongoing research fuels the innovation pipeline and leads to increased application diversity.
- Economic Growth: Growth in key end-user sectors, such as aerospace, telecommunications, and healthcare, drives demand for metamaterials with specific properties and functionalities. This economic growth translates into greater investment in R&D and market expansion.
- Favorable Regulatory Policies: Government support and initiatives promoting the development and adoption of advanced materials can provide impetus for industry growth. Such policies create a supportive ecosystem for research, development, and market implementation.
Long-Term Growth Catalysts in the Metamaterials Industry
Long-term growth is projected to be fueled by:
Continued innovation in material design and manufacturing processes will be crucial for opening new application avenues and improving existing metamaterial functionalities. Strategic partnerships between established companies and research institutions will enable the sharing of expertise and resources, expediting the development of innovative metamaterial solutions. Expansion into new markets, especially in developing economies with growing infrastructure demands, provides substantial opportunities for growth and revenue generation.
Emerging Opportunities in Metamaterials Industry
Emerging opportunities lie in:
- New Applications: Exploration of new applications in areas such as flexible electronics, energy harvesting, and environmental remediation offers significant market potential. Identifying novel applications requires continued R&D and an understanding of evolving market needs.
- Advanced Manufacturing Techniques: Development of more efficient and scalable manufacturing processes will lead to cost reduction and greater market accessibility. Improving manufacturing capabilities is crucial for meeting the growing demand and establishing market leadership.
- Integration with Other Technologies: The integration of metamaterials with other advanced technologies, such as artificial intelligence and IoT, can lead to the creation of innovative products and services across diverse sectors. This interdisciplinary approach facilitates the development of complex and high-value products.
Leading Players in the Metamaterials Industry Sector
- Echodyne Corp
- Evolv Technologies Inc
- Fractal Antenna Systems Inc
- JEM Engineering
- Kymeta Corporation
- Metamaterials Inc
- Multiwave Technologies AG
- Nanohmics Inc
- NKT Photonics A/S
- TeraView Limited
- Metawave Corporation
- Aegis Technologies
- Metamagnetics
- NanoSonic Inc
- Nanoscribe GmbH & Co KG
- List Not Exhaustive
Key Milestones in Metamaterials Industry Industry
- November 2022: Meta Materials Inc. announced the launch of its new headquarters and Centre of Excellence in Dartmouth, Nova Scotia, significantly expanding its manufacturing and research capabilities. This marks a significant milestone in terms of capacity and innovation in the Canadian metamaterials market.
- June 2022: Echodyne Corp. announced plans to test metamaterials-based radars for defense, security, and autonomy applications, following a USD 135 Million fundraising round. This demonstrates growing investor confidence and significant expansion potential within the defense and security sectors.
Strategic Outlook for Metamaterials Industry Market
The metamaterials market holds immense long-term growth potential, driven by ongoing technological advancements and increasing demand from diverse sectors. Strategic partnerships, investments in R&D, and expansion into new applications will be crucial for capitalizing on this potential. The focus should be on developing cost-effective and scalable manufacturing processes while exploring new market opportunities. This will contribute to establishing a strong market presence and securing a competitive edge.
Metamaterials Industry Segmentation
-
1. Type
- 1.1. Electromagnetic
- 1.2. Terahertz
- 1.3. Tunable
- 1.4. Photonic
- 1.5. FSS
- 1.6. Other Types (Chiral, Nonlinear, etc.)
-
2. Application
- 2.1. Antenna and Radar
- 2.2. Sensors
- 2.3. Cloaking Devices
- 2.4. Superlens
- 2.5. Light and Sound Filtering
- 2.6. Other Applications (Solar, Absorbers, etc.)
-
3. End-user Industry
- 3.1. Healthcare
- 3.2. Telecommunication
- 3.3. Aerospace and Defense
- 3.4. Electronics
- 3.5. Other End-use Industries (including Optics)
Metamaterials Industry Segmentation By Geography
-
1. Asia Pacific
- 1.1. China
- 1.2. India
- 1.3. Japan
- 1.4. South Korea
- 1.5. Rest of Asia Pacific
-
2. North America
- 2.1. United States
- 2.2. Canada
- 2.3. Mexico
- 2.4. Rest of North America
-
3. Europe
- 3.1. Germany
- 3.2. United Kingdom
- 3.3. Italy
- 3.4. France
- 3.5. Spain
- 3.6. Rest of Europe
-
4. South America
- 4.1. Brazil
- 4.2. Argentina
- 4.3. Rest of South America
-
5. Middle East and Africa
- 5.1. Saudi Arabia
- 5.2. South Africa
- 5.3. Rest of Middle East and Africa
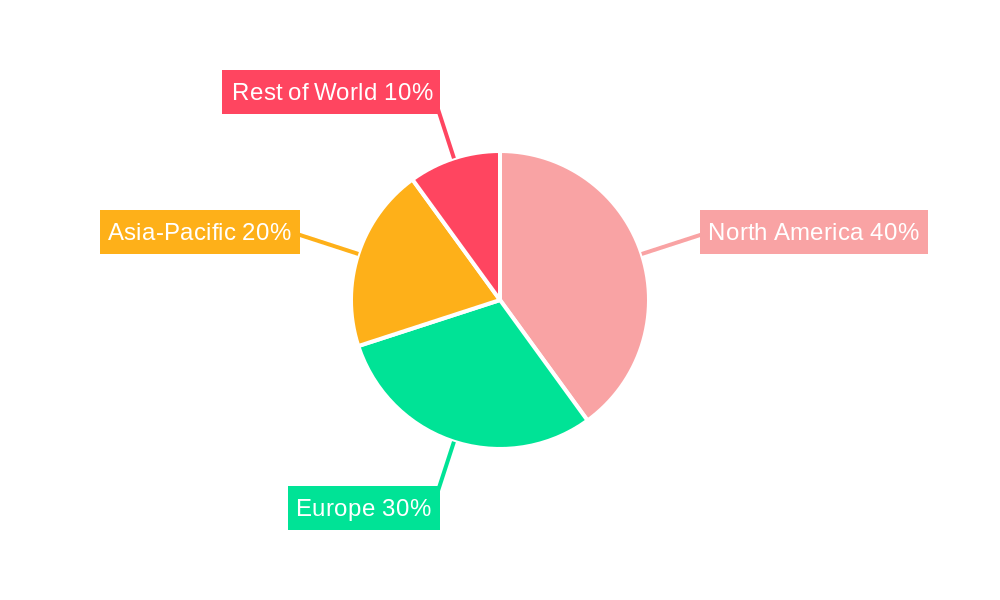
Metamaterials Industry Regional Market Share
Geographic Coverage of Metamaterials Industry
Metamaterials Industry REPORT HIGHLIGHTS
| Aspects | Details |
|---|---|
| Study Period | 2020-2034 |
| Base Year | 2025 |
| Estimated Year | 2026 |
| Forecast Period | 2026-2034 |
| Historical Period | 2020-2025 |
| Growth Rate | CAGR of 27.65% from 2020-2034 |
| Segmentation |
|
Table of Contents
- 1. Introduction
- 1.1. Research Scope
- 1.2. Market Segmentation
- 1.3. Research Methodology
- 1.4. Definitions and Assumptions
- 2. Executive Summary
- 2.1. Introduction
- 3. Market Dynamics
- 3.1. Introduction
- 3.2. Market Drivers
- 3.2.1. Increasing R&D Investments for Various Applications; Other Drivers
- 3.3. Market Restrains
- 3.3.1. Increasing R&D Investments for Various Applications; Other Drivers
- 3.4. Market Trends
- 3.4.1. Aerospace and Defense Industry to Dominate the Market
- 4. Market Factor Analysis
- 4.1. Porters Five Forces
- 4.2. Supply/Value Chain
- 4.3. PESTEL analysis
- 4.4. Market Entropy
- 4.5. Patent/Trademark Analysis
- 5. Global Metamaterials Industry Analysis, Insights and Forecast, 2020-2032
- 5.1. Market Analysis, Insights and Forecast - by Type
- 5.1.1. Electromagnetic
- 5.1.2. Terahertz
- 5.1.3. Tunable
- 5.1.4. Photonic
- 5.1.5. FSS
- 5.1.6. Other Types (Chiral, Nonlinear, etc.)
- 5.2. Market Analysis, Insights and Forecast - by Application
- 5.2.1. Antenna and Radar
- 5.2.2. Sensors
- 5.2.3. Cloaking Devices
- 5.2.4. Superlens
- 5.2.5. Light and Sound Filtering
- 5.2.6. Other Applications (Solar, Absorbers, etc.)
- 5.3. Market Analysis, Insights and Forecast - by End-user Industry
- 5.3.1. Healthcare
- 5.3.2. Telecommunication
- 5.3.3. Aerospace and Defense
- 5.3.4. Electronics
- 5.3.5. Other End-use Industries (including Optics)
- 5.4. Market Analysis, Insights and Forecast - by Region
- 5.4.1. Asia Pacific
- 5.4.2. North America
- 5.4.3. Europe
- 5.4.4. South America
- 5.4.5. Middle East and Africa
- 5.1. Market Analysis, Insights and Forecast - by Type
- 6. Asia Pacific Metamaterials Industry Analysis, Insights and Forecast, 2020-2032
- 6.1. Market Analysis, Insights and Forecast - by Type
- 6.1.1. Electromagnetic
- 6.1.2. Terahertz
- 6.1.3. Tunable
- 6.1.4. Photonic
- 6.1.5. FSS
- 6.1.6. Other Types (Chiral, Nonlinear, etc.)
- 6.2. Market Analysis, Insights and Forecast - by Application
- 6.2.1. Antenna and Radar
- 6.2.2. Sensors
- 6.2.3. Cloaking Devices
- 6.2.4. Superlens
- 6.2.5. Light and Sound Filtering
- 6.2.6. Other Applications (Solar, Absorbers, etc.)
- 6.3. Market Analysis, Insights and Forecast - by End-user Industry
- 6.3.1. Healthcare
- 6.3.2. Telecommunication
- 6.3.3. Aerospace and Defense
- 6.3.4. Electronics
- 6.3.5. Other End-use Industries (including Optics)
- 6.1. Market Analysis, Insights and Forecast - by Type
- 7. North America Metamaterials Industry Analysis, Insights and Forecast, 2020-2032
- 7.1. Market Analysis, Insights and Forecast - by Type
- 7.1.1. Electromagnetic
- 7.1.2. Terahertz
- 7.1.3. Tunable
- 7.1.4. Photonic
- 7.1.5. FSS
- 7.1.6. Other Types (Chiral, Nonlinear, etc.)
- 7.2. Market Analysis, Insights and Forecast - by Application
- 7.2.1. Antenna and Radar
- 7.2.2. Sensors
- 7.2.3. Cloaking Devices
- 7.2.4. Superlens
- 7.2.5. Light and Sound Filtering
- 7.2.6. Other Applications (Solar, Absorbers, etc.)
- 7.3. Market Analysis, Insights and Forecast - by End-user Industry
- 7.3.1. Healthcare
- 7.3.2. Telecommunication
- 7.3.3. Aerospace and Defense
- 7.3.4. Electronics
- 7.3.5. Other End-use Industries (including Optics)
- 7.1. Market Analysis, Insights and Forecast - by Type
- 8. Europe Metamaterials Industry Analysis, Insights and Forecast, 2020-2032
- 8.1. Market Analysis, Insights and Forecast - by Type
- 8.1.1. Electromagnetic
- 8.1.2. Terahertz
- 8.1.3. Tunable
- 8.1.4. Photonic
- 8.1.5. FSS
- 8.1.6. Other Types (Chiral, Nonlinear, etc.)
- 8.2. Market Analysis, Insights and Forecast - by Application
- 8.2.1. Antenna and Radar
- 8.2.2. Sensors
- 8.2.3. Cloaking Devices
- 8.2.4. Superlens
- 8.2.5. Light and Sound Filtering
- 8.2.6. Other Applications (Solar, Absorbers, etc.)
- 8.3. Market Analysis, Insights and Forecast - by End-user Industry
- 8.3.1. Healthcare
- 8.3.2. Telecommunication
- 8.3.3. Aerospace and Defense
- 8.3.4. Electronics
- 8.3.5. Other End-use Industries (including Optics)
- 8.1. Market Analysis, Insights and Forecast - by Type
- 9. South America Metamaterials Industry Analysis, Insights and Forecast, 2020-2032
- 9.1. Market Analysis, Insights and Forecast - by Type
- 9.1.1. Electromagnetic
- 9.1.2. Terahertz
- 9.1.3. Tunable
- 9.1.4. Photonic
- 9.1.5. FSS
- 9.1.6. Other Types (Chiral, Nonlinear, etc.)
- 9.2. Market Analysis, Insights and Forecast - by Application
- 9.2.1. Antenna and Radar
- 9.2.2. Sensors
- 9.2.3. Cloaking Devices
- 9.2.4. Superlens
- 9.2.5. Light and Sound Filtering
- 9.2.6. Other Applications (Solar, Absorbers, etc.)
- 9.3. Market Analysis, Insights and Forecast - by End-user Industry
- 9.3.1. Healthcare
- 9.3.2. Telecommunication
- 9.3.3. Aerospace and Defense
- 9.3.4. Electronics
- 9.3.5. Other End-use Industries (including Optics)
- 9.1. Market Analysis, Insights and Forecast - by Type
- 10. Middle East and Africa Metamaterials Industry Analysis, Insights and Forecast, 2020-2032
- 10.1. Market Analysis, Insights and Forecast - by Type
- 10.1.1. Electromagnetic
- 10.1.2. Terahertz
- 10.1.3. Tunable
- 10.1.4. Photonic
- 10.1.5. FSS
- 10.1.6. Other Types (Chiral, Nonlinear, etc.)
- 10.2. Market Analysis, Insights and Forecast - by Application
- 10.2.1. Antenna and Radar
- 10.2.2. Sensors
- 10.2.3. Cloaking Devices
- 10.2.4. Superlens
- 10.2.5. Light and Sound Filtering
- 10.2.6. Other Applications (Solar, Absorbers, etc.)
- 10.3. Market Analysis, Insights and Forecast - by End-user Industry
- 10.3.1. Healthcare
- 10.3.2. Telecommunication
- 10.3.3. Aerospace and Defense
- 10.3.4. Electronics
- 10.3.5. Other End-use Industries (including Optics)
- 10.1. Market Analysis, Insights and Forecast - by Type
- 11. Competitive Analysis
- 11.1. Global Market Share Analysis 2025
- 11.2. Company Profiles
- 11.2.1 Echodyne Corp
- 11.2.1.1. Overview
- 11.2.1.2. Products
- 11.2.1.3. SWOT Analysis
- 11.2.1.4. Recent Developments
- 11.2.1.5. Financials (Based on Availability)
- 11.2.2 Evolv Technologies Inc
- 11.2.2.1. Overview
- 11.2.2.2. Products
- 11.2.2.3. SWOT Analysis
- 11.2.2.4. Recent Developments
- 11.2.2.5. Financials (Based on Availability)
- 11.2.3 Fractal Antenna Systems Inc
- 11.2.3.1. Overview
- 11.2.3.2. Products
- 11.2.3.3. SWOT Analysis
- 11.2.3.4. Recent Developments
- 11.2.3.5. Financials (Based on Availability)
- 11.2.4 JEM Engineering
- 11.2.4.1. Overview
- 11.2.4.2. Products
- 11.2.4.3. SWOT Analysis
- 11.2.4.4. Recent Developments
- 11.2.4.5. Financials (Based on Availability)
- 11.2.5 Kymeta Corporation
- 11.2.5.1. Overview
- 11.2.5.2. Products
- 11.2.5.3. SWOT Analysis
- 11.2.5.4. Recent Developments
- 11.2.5.5. Financials (Based on Availability)
- 11.2.6 Metamaterials Inc
- 11.2.6.1. Overview
- 11.2.6.2. Products
- 11.2.6.3. SWOT Analysis
- 11.2.6.4. Recent Developments
- 11.2.6.5. Financials (Based on Availability)
- 11.2.7 Multiwave Technologies AG
- 11.2.7.1. Overview
- 11.2.7.2. Products
- 11.2.7.3. SWOT Analysis
- 11.2.7.4. Recent Developments
- 11.2.7.5. Financials (Based on Availability)
- 11.2.8 Nanohmics Inc
- 11.2.8.1. Overview
- 11.2.8.2. Products
- 11.2.8.3. SWOT Analysis
- 11.2.8.4. Recent Developments
- 11.2.8.5. Financials (Based on Availability)
- 11.2.9 NKT Photonics A/S
- 11.2.9.1. Overview
- 11.2.9.2. Products
- 11.2.9.3. SWOT Analysis
- 11.2.9.4. Recent Developments
- 11.2.9.5. Financials (Based on Availability)
- 11.2.10 TeraView Limited
- 11.2.10.1. Overview
- 11.2.10.2. Products
- 11.2.10.3. SWOT Analysis
- 11.2.10.4. Recent Developments
- 11.2.10.5. Financials (Based on Availability)
- 11.2.11 Metawave Corporation
- 11.2.11.1. Overview
- 11.2.11.2. Products
- 11.2.11.3. SWOT Analysis
- 11.2.11.4. Recent Developments
- 11.2.11.5. Financials (Based on Availability)
- 11.2.12 Aegis Technologies
- 11.2.12.1. Overview
- 11.2.12.2. Products
- 11.2.12.3. SWOT Analysis
- 11.2.12.4. Recent Developments
- 11.2.12.5. Financials (Based on Availability)
- 11.2.13 Metamagnetics
- 11.2.13.1. Overview
- 11.2.13.2. Products
- 11.2.13.3. SWOT Analysis
- 11.2.13.4. Recent Developments
- 11.2.13.5. Financials (Based on Availability)
- 11.2.14 NanoSonic Inc
- 11.2.14.1. Overview
- 11.2.14.2. Products
- 11.2.14.3. SWOT Analysis
- 11.2.14.4. Recent Developments
- 11.2.14.5. Financials (Based on Availability)
- 11.2.15 Nanoscribe GmbH & Co KG*List Not Exhaustive
- 11.2.15.1. Overview
- 11.2.15.2. Products
- 11.2.15.3. SWOT Analysis
- 11.2.15.4. Recent Developments
- 11.2.15.5. Financials (Based on Availability)
- 11.2.1 Echodyne Corp
List of Figures
- Figure 1: Global Metamaterials Industry Revenue Breakdown (undefined, %) by Region 2025 & 2033
- Figure 2: Asia Pacific Metamaterials Industry Revenue (undefined), by Type 2025 & 2033
- Figure 3: Asia Pacific Metamaterials Industry Revenue Share (%), by Type 2025 & 2033
- Figure 4: Asia Pacific Metamaterials Industry Revenue (undefined), by Application 2025 & 2033
- Figure 5: Asia Pacific Metamaterials Industry Revenue Share (%), by Application 2025 & 2033
- Figure 6: Asia Pacific Metamaterials Industry Revenue (undefined), by End-user Industry 2025 & 2033
- Figure 7: Asia Pacific Metamaterials Industry Revenue Share (%), by End-user Industry 2025 & 2033
- Figure 8: Asia Pacific Metamaterials Industry Revenue (undefined), by Country 2025 & 2033
- Figure 9: Asia Pacific Metamaterials Industry Revenue Share (%), by Country 2025 & 2033
- Figure 10: North America Metamaterials Industry Revenue (undefined), by Type 2025 & 2033
- Figure 11: North America Metamaterials Industry Revenue Share (%), by Type 2025 & 2033
- Figure 12: North America Metamaterials Industry Revenue (undefined), by Application 2025 & 2033
- Figure 13: North America Metamaterials Industry Revenue Share (%), by Application 2025 & 2033
- Figure 14: North America Metamaterials Industry Revenue (undefined), by End-user Industry 2025 & 2033
- Figure 15: North America Metamaterials Industry Revenue Share (%), by End-user Industry 2025 & 2033
- Figure 16: North America Metamaterials Industry Revenue (undefined), by Country 2025 & 2033
- Figure 17: North America Metamaterials Industry Revenue Share (%), by Country 2025 & 2033
- Figure 18: Europe Metamaterials Industry Revenue (undefined), by Type 2025 & 2033
- Figure 19: Europe Metamaterials Industry Revenue Share (%), by Type 2025 & 2033
- Figure 20: Europe Metamaterials Industry Revenue (undefined), by Application 2025 & 2033
- Figure 21: Europe Metamaterials Industry Revenue Share (%), by Application 2025 & 2033
- Figure 22: Europe Metamaterials Industry Revenue (undefined), by End-user Industry 2025 & 2033
- Figure 23: Europe Metamaterials Industry Revenue Share (%), by End-user Industry 2025 & 2033
- Figure 24: Europe Metamaterials Industry Revenue (undefined), by Country 2025 & 2033
- Figure 25: Europe Metamaterials Industry Revenue Share (%), by Country 2025 & 2033
- Figure 26: South America Metamaterials Industry Revenue (undefined), by Type 2025 & 2033
- Figure 27: South America Metamaterials Industry Revenue Share (%), by Type 2025 & 2033
- Figure 28: South America Metamaterials Industry Revenue (undefined), by Application 2025 & 2033
- Figure 29: South America Metamaterials Industry Revenue Share (%), by Application 2025 & 2033
- Figure 30: South America Metamaterials Industry Revenue (undefined), by End-user Industry 2025 & 2033
- Figure 31: South America Metamaterials Industry Revenue Share (%), by End-user Industry 2025 & 2033
- Figure 32: South America Metamaterials Industry Revenue (undefined), by Country 2025 & 2033
- Figure 33: South America Metamaterials Industry Revenue Share (%), by Country 2025 & 2033
- Figure 34: Middle East and Africa Metamaterials Industry Revenue (undefined), by Type 2025 & 2033
- Figure 35: Middle East and Africa Metamaterials Industry Revenue Share (%), by Type 2025 & 2033
- Figure 36: Middle East and Africa Metamaterials Industry Revenue (undefined), by Application 2025 & 2033
- Figure 37: Middle East and Africa Metamaterials Industry Revenue Share (%), by Application 2025 & 2033
- Figure 38: Middle East and Africa Metamaterials Industry Revenue (undefined), by End-user Industry 2025 & 2033
- Figure 39: Middle East and Africa Metamaterials Industry Revenue Share (%), by End-user Industry 2025 & 2033
- Figure 40: Middle East and Africa Metamaterials Industry Revenue (undefined), by Country 2025 & 2033
- Figure 41: Middle East and Africa Metamaterials Industry Revenue Share (%), by Country 2025 & 2033
List of Tables
- Table 1: Global Metamaterials Industry Revenue undefined Forecast, by Type 2020 & 2033
- Table 2: Global Metamaterials Industry Revenue undefined Forecast, by Application 2020 & 2033
- Table 3: Global Metamaterials Industry Revenue undefined Forecast, by End-user Industry 2020 & 2033
- Table 4: Global Metamaterials Industry Revenue undefined Forecast, by Region 2020 & 2033
- Table 5: Global Metamaterials Industry Revenue undefined Forecast, by Type 2020 & 2033
- Table 6: Global Metamaterials Industry Revenue undefined Forecast, by Application 2020 & 2033
- Table 7: Global Metamaterials Industry Revenue undefined Forecast, by End-user Industry 2020 & 2033
- Table 8: Global Metamaterials Industry Revenue undefined Forecast, by Country 2020 & 2033
- Table 9: China Metamaterials Industry Revenue (undefined) Forecast, by Application 2020 & 2033
- Table 10: India Metamaterials Industry Revenue (undefined) Forecast, by Application 2020 & 2033
- Table 11: Japan Metamaterials Industry Revenue (undefined) Forecast, by Application 2020 & 2033
- Table 12: South Korea Metamaterials Industry Revenue (undefined) Forecast, by Application 2020 & 2033
- Table 13: Rest of Asia Pacific Metamaterials Industry Revenue (undefined) Forecast, by Application 2020 & 2033
- Table 14: Global Metamaterials Industry Revenue undefined Forecast, by Type 2020 & 2033
- Table 15: Global Metamaterials Industry Revenue undefined Forecast, by Application 2020 & 2033
- Table 16: Global Metamaterials Industry Revenue undefined Forecast, by End-user Industry 2020 & 2033
- Table 17: Global Metamaterials Industry Revenue undefined Forecast, by Country 2020 & 2033
- Table 18: United States Metamaterials Industry Revenue (undefined) Forecast, by Application 2020 & 2033
- Table 19: Canada Metamaterials Industry Revenue (undefined) Forecast, by Application 2020 & 2033
- Table 20: Mexico Metamaterials Industry Revenue (undefined) Forecast, by Application 2020 & 2033
- Table 21: Rest of North America Metamaterials Industry Revenue (undefined) Forecast, by Application 2020 & 2033
- Table 22: Global Metamaterials Industry Revenue undefined Forecast, by Type 2020 & 2033
- Table 23: Global Metamaterials Industry Revenue undefined Forecast, by Application 2020 & 2033
- Table 24: Global Metamaterials Industry Revenue undefined Forecast, by End-user Industry 2020 & 2033
- Table 25: Global Metamaterials Industry Revenue undefined Forecast, by Country 2020 & 2033
- Table 26: Germany Metamaterials Industry Revenue (undefined) Forecast, by Application 2020 & 2033
- Table 27: United Kingdom Metamaterials Industry Revenue (undefined) Forecast, by Application 2020 & 2033
- Table 28: Italy Metamaterials Industry Revenue (undefined) Forecast, by Application 2020 & 2033
- Table 29: France Metamaterials Industry Revenue (undefined) Forecast, by Application 2020 & 2033
- Table 30: Spain Metamaterials Industry Revenue (undefined) Forecast, by Application 2020 & 2033
- Table 31: Rest of Europe Metamaterials Industry Revenue (undefined) Forecast, by Application 2020 & 2033
- Table 32: Global Metamaterials Industry Revenue undefined Forecast, by Type 2020 & 2033
- Table 33: Global Metamaterials Industry Revenue undefined Forecast, by Application 2020 & 2033
- Table 34: Global Metamaterials Industry Revenue undefined Forecast, by End-user Industry 2020 & 2033
- Table 35: Global Metamaterials Industry Revenue undefined Forecast, by Country 2020 & 2033
- Table 36: Brazil Metamaterials Industry Revenue (undefined) Forecast, by Application 2020 & 2033
- Table 37: Argentina Metamaterials Industry Revenue (undefined) Forecast, by Application 2020 & 2033
- Table 38: Rest of South America Metamaterials Industry Revenue (undefined) Forecast, by Application 2020 & 2033
- Table 39: Global Metamaterials Industry Revenue undefined Forecast, by Type 2020 & 2033
- Table 40: Global Metamaterials Industry Revenue undefined Forecast, by Application 2020 & 2033
- Table 41: Global Metamaterials Industry Revenue undefined Forecast, by End-user Industry 2020 & 2033
- Table 42: Global Metamaterials Industry Revenue undefined Forecast, by Country 2020 & 2033
- Table 43: Saudi Arabia Metamaterials Industry Revenue (undefined) Forecast, by Application 2020 & 2033
- Table 44: South Africa Metamaterials Industry Revenue (undefined) Forecast, by Application 2020 & 2033
- Table 45: Rest of Middle East and Africa Metamaterials Industry Revenue (undefined) Forecast, by Application 2020 & 2033
Frequently Asked Questions
1. What is the projected Compound Annual Growth Rate (CAGR) of the Metamaterials Industry?
The projected CAGR is approximately 27.65%.
2. Which companies are prominent players in the Metamaterials Industry?
Key companies in the market include Echodyne Corp, Evolv Technologies Inc, Fractal Antenna Systems Inc, JEM Engineering, Kymeta Corporation, Metamaterials Inc, Multiwave Technologies AG, Nanohmics Inc, NKT Photonics A/S, TeraView Limited, Metawave Corporation, Aegis Technologies, Metamagnetics, NanoSonic Inc, Nanoscribe GmbH & Co KG*List Not Exhaustive.
3. What are the main segments of the Metamaterials Industry?
The market segments include Type, Application, End-user Industry.
4. Can you provide details about the market size?
The market size is estimated to be USD XXX N/A as of 2022.
5. What are some drivers contributing to market growth?
Increasing R&D Investments for Various Applications; Other Drivers.
6. What are the notable trends driving market growth?
Aerospace and Defense Industry to Dominate the Market.
7. Are there any restraints impacting market growth?
Increasing R&D Investments for Various Applications; Other Drivers.
8. Can you provide examples of recent developments in the market?
November 2022: Meta Materials Inc. announced the launch of its new headquarters and Centre of Excellence in Dartmouth, Nova Scotia. The 68,000-square-foot state-of-the-art facility is the only facility in Canada to combine advanced packaging for semiconductors, unique materials, chemistry research, and the design and manufacturing of holographic and other optical products.
9. What pricing options are available for accessing the report?
Pricing options include single-user, multi-user, and enterprise licenses priced at USD 4750, USD 5250, and USD 8750 respectively.
10. Is the market size provided in terms of value or volume?
The market size is provided in terms of value, measured in N/A.
11. Are there any specific market keywords associated with the report?
Yes, the market keyword associated with the report is "Metamaterials Industry," which aids in identifying and referencing the specific market segment covered.
12. How do I determine which pricing option suits my needs best?
The pricing options vary based on user requirements and access needs. Individual users may opt for single-user licenses, while businesses requiring broader access may choose multi-user or enterprise licenses for cost-effective access to the report.
13. Are there any additional resources or data provided in the Metamaterials Industry report?
While the report offers comprehensive insights, it's advisable to review the specific contents or supplementary materials provided to ascertain if additional resources or data are available.
14. How can I stay updated on further developments or reports in the Metamaterials Industry?
To stay informed about further developments, trends, and reports in the Metamaterials Industry, consider subscribing to industry newsletters, following relevant companies and organizations, or regularly checking reputable industry news sources and publications.
Methodology
Step 1 - Identification of Relevant Samples Size from Population Database


Step 2 - Approaches for Defining Global Market Size (Value, Volume* & Price*)

Note*: In applicable scenarios
Step 3 - Data Sources
Primary Research
- Web Analytics
- Survey Reports
- Research Institute
- Latest Research Reports
- Opinion Leaders
Secondary Research
- Annual Reports
- White Paper
- Latest Press Release
- Industry Association
- Paid Database
- Investor Presentations

Step 4 - Data Triangulation
Involves using different sources of information in order to increase the validity of a study
These sources are likely to be stakeholders in a program - participants, other researchers, program staff, other community members, and so on.
Then we put all data in single framework & apply various statistical tools to find out the dynamic on the market.
During the analysis stage, feedback from the stakeholder groups would be compared to determine areas of agreement as well as areas of divergence