

Key Insights
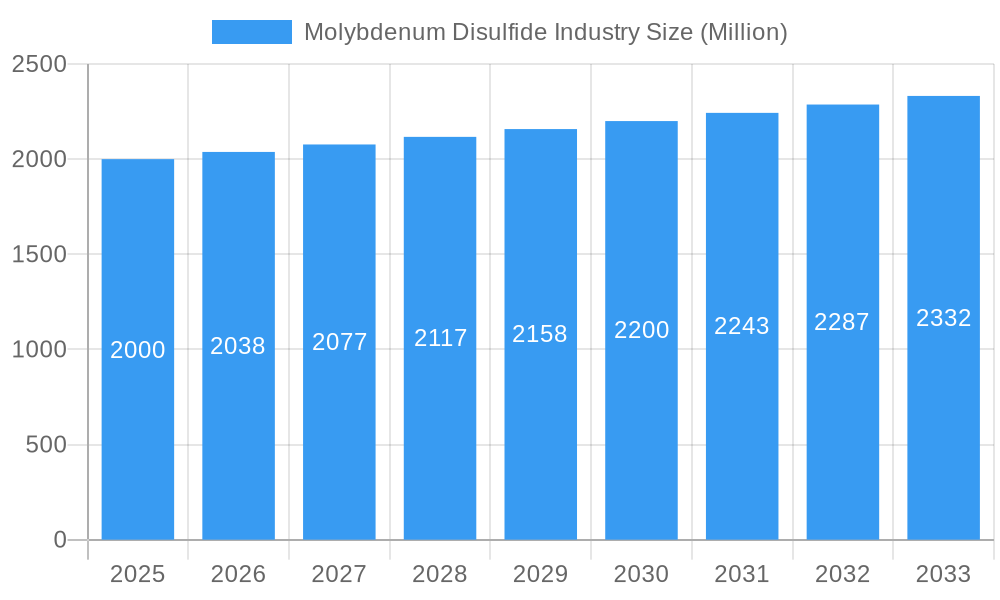
The Molybdenum Disulfide (MoS2) market, valued at 0.9 billion in 2025, is projected for robust expansion at a compound annual growth rate (CAGR) of 4.7% between 2025 and 2033. This growth is primarily driven by increasing demand across key industries including automotive, aerospace, and electronics. The automotive sector's focus on lightweight, high-performance materials for lubricants and coatings significantly contributes to this trend. Similarly, the electronics industry's growing need for advanced semiconductors and catalysts is propelling MoS2 adoption. The construction and chemical/petrochemical sectors also present substantial opportunities, leveraging MoS2's unique properties for enhanced performance and durability. Despite challenges like molybdenum price volatility and competition from alternative materials, the market outlook remains positive due to ongoing research and development in emerging technologies such as energy storage and flexible electronics. MoS2 powder is expected to maintain market dominance owing to its cost-effectiveness and application versatility. Geographically, the Asia-Pacific region, led by China and India, is anticipated to spearhead market growth, supported by rapid industrialization and infrastructure investments. North America and Europe will also experience considerable growth, driven by technological advancements and stringent environmental regulations favoring sustainable materials.
Molybdenum Disulfide Industry Market Size (In Million)
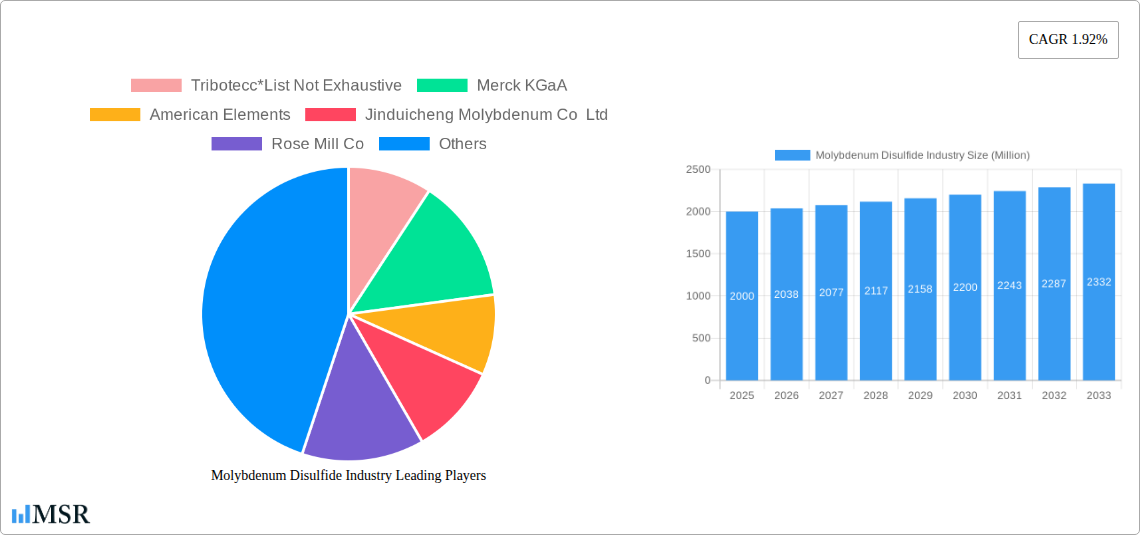
The competitive environment features a blend of established manufacturers and emerging enterprises. Leading players such as Merck KGaA, American Elements, and Jinduicheng Molybdenum Co Ltd command significant market share through extensive production capacities and established distribution channels. The market also welcomes smaller companies focusing on specialized applications, fostering innovation and competition. Future growth will be shaped by technological advancements in high-quality MoS2 synthesis with tailored properties and the development of cost-effective, sustainable production methods. Government policies promoting environmentally friendly materials and supporting technological innovation are expected to further stimulate market expansion throughout the forecast period. The continued exploration of MoS2's potential in novel applications, including biomedicine and water purification, presents exciting avenues for future market development.
Molybdenum Disulfide Industry Company Market Share
Deep Dive into the Molybdenum Disulfide (MoS2) Industry: A Comprehensive Market Report (2019-2033)
This comprehensive report provides an in-depth analysis of the global molybdenum disulfide (MoS2) industry, covering the period from 2019 to 2033. It offers invaluable insights into market dynamics, key players, emerging trends, and future growth prospects, making it an essential resource for industry stakeholders, investors, and researchers. The report meticulously examines market concentration, technological advancements, and competitive landscapes, offering actionable intelligence to navigate the evolving MoS2 market. With a focus on key segments like lubricants and coatings, semiconductors, and catalysts, this report paints a detailed picture of the industry's current state and future trajectory. The global market size is projected to reach xx Million by 2033, exhibiting a CAGR of xx% during the forecast period (2025-2033).
Molybdenum Disulfide Industry Market Concentration & Dynamics
The global molybdenum disulfide market exhibits a moderately concentrated structure, with a few major players holding significant market share. The market share distribution amongst the top five companies is estimated at approximately xx%. However, the presence of numerous smaller players, particularly in niche applications, contributes to a dynamic competitive landscape. Innovation plays a crucial role, with companies investing in research and development to improve product quality, expand applications, and enhance manufacturing processes.
Key Players: Tribotecc, Merck KGaA, American Elements, Jinduicheng Molybdenum Co Ltd, Rose Mill Co, Advanced Engineering Materials Limited, Songxian Exploiter Molybdenum Co, Freeport-McMoRan, Moly metal LLP, Luoyang Shenyu Molybdenum Co Ltd, Grupo Mexico. (List not exhaustive)
M&A Activity: The industry has witnessed xx M&A deals in the past five years, primarily driven by strategic acquisitions aimed at expanding product portfolios and market reach.
Regulatory Landscape: Regulations concerning environmental impact and material safety influence the production and application of MoS2, impacting market growth and necessitating compliance.
Substitute Products: While MoS2 possesses unique properties, competitive pressures exist from alternative materials in specific applications, such as graphite and other advanced lubricants.
End-User Trends: Growing demand from automotive, aerospace, and electronics sectors are key drivers of MoS2 market growth. The shift towards electric vehicles and advanced electronics is creating new opportunities for MoS2-based components.
Molybdenum Disulfide Industry Insights & Trends
The global molybdenum disulfide market is witnessing significant growth, fueled by the increasing adoption of MoS2 in various applications. The market size in 2025 is estimated at xx Million, growing to xx Million by 2033. Several factors contribute to this expansion. Technological advancements, including the development of novel MoS2-based materials with enhanced performance characteristics, are driving market expansion. The rising demand for high-performance lubricants in automotive and industrial applications, coupled with the growing use of MoS2 in electronic components, further bolsters market growth. Evolving consumer preferences, including increased focus on sustainability and energy efficiency, influence the development of eco-friendly MoS2-based products. The increasing use of MoS2 in various industries, from construction to chemical processing, is also a significant driver. This continuous development and adoption across multiple sectors indicate a robust and promising future for the MoS2 industry.
Key Markets & Segments Leading Molybdenum Disulfide Industry
The dominant region for MoS2 consumption is currently Asia-Pacific, driven by robust economic growth, rising industrialization, and significant investments in infrastructure development. Within specific segments:
Application: The lubricants and coatings segment holds the largest market share due to MoS2's excellent lubricating properties and its use in protective coatings. The semiconductor industry shows strong growth potential, with MoS2 being explored for applications in transistors and other electronic components.
End-User Industry: The automotive and aerospace industries are key consumers of MoS2, primarily driven by increasing demands for high-performance materials. The electrical and electronics sector represents a rapidly expanding market segment, with growing applications in batteries and electronics.
Type: Molybdenum Disulfide (MoS2) powder dominates the market due to its ease of use and cost-effectiveness, while MoS2 crystals are used in specialized applications requiring higher purity and performance.
Drivers for Key Segments:
- Lubricants and Coatings: High demand from automotive, industrial machinery, and aerospace sectors.
- Semiconductors: Rising adoption in advanced electronics and transistors.
- Catalysts: Expanding applications in chemical and petrochemical industries.
- Automotive: Growth in vehicle production and demand for high-performance lubricants.
- Aerospace and Defense: Use in high-temperature applications and advanced materials.
Molybdenum Disulfide Industry Product Developments
Recent advancements include the development of novel MoS2-based nanocomposites with enhanced properties, including improved lubrication, higher thermal conductivity, and enhanced electrical characteristics. These innovations expand the potential applications of MoS2 in various industries, creating a competitive edge for companies investing in research and development. The focus is on creating materials with improved performance, enhanced durability, and environmentally friendly characteristics.
Challenges in the Molybdenum Disulfide Industry Market
The industry faces challenges related to fluctuating raw material prices, potential supply chain disruptions, and intense competition among numerous players. Regulatory compliance and environmental concerns also present hurdles, requiring companies to invest in sustainable practices. These factors can significantly impact profitability and market growth, necessitating proactive strategies for risk mitigation.
Forces Driving Molybdenum Disulfide Industry Growth
Several factors drive the growth of the MoS2 market:
- Technological Advancements: Development of new MoS2-based materials with enhanced properties.
- Economic Growth: Increased industrial activity and infrastructure development in emerging economies.
- Government Regulations: Support for green technologies and sustainable manufacturing.
Examples include the growing adoption of electric vehicles requiring advanced lubricants and the rising demand for electronics containing MoS2-based components.
Long-Term Growth Catalysts in the Molybdenum Disulfide Industry
Long-term growth will be driven by continued innovation in materials science, strategic partnerships among industry players, and expansion into new applications. Further research and development focusing on cost reduction and improved performance will be pivotal. Increased collaboration between research institutions and industry players will accelerate innovation and market penetration.
Emerging Opportunities in Molybdenum Disulfide Industry
Emerging opportunities lie in the exploration of MoS2's applications in energy storage, sensors, and biomedical fields. The development of sustainable and cost-effective manufacturing processes presents further opportunities for growth. Expanding into new geographic markets, particularly in developing economies, offers significant potential.
Leading Players in the Molybdenum Disulfide Industry Sector
- Tribotecc
- Merck KGaA
- American Elements
- Jinduicheng Molybdenum Co Ltd
- Rose Mill Co
- Advanced Engineering Materials Limited
- Songxian Exploiter Molybdenum Co
- Freeport-McMoRan
- Moly metal LLP
- Luoyang Shenyu Molybdenum Co Ltd
- Grupo Mexico
Key Milestones in Molybdenum Disulfide Industry
- December 2022: Researchers at KAUST and Aramco announced the development of a three-dimensional molybdenum disulfide foam with a structural hierarchy spanning seven orders of magnitude. This breakthrough significantly enhances the potential applications of MoS2 in energy storage and other electrochemical processes.
Strategic Outlook for Molybdenum Disulfide Industry Market
The future of the MoS2 market is bright, driven by technological innovation, expanding applications, and strong growth in key end-user industries. Companies focusing on R&D, strategic partnerships, and sustainable practices are well-positioned to capitalize on the significant growth opportunities ahead. The market's future hinges on continued innovation and addressing the challenges of cost, supply chain, and regulatory compliance.
Molybdenum Disulfide Industry Segmentation
-
1. Type
- 1.1. Molybdenum Disulfide (MoS2) Powder
- 1.2. Molybdenum Disulfide (MoS2) Crystals
-
2. Application
- 2.1. Lubricants and Coatings
- 2.2. Semiconductor
- 2.3. Catalysts
- 2.4. Other Applications
-
3. End-user Industry
- 3.1. Automotive
- 3.2. Aerospace and Defense
- 3.3. Electrical and Electronics
- 3.4. Construction
- 3.5. Chemical and Petrochemical
- 3.6. Other En
Molybdenum Disulfide Industry Segmentation By Geography
-
1. Asia Pacific
- 1.1. China
- 1.2. India
- 1.3. Japan
- 1.4. South Korea
- 1.5. Rest of Asia Pacific
-
2. North America
- 2.1. United States
- 2.2. Canada
- 2.3. Mexico
-
3. Europe
- 3.1. Germany
- 3.2. United Kingdom
- 3.3. Italy
- 3.4. France
- 3.5. Rest of Europe
-
4. South America
- 4.1. Brazil
- 4.2. Argentina
- 4.3. Rest of South America
-
5. Middle East and Africa
- 5.1. Saudi Arabia
- 5.2. South Africa
- 5.3. Rest of Middle East and Africa
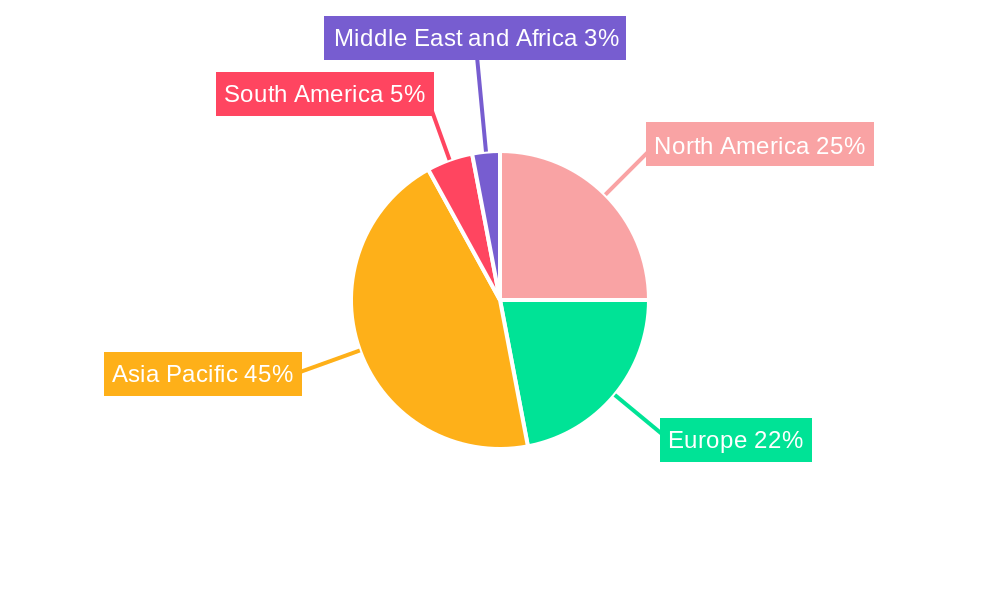
Molybdenum Disulfide Industry Regional Market Share
Geographic Coverage of Molybdenum Disulfide Industry
Molybdenum Disulfide Industry REPORT HIGHLIGHTS
| Aspects | Details |
|---|---|
| Study Period | 2020-2034 |
| Base Year | 2025 |
| Estimated Year | 2026 |
| Forecast Period | 2026-2034 |
| Historical Period | 2020-2025 |
| Growth Rate | CAGR of 4.7% from 2020-2034 |
| Segmentation |
|
Table of Contents
- 1. Introduction
- 1.1. Research Scope
- 1.2. Market Segmentation
- 1.3. Research Objective
- 1.4. Definitions and Assumptions
- 2. Executive Summary
- 2.1. Market Snapshot
- 3. Market Dynamics
- 3.1. Market Drivers
- 3.2. Market Restrains
- 3.3. Market Trends
- 3.4. Market Opportunities
- 4. Market Factor Analysis
- 4.1. Porters Five Forces
- 4.1.1. Bargaining Power of Suppliers
- 4.1.2. Bargaining Power of Buyers
- 4.1.3. Threat of New Entrants
- 4.1.4. Threat of Substitutes
- 4.1.5. Competitive Rivalry
- 4.2. PESTEL analysis
- 4.3. BCG Analysis
- 4.3.1. Stars (High Growth, High Market Share)
- 4.3.2. Cash Cows (Low Growth, High Market Share)
- 4.3.3. Question Mark (High Growth, Low Market Share)
- 4.3.4. Dogs (Low Growth, Low Market Share)
- 4.4. Ansoff Matrix Analysis
- 4.5. Supply Chain Analysis
- 4.6. Regulatory Landscape
- 4.7. Current Market Potential and Opportunity Assessment (TAM–SAM–SOM Framework)
- 4.8. MSR Analyst Note
- 4.1. Porters Five Forces
- 5. Market Analysis, Insights and Forecast 2021-2033
- 5.1. Market Analysis, Insights and Forecast - by Type
- 5.1.1. Molybdenum Disulfide (MoS2) Powder
- 5.1.2. Molybdenum Disulfide (MoS2) Crystals
- 5.2. Market Analysis, Insights and Forecast - by Application
- 5.2.1. Lubricants and Coatings
- 5.2.2. Semiconductor
- 5.2.3. Catalysts
- 5.2.4. Other Applications
- 5.3. Market Analysis, Insights and Forecast - by End-user Industry
- 5.3.1. Automotive
- 5.3.2. Aerospace and Defense
- 5.3.3. Electrical and Electronics
- 5.3.4. Construction
- 5.3.5. Chemical and Petrochemical
- 5.3.6. Other En
- 5.4. Market Analysis, Insights and Forecast - by Region
- 5.4.1. Asia Pacific
- 5.4.2. North America
- 5.4.3. Europe
- 5.4.4. South America
- 5.4.5. Middle East and Africa
- 5.1. Market Analysis, Insights and Forecast - by Type
- 6. Global Molybdenum Disulfide Industry Analysis, Insights and Forecast, 2021-2033
- 6.1. Market Analysis, Insights and Forecast - by Type
- 6.1.1. Molybdenum Disulfide (MoS2) Powder
- 6.1.2. Molybdenum Disulfide (MoS2) Crystals
- 6.2. Market Analysis, Insights and Forecast - by Application
- 6.2.1. Lubricants and Coatings
- 6.2.2. Semiconductor
- 6.2.3. Catalysts
- 6.2.4. Other Applications
- 6.3. Market Analysis, Insights and Forecast - by End-user Industry
- 6.3.1. Automotive
- 6.3.2. Aerospace and Defense
- 6.3.3. Electrical and Electronics
- 6.3.4. Construction
- 6.3.5. Chemical and Petrochemical
- 6.3.6. Other En
- 6.1. Market Analysis, Insights and Forecast - by Type
- 7. Asia Pacific Molybdenum Disulfide Industry Analysis, Insights and Forecast, 2020-2032
- 7.1. Market Analysis, Insights and Forecast - by Type
- 7.1.1. Molybdenum Disulfide (MoS2) Powder
- 7.1.2. Molybdenum Disulfide (MoS2) Crystals
- 7.2. Market Analysis, Insights and Forecast - by Application
- 7.2.1. Lubricants and Coatings
- 7.2.2. Semiconductor
- 7.2.3. Catalysts
- 7.2.4. Other Applications
- 7.3. Market Analysis, Insights and Forecast - by End-user Industry
- 7.3.1. Automotive
- 7.3.2. Aerospace and Defense
- 7.3.3. Electrical and Electronics
- 7.3.4. Construction
- 7.3.5. Chemical and Petrochemical
- 7.3.6. Other En
- 7.1. Market Analysis, Insights and Forecast - by Type
- 8. North America Molybdenum Disulfide Industry Analysis, Insights and Forecast, 2020-2032
- 8.1. Market Analysis, Insights and Forecast - by Type
- 8.1.1. Molybdenum Disulfide (MoS2) Powder
- 8.1.2. Molybdenum Disulfide (MoS2) Crystals
- 8.2. Market Analysis, Insights and Forecast - by Application
- 8.2.1. Lubricants and Coatings
- 8.2.2. Semiconductor
- 8.2.3. Catalysts
- 8.2.4. Other Applications
- 8.3. Market Analysis, Insights and Forecast - by End-user Industry
- 8.3.1. Automotive
- 8.3.2. Aerospace and Defense
- 8.3.3. Electrical and Electronics
- 8.3.4. Construction
- 8.3.5. Chemical and Petrochemical
- 8.3.6. Other En
- 8.1. Market Analysis, Insights and Forecast - by Type
- 9. Europe Molybdenum Disulfide Industry Analysis, Insights and Forecast, 2020-2032
- 9.1. Market Analysis, Insights and Forecast - by Type
- 9.1.1. Molybdenum Disulfide (MoS2) Powder
- 9.1.2. Molybdenum Disulfide (MoS2) Crystals
- 9.2. Market Analysis, Insights and Forecast - by Application
- 9.2.1. Lubricants and Coatings
- 9.2.2. Semiconductor
- 9.2.3. Catalysts
- 9.2.4. Other Applications
- 9.3. Market Analysis, Insights and Forecast - by End-user Industry
- 9.3.1. Automotive
- 9.3.2. Aerospace and Defense
- 9.3.3. Electrical and Electronics
- 9.3.4. Construction
- 9.3.5. Chemical and Petrochemical
- 9.3.6. Other En
- 9.1. Market Analysis, Insights and Forecast - by Type
- 10. South America Molybdenum Disulfide Industry Analysis, Insights and Forecast, 2020-2032
- 10.1. Market Analysis, Insights and Forecast - by Type
- 10.1.1. Molybdenum Disulfide (MoS2) Powder
- 10.1.2. Molybdenum Disulfide (MoS2) Crystals
- 10.2. Market Analysis, Insights and Forecast - by Application
- 10.2.1. Lubricants and Coatings
- 10.2.2. Semiconductor
- 10.2.3. Catalysts
- 10.2.4. Other Applications
- 10.3. Market Analysis, Insights and Forecast - by End-user Industry
- 10.3.1. Automotive
- 10.3.2. Aerospace and Defense
- 10.3.3. Electrical and Electronics
- 10.3.4. Construction
- 10.3.5. Chemical and Petrochemical
- 10.3.6. Other En
- 10.1. Market Analysis, Insights and Forecast - by Type
- 11. Middle East and Africa Molybdenum Disulfide Industry Analysis, Insights and Forecast, 2020-2032
- 11.1. Market Analysis, Insights and Forecast - by Type
- 11.1.1. Molybdenum Disulfide (MoS2) Powder
- 11.1.2. Molybdenum Disulfide (MoS2) Crystals
- 11.2. Market Analysis, Insights and Forecast - by Application
- 11.2.1. Lubricants and Coatings
- 11.2.2. Semiconductor
- 11.2.3. Catalysts
- 11.2.4. Other Applications
- 11.3. Market Analysis, Insights and Forecast - by End-user Industry
- 11.3.1. Automotive
- 11.3.2. Aerospace and Defense
- 11.3.3. Electrical and Electronics
- 11.3.4. Construction
- 11.3.5. Chemical and Petrochemical
- 11.3.6. Other En
- 11.1. Market Analysis, Insights and Forecast - by Type
- 12. Competitive Analysis
- 12.1. Company Profiles
- 12.1.1 Tribotecc*List Not Exhaustive
- 12.1.1.1. Company Overview
- 12.1.1.2. Products
- 12.1.1.3. Company Financials
- 12.1.1.4. SWOT Analysis
- 12.1.2 Merck KGaA
- 12.1.2.1. Company Overview
- 12.1.2.2. Products
- 12.1.2.3. Company Financials
- 12.1.2.4. SWOT Analysis
- 12.1.3 American Elements
- 12.1.3.1. Company Overview
- 12.1.3.2. Products
- 12.1.3.3. Company Financials
- 12.1.3.4. SWOT Analysis
- 12.1.4 Jinduicheng Molybdenum Co Ltd
- 12.1.4.1. Company Overview
- 12.1.4.2. Products
- 12.1.4.3. Company Financials
- 12.1.4.4. SWOT Analysis
- 12.1.5 Rose Mill Co
- 12.1.5.1. Company Overview
- 12.1.5.2. Products
- 12.1.5.3. Company Financials
- 12.1.5.4. SWOT Analysis
- 12.1.6 Advanced Engineering Materials Limited
- 12.1.6.1. Company Overview
- 12.1.6.2. Products
- 12.1.6.3. Company Financials
- 12.1.6.4. SWOT Analysis
- 12.1.7 Songxian Exploiter Molybdenum Co
- 12.1.7.1. Company Overview
- 12.1.7.2. Products
- 12.1.7.3. Company Financials
- 12.1.7.4. SWOT Analysis
- 12.1.8 Freeport-McMoRan
- 12.1.8.1. Company Overview
- 12.1.8.2. Products
- 12.1.8.3. Company Financials
- 12.1.8.4. SWOT Analysis
- 12.1.9 Moly metal LLP
- 12.1.9.1. Company Overview
- 12.1.9.2. Products
- 12.1.9.3. Company Financials
- 12.1.9.4. SWOT Analysis
- 12.1.10 Luoyang Shenyu Molybdenum Co Ltd
- 12.1.10.1. Company Overview
- 12.1.10.2. Products
- 12.1.10.3. Company Financials
- 12.1.10.4. SWOT Analysis
- 12.1.11 Grupo Mexico
- 12.1.11.1. Company Overview
- 12.1.11.2. Products
- 12.1.11.3. Company Financials
- 12.1.11.4. SWOT Analysis
- 12.1.1 Tribotecc*List Not Exhaustive
- 12.2. Market Entropy
- 12.2.1 Company's Key Areas Served
- 12.2.2 Recent Developments
- 12.3. Company Market Share Analysis 2025
- 12.3.1 Top 5 Companies Market Share Analysis
- 12.3.2 Top 3 Companies Market Share Analysis
- 12.4. List of Potential Customers
- 13. Research Methodology
List of Figures
- Figure 1: Global Molybdenum Disulfide Industry Revenue Breakdown (billion, %) by Region 2025 & 2033
- Figure 2: Global Molybdenum Disulfide Industry Volume Breakdown (kilotons, %) by Region 2025 & 2033
- Figure 3: Asia Pacific Molybdenum Disulfide Industry Revenue (billion), by Type 2025 & 2033
- Figure 4: Asia Pacific Molybdenum Disulfide Industry Volume (kilotons), by Type 2025 & 2033
- Figure 5: Asia Pacific Molybdenum Disulfide Industry Revenue Share (%), by Type 2025 & 2033
- Figure 6: Asia Pacific Molybdenum Disulfide Industry Volume Share (%), by Type 2025 & 2033
- Figure 7: Asia Pacific Molybdenum Disulfide Industry Revenue (billion), by Application 2025 & 2033
- Figure 8: Asia Pacific Molybdenum Disulfide Industry Volume (kilotons), by Application 2025 & 2033
- Figure 9: Asia Pacific Molybdenum Disulfide Industry Revenue Share (%), by Application 2025 & 2033
- Figure 10: Asia Pacific Molybdenum Disulfide Industry Volume Share (%), by Application 2025 & 2033
- Figure 11: Asia Pacific Molybdenum Disulfide Industry Revenue (billion), by End-user Industry 2025 & 2033
- Figure 12: Asia Pacific Molybdenum Disulfide Industry Volume (kilotons), by End-user Industry 2025 & 2033
- Figure 13: Asia Pacific Molybdenum Disulfide Industry Revenue Share (%), by End-user Industry 2025 & 2033
- Figure 14: Asia Pacific Molybdenum Disulfide Industry Volume Share (%), by End-user Industry 2025 & 2033
- Figure 15: Asia Pacific Molybdenum Disulfide Industry Revenue (billion), by Country 2025 & 2033
- Figure 16: Asia Pacific Molybdenum Disulfide Industry Volume (kilotons), by Country 2025 & 2033
- Figure 17: Asia Pacific Molybdenum Disulfide Industry Revenue Share (%), by Country 2025 & 2033
- Figure 18: Asia Pacific Molybdenum Disulfide Industry Volume Share (%), by Country 2025 & 2033
- Figure 19: North America Molybdenum Disulfide Industry Revenue (billion), by Type 2025 & 2033
- Figure 20: North America Molybdenum Disulfide Industry Volume (kilotons), by Type 2025 & 2033
- Figure 21: North America Molybdenum Disulfide Industry Revenue Share (%), by Type 2025 & 2033
- Figure 22: North America Molybdenum Disulfide Industry Volume Share (%), by Type 2025 & 2033
- Figure 23: North America Molybdenum Disulfide Industry Revenue (billion), by Application 2025 & 2033
- Figure 24: North America Molybdenum Disulfide Industry Volume (kilotons), by Application 2025 & 2033
- Figure 25: North America Molybdenum Disulfide Industry Revenue Share (%), by Application 2025 & 2033
- Figure 26: North America Molybdenum Disulfide Industry Volume Share (%), by Application 2025 & 2033
- Figure 27: North America Molybdenum Disulfide Industry Revenue (billion), by End-user Industry 2025 & 2033
- Figure 28: North America Molybdenum Disulfide Industry Volume (kilotons), by End-user Industry 2025 & 2033
- Figure 29: North America Molybdenum Disulfide Industry Revenue Share (%), by End-user Industry 2025 & 2033
- Figure 30: North America Molybdenum Disulfide Industry Volume Share (%), by End-user Industry 2025 & 2033
- Figure 31: North America Molybdenum Disulfide Industry Revenue (billion), by Country 2025 & 2033
- Figure 32: North America Molybdenum Disulfide Industry Volume (kilotons), by Country 2025 & 2033
- Figure 33: North America Molybdenum Disulfide Industry Revenue Share (%), by Country 2025 & 2033
- Figure 34: North America Molybdenum Disulfide Industry Volume Share (%), by Country 2025 & 2033
- Figure 35: Europe Molybdenum Disulfide Industry Revenue (billion), by Type 2025 & 2033
- Figure 36: Europe Molybdenum Disulfide Industry Volume (kilotons), by Type 2025 & 2033
- Figure 37: Europe Molybdenum Disulfide Industry Revenue Share (%), by Type 2025 & 2033
- Figure 38: Europe Molybdenum Disulfide Industry Volume Share (%), by Type 2025 & 2033
- Figure 39: Europe Molybdenum Disulfide Industry Revenue (billion), by Application 2025 & 2033
- Figure 40: Europe Molybdenum Disulfide Industry Volume (kilotons), by Application 2025 & 2033
- Figure 41: Europe Molybdenum Disulfide Industry Revenue Share (%), by Application 2025 & 2033
- Figure 42: Europe Molybdenum Disulfide Industry Volume Share (%), by Application 2025 & 2033
- Figure 43: Europe Molybdenum Disulfide Industry Revenue (billion), by End-user Industry 2025 & 2033
- Figure 44: Europe Molybdenum Disulfide Industry Volume (kilotons), by End-user Industry 2025 & 2033
- Figure 45: Europe Molybdenum Disulfide Industry Revenue Share (%), by End-user Industry 2025 & 2033
- Figure 46: Europe Molybdenum Disulfide Industry Volume Share (%), by End-user Industry 2025 & 2033
- Figure 47: Europe Molybdenum Disulfide Industry Revenue (billion), by Country 2025 & 2033
- Figure 48: Europe Molybdenum Disulfide Industry Volume (kilotons), by Country 2025 & 2033
- Figure 49: Europe Molybdenum Disulfide Industry Revenue Share (%), by Country 2025 & 2033
- Figure 50: Europe Molybdenum Disulfide Industry Volume Share (%), by Country 2025 & 2033
- Figure 51: South America Molybdenum Disulfide Industry Revenue (billion), by Type 2025 & 2033
- Figure 52: South America Molybdenum Disulfide Industry Volume (kilotons), by Type 2025 & 2033
- Figure 53: South America Molybdenum Disulfide Industry Revenue Share (%), by Type 2025 & 2033
- Figure 54: South America Molybdenum Disulfide Industry Volume Share (%), by Type 2025 & 2033
- Figure 55: South America Molybdenum Disulfide Industry Revenue (billion), by Application 2025 & 2033
- Figure 56: South America Molybdenum Disulfide Industry Volume (kilotons), by Application 2025 & 2033
- Figure 57: South America Molybdenum Disulfide Industry Revenue Share (%), by Application 2025 & 2033
- Figure 58: South America Molybdenum Disulfide Industry Volume Share (%), by Application 2025 & 2033
- Figure 59: South America Molybdenum Disulfide Industry Revenue (billion), by End-user Industry 2025 & 2033
- Figure 60: South America Molybdenum Disulfide Industry Volume (kilotons), by End-user Industry 2025 & 2033
- Figure 61: South America Molybdenum Disulfide Industry Revenue Share (%), by End-user Industry 2025 & 2033
- Figure 62: South America Molybdenum Disulfide Industry Volume Share (%), by End-user Industry 2025 & 2033
- Figure 63: South America Molybdenum Disulfide Industry Revenue (billion), by Country 2025 & 2033
- Figure 64: South America Molybdenum Disulfide Industry Volume (kilotons), by Country 2025 & 2033
- Figure 65: South America Molybdenum Disulfide Industry Revenue Share (%), by Country 2025 & 2033
- Figure 66: South America Molybdenum Disulfide Industry Volume Share (%), by Country 2025 & 2033
- Figure 67: Middle East and Africa Molybdenum Disulfide Industry Revenue (billion), by Type 2025 & 2033
- Figure 68: Middle East and Africa Molybdenum Disulfide Industry Volume (kilotons), by Type 2025 & 2033
- Figure 69: Middle East and Africa Molybdenum Disulfide Industry Revenue Share (%), by Type 2025 & 2033
- Figure 70: Middle East and Africa Molybdenum Disulfide Industry Volume Share (%), by Type 2025 & 2033
- Figure 71: Middle East and Africa Molybdenum Disulfide Industry Revenue (billion), by Application 2025 & 2033
- Figure 72: Middle East and Africa Molybdenum Disulfide Industry Volume (kilotons), by Application 2025 & 2033
- Figure 73: Middle East and Africa Molybdenum Disulfide Industry Revenue Share (%), by Application 2025 & 2033
- Figure 74: Middle East and Africa Molybdenum Disulfide Industry Volume Share (%), by Application 2025 & 2033
- Figure 75: Middle East and Africa Molybdenum Disulfide Industry Revenue (billion), by End-user Industry 2025 & 2033
- Figure 76: Middle East and Africa Molybdenum Disulfide Industry Volume (kilotons), by End-user Industry 2025 & 2033
- Figure 77: Middle East and Africa Molybdenum Disulfide Industry Revenue Share (%), by End-user Industry 2025 & 2033
- Figure 78: Middle East and Africa Molybdenum Disulfide Industry Volume Share (%), by End-user Industry 2025 & 2033
- Figure 79: Middle East and Africa Molybdenum Disulfide Industry Revenue (billion), by Country 2025 & 2033
- Figure 80: Middle East and Africa Molybdenum Disulfide Industry Volume (kilotons), by Country 2025 & 2033
- Figure 81: Middle East and Africa Molybdenum Disulfide Industry Revenue Share (%), by Country 2025 & 2033
- Figure 82: Middle East and Africa Molybdenum Disulfide Industry Volume Share (%), by Country 2025 & 2033
List of Tables
- Table 1: Global Molybdenum Disulfide Industry Revenue billion Forecast, by Type 2020 & 2033
- Table 2: Global Molybdenum Disulfide Industry Volume kilotons Forecast, by Type 2020 & 2033
- Table 3: Global Molybdenum Disulfide Industry Revenue billion Forecast, by Application 2020 & 2033
- Table 4: Global Molybdenum Disulfide Industry Volume kilotons Forecast, by Application 2020 & 2033
- Table 5: Global Molybdenum Disulfide Industry Revenue billion Forecast, by End-user Industry 2020 & 2033
- Table 6: Global Molybdenum Disulfide Industry Volume kilotons Forecast, by End-user Industry 2020 & 2033
- Table 7: Global Molybdenum Disulfide Industry Revenue billion Forecast, by Region 2020 & 2033
- Table 8: Global Molybdenum Disulfide Industry Volume kilotons Forecast, by Region 2020 & 2033
- Table 9: Global Molybdenum Disulfide Industry Revenue billion Forecast, by Type 2020 & 2033
- Table 10: Global Molybdenum Disulfide Industry Volume kilotons Forecast, by Type 2020 & 2033
- Table 11: Global Molybdenum Disulfide Industry Revenue billion Forecast, by Application 2020 & 2033
- Table 12: Global Molybdenum Disulfide Industry Volume kilotons Forecast, by Application 2020 & 2033
- Table 13: Global Molybdenum Disulfide Industry Revenue billion Forecast, by End-user Industry 2020 & 2033
- Table 14: Global Molybdenum Disulfide Industry Volume kilotons Forecast, by End-user Industry 2020 & 2033
- Table 15: Global Molybdenum Disulfide Industry Revenue billion Forecast, by Country 2020 & 2033
- Table 16: Global Molybdenum Disulfide Industry Volume kilotons Forecast, by Country 2020 & 2033
- Table 17: China Molybdenum Disulfide Industry Revenue (billion) Forecast, by Application 2020 & 2033
- Table 18: China Molybdenum Disulfide Industry Volume (kilotons) Forecast, by Application 2020 & 2033
- Table 19: India Molybdenum Disulfide Industry Revenue (billion) Forecast, by Application 2020 & 2033
- Table 20: India Molybdenum Disulfide Industry Volume (kilotons) Forecast, by Application 2020 & 2033
- Table 21: Japan Molybdenum Disulfide Industry Revenue (billion) Forecast, by Application 2020 & 2033
- Table 22: Japan Molybdenum Disulfide Industry Volume (kilotons) Forecast, by Application 2020 & 2033
- Table 23: South Korea Molybdenum Disulfide Industry Revenue (billion) Forecast, by Application 2020 & 2033
- Table 24: South Korea Molybdenum Disulfide Industry Volume (kilotons) Forecast, by Application 2020 & 2033
- Table 25: Rest of Asia Pacific Molybdenum Disulfide Industry Revenue (billion) Forecast, by Application 2020 & 2033
- Table 26: Rest of Asia Pacific Molybdenum Disulfide Industry Volume (kilotons) Forecast, by Application 2020 & 2033
- Table 27: Global Molybdenum Disulfide Industry Revenue billion Forecast, by Type 2020 & 2033
- Table 28: Global Molybdenum Disulfide Industry Volume kilotons Forecast, by Type 2020 & 2033
- Table 29: Global Molybdenum Disulfide Industry Revenue billion Forecast, by Application 2020 & 2033
- Table 30: Global Molybdenum Disulfide Industry Volume kilotons Forecast, by Application 2020 & 2033
- Table 31: Global Molybdenum Disulfide Industry Revenue billion Forecast, by End-user Industry 2020 & 2033
- Table 32: Global Molybdenum Disulfide Industry Volume kilotons Forecast, by End-user Industry 2020 & 2033
- Table 33: Global Molybdenum Disulfide Industry Revenue billion Forecast, by Country 2020 & 2033
- Table 34: Global Molybdenum Disulfide Industry Volume kilotons Forecast, by Country 2020 & 2033
- Table 35: United States Molybdenum Disulfide Industry Revenue (billion) Forecast, by Application 2020 & 2033
- Table 36: United States Molybdenum Disulfide Industry Volume (kilotons) Forecast, by Application 2020 & 2033
- Table 37: Canada Molybdenum Disulfide Industry Revenue (billion) Forecast, by Application 2020 & 2033
- Table 38: Canada Molybdenum Disulfide Industry Volume (kilotons) Forecast, by Application 2020 & 2033
- Table 39: Mexico Molybdenum Disulfide Industry Revenue (billion) Forecast, by Application 2020 & 2033
- Table 40: Mexico Molybdenum Disulfide Industry Volume (kilotons) Forecast, by Application 2020 & 2033
- Table 41: Global Molybdenum Disulfide Industry Revenue billion Forecast, by Type 2020 & 2033
- Table 42: Global Molybdenum Disulfide Industry Volume kilotons Forecast, by Type 2020 & 2033
- Table 43: Global Molybdenum Disulfide Industry Revenue billion Forecast, by Application 2020 & 2033
- Table 44: Global Molybdenum Disulfide Industry Volume kilotons Forecast, by Application 2020 & 2033
- Table 45: Global Molybdenum Disulfide Industry Revenue billion Forecast, by End-user Industry 2020 & 2033
- Table 46: Global Molybdenum Disulfide Industry Volume kilotons Forecast, by End-user Industry 2020 & 2033
- Table 47: Global Molybdenum Disulfide Industry Revenue billion Forecast, by Country 2020 & 2033
- Table 48: Global Molybdenum Disulfide Industry Volume kilotons Forecast, by Country 2020 & 2033
- Table 49: Germany Molybdenum Disulfide Industry Revenue (billion) Forecast, by Application 2020 & 2033
- Table 50: Germany Molybdenum Disulfide Industry Volume (kilotons) Forecast, by Application 2020 & 2033
- Table 51: United Kingdom Molybdenum Disulfide Industry Revenue (billion) Forecast, by Application 2020 & 2033
- Table 52: United Kingdom Molybdenum Disulfide Industry Volume (kilotons) Forecast, by Application 2020 & 2033
- Table 53: Italy Molybdenum Disulfide Industry Revenue (billion) Forecast, by Application 2020 & 2033
- Table 54: Italy Molybdenum Disulfide Industry Volume (kilotons) Forecast, by Application 2020 & 2033
- Table 55: France Molybdenum Disulfide Industry Revenue (billion) Forecast, by Application 2020 & 2033
- Table 56: France Molybdenum Disulfide Industry Volume (kilotons) Forecast, by Application 2020 & 2033
- Table 57: Rest of Europe Molybdenum Disulfide Industry Revenue (billion) Forecast, by Application 2020 & 2033
- Table 58: Rest of Europe Molybdenum Disulfide Industry Volume (kilotons) Forecast, by Application 2020 & 2033
- Table 59: Global Molybdenum Disulfide Industry Revenue billion Forecast, by Type 2020 & 2033
- Table 60: Global Molybdenum Disulfide Industry Volume kilotons Forecast, by Type 2020 & 2033
- Table 61: Global Molybdenum Disulfide Industry Revenue billion Forecast, by Application 2020 & 2033
- Table 62: Global Molybdenum Disulfide Industry Volume kilotons Forecast, by Application 2020 & 2033
- Table 63: Global Molybdenum Disulfide Industry Revenue billion Forecast, by End-user Industry 2020 & 2033
- Table 64: Global Molybdenum Disulfide Industry Volume kilotons Forecast, by End-user Industry 2020 & 2033
- Table 65: Global Molybdenum Disulfide Industry Revenue billion Forecast, by Country 2020 & 2033
- Table 66: Global Molybdenum Disulfide Industry Volume kilotons Forecast, by Country 2020 & 2033
- Table 67: Brazil Molybdenum Disulfide Industry Revenue (billion) Forecast, by Application 2020 & 2033
- Table 68: Brazil Molybdenum Disulfide Industry Volume (kilotons) Forecast, by Application 2020 & 2033
- Table 69: Argentina Molybdenum Disulfide Industry Revenue (billion) Forecast, by Application 2020 & 2033
- Table 70: Argentina Molybdenum Disulfide Industry Volume (kilotons) Forecast, by Application 2020 & 2033
- Table 71: Rest of South America Molybdenum Disulfide Industry Revenue (billion) Forecast, by Application 2020 & 2033
- Table 72: Rest of South America Molybdenum Disulfide Industry Volume (kilotons) Forecast, by Application 2020 & 2033
- Table 73: Global Molybdenum Disulfide Industry Revenue billion Forecast, by Type 2020 & 2033
- Table 74: Global Molybdenum Disulfide Industry Volume kilotons Forecast, by Type 2020 & 2033
- Table 75: Global Molybdenum Disulfide Industry Revenue billion Forecast, by Application 2020 & 2033
- Table 76: Global Molybdenum Disulfide Industry Volume kilotons Forecast, by Application 2020 & 2033
- Table 77: Global Molybdenum Disulfide Industry Revenue billion Forecast, by End-user Industry 2020 & 2033
- Table 78: Global Molybdenum Disulfide Industry Volume kilotons Forecast, by End-user Industry 2020 & 2033
- Table 79: Global Molybdenum Disulfide Industry Revenue billion Forecast, by Country 2020 & 2033
- Table 80: Global Molybdenum Disulfide Industry Volume kilotons Forecast, by Country 2020 & 2033
- Table 81: Saudi Arabia Molybdenum Disulfide Industry Revenue (billion) Forecast, by Application 2020 & 2033
- Table 82: Saudi Arabia Molybdenum Disulfide Industry Volume (kilotons) Forecast, by Application 2020 & 2033
- Table 83: South Africa Molybdenum Disulfide Industry Revenue (billion) Forecast, by Application 2020 & 2033
- Table 84: South Africa Molybdenum Disulfide Industry Volume (kilotons) Forecast, by Application 2020 & 2033
- Table 85: Rest of Middle East and Africa Molybdenum Disulfide Industry Revenue (billion) Forecast, by Application 2020 & 2033
- Table 86: Rest of Middle East and Africa Molybdenum Disulfide Industry Volume (kilotons) Forecast, by Application 2020 & 2033
Frequently Asked Questions
1. What is the projected Compound Annual Growth Rate (CAGR) of the Molybdenum Disulfide Industry?
The projected CAGR is approximately 4.7%.
2. Which companies are prominent players in the Molybdenum Disulfide Industry?
Key companies in the market include Tribotecc*List Not Exhaustive, Merck KGaA, American Elements, Jinduicheng Molybdenum Co Ltd, Rose Mill Co, Advanced Engineering Materials Limited, Songxian Exploiter Molybdenum Co, Freeport-McMoRan, Moly metal LLP, Luoyang Shenyu Molybdenum Co Ltd, Grupo Mexico.
3. What are the main segments of the Molybdenum Disulfide Industry?
The market segments include Type, Application, End-user Industry.
4. Can you provide details about the market size?
The market size is estimated to be USD 0.9 billion as of 2022.
5. What are some drivers contributing to market growth?
Growing Application of Lubricants in Various End-use Industries; Increasing Demand from Automotive Industries; Growing Utilization in LEDs. Lasers and other Electronic Industry Applications.
6. What are the notable trends driving market growth?
Automotive Segment to Dominate the Market.
7. Are there any restraints impacting market growth?
Availability of Better Alternatives; Other Restraints.
8. Can you provide examples of recent developments in the market?
December 2022: Researchers at KAUST and Aramco made an announcement regarding the development of a three-dimensional molybdenum disulfide foam with a structural hierarchy spanning seven orders of magnitude. This foam forms an interpenetrating network that facilitates efficient charge transfer, and fast ion diffusion and provides mechanically and chemically robust support for electrochemical processes.
9. What pricing options are available for accessing the report?
Pricing options include single-user, multi-user, and enterprise licenses priced at USD 4750, USD 5250, and USD 8750 respectively.
10. Is the market size provided in terms of value or volume?
The market size is provided in terms of value, measured in billion and volume, measured in kilotons.
11. Are there any specific market keywords associated with the report?
Yes, the market keyword associated with the report is "Molybdenum Disulfide Industry," which aids in identifying and referencing the specific market segment covered.
12. How do I determine which pricing option suits my needs best?
The pricing options vary based on user requirements and access needs. Individual users may opt for single-user licenses, while businesses requiring broader access may choose multi-user or enterprise licenses for cost-effective access to the report.
13. Are there any additional resources or data provided in the Molybdenum Disulfide Industry report?
While the report offers comprehensive insights, it's advisable to review the specific contents or supplementary materials provided to ascertain if additional resources or data are available.
14. How can I stay updated on further developments or reports in the Molybdenum Disulfide Industry?
To stay informed about further developments, trends, and reports in the Molybdenum Disulfide Industry, consider subscribing to industry newsletters, following relevant companies and organizations, or regularly checking reputable industry news sources and publications.
Methodology
Step 1 - Identification of Relevant Samples Size from Population Database


Step 2 - Approaches for Defining Global Market Size (Value, Volume* & Price*)

Note*: In applicable scenarios
Step 3 - Data Sources
Primary Research
- Web Analytics
- Survey Reports
- Research Institute
- Latest Research Reports
- Opinion Leaders
Secondary Research
- Annual Reports
- White Paper
- Latest Press Release
- Industry Association
- Paid Database
- Investor Presentations

Step 4 - Data Triangulation
Involves using different sources of information in order to increase the validity of a study
These sources are likely to be stakeholders in a program - participants, other researchers, program staff, other community members, and so on.
Then we put all data in single framework & apply various statistical tools to find out the dynamic on the market.
During the analysis stage, feedback from the stakeholder groups would be compared to determine areas of agreement as well as areas of divergence