

Key Insights
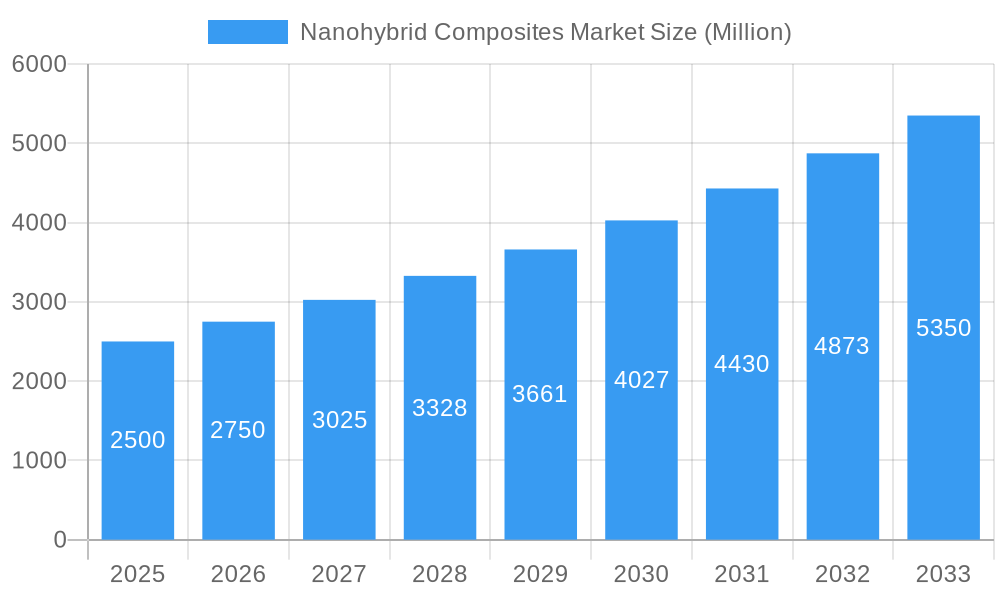
The nanohybrid composites market is experiencing robust growth, driven by increasing demand across diverse sectors. The market's Compound Annual Growth Rate (CAGR) exceeding 10% from 2019 to 2024 indicates a significant upward trajectory, projected to continue through 2033. This expansion is fueled by several key factors. The superior mechanical properties, lightweight nature, and enhanced functionalities of nanohybrid composites compared to traditional materials are driving adoption in diverse applications like dental materials, electronics, and paints & coatings. Advancements in nanotechnology are leading to the development of novel composites with tailored properties, further stimulating market growth. Specific material types like silica (SiO2) and titanium dioxide (TiO2) are experiencing particularly high demand due to their cost-effectiveness and versatile properties. Geographically, North America and Europe currently hold significant market share, but the Asia-Pacific region, particularly China and India, is expected to witness rapid growth fueled by increasing industrialization and infrastructure development. This growth, however, faces some restraints, such as the relatively high cost of production and potential regulatory hurdles related to the use of certain nanomaterials. Nevertheless, ongoing research and development efforts focused on cost reduction and improved safety profiles are mitigating these challenges.
Nanohybrid Composites Market Market Size (In Billion)
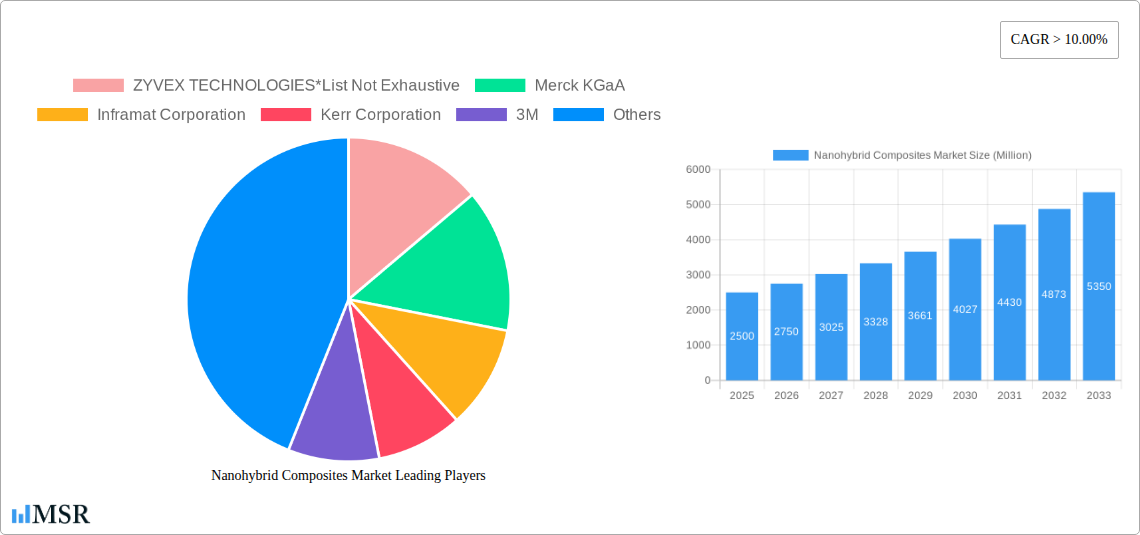
The competitive landscape is characterized by a mix of established players like 3M, BASF SE, and Merck KGaA, alongside emerging companies such as Zyvex Technologies and Jiangsu Cnano Technology Co. These companies are actively involved in innovation, focusing on developing new composite materials and expanding their product portfolio to cater to the diverse needs of various end-use industries. The market's segmentation by material type (Silica, Titanium dioxide, Zirconia, Carbons, Metals) and application (Dental Materials, Electrical & Electronics, Paints & Coatings, Other Applications) provides insights into specific areas of growth and potential investment opportunities. Continuous innovation in material science and a growing focus on sustainability within various end-use sectors are expected to further propel the market's expansion in the coming years. The market's projected value in 2025 serves as a strong indicator of its continued success and potential for investors and businesses alike.
Nanohybrid Composites Market Company Market Share
Nanohybrid Composites Market Report: A Comprehensive Analysis (2019-2033)
This comprehensive report offers an in-depth analysis of the Nanohybrid Composites Market, providing crucial insights for stakeholders across the value chain. Covering the period from 2019 to 2033, with a focus on 2025, this study meticulously examines market dynamics, growth drivers, leading players, and future opportunities. The report utilizes data-driven analysis to forecast market trends and provides actionable recommendations for strategic decision-making. The global nanohybrid composites market is projected to reach xx Million by 2033, exhibiting a CAGR of xx% during the forecast period (2025-2033).
Nanohybrid Composites Market Concentration & Dynamics
The Nanohybrid Composites market exhibits a moderately concentrated landscape, with key players holding significant market share. Market concentration is influenced by factors such as technological advancements, economies of scale, and strategic acquisitions. The market's innovative ecosystem is characterized by continuous research and development, leading to the introduction of novel materials and applications. Regulatory frameworks, particularly concerning the safety and environmental impact of nanomaterials, play a significant role in shaping market dynamics. Substitute products, such as traditional composites, pose a competitive challenge, necessitating continuous innovation to maintain market share. End-user trends toward lightweight, high-performance materials fuel market growth. The market has witnessed a moderate level of M&A activity in recent years, with approximately xx deals recorded between 2019 and 2024. Key players are actively engaging in strategic partnerships and acquisitions to expand their product portfolios and market reach. For example, the market share of the top 5 players in 2024 was estimated at xx%.
- Market Share: Top 5 players hold xx% of the market (2024).
- M&A Activity: Approximately xx deals between 2019 and 2024.
- Innovation Ecosystem: Strong R&D focus on novel materials and applications.
- Regulatory Landscape: Growing emphasis on nanomaterial safety and environmental impact.
Nanohybrid Composites Market Industry Insights & Trends
The Nanohybrid Composites market is experiencing robust growth, driven by the increasing demand for high-performance materials across diverse sectors. Factors such as lightweighting initiatives in the automotive and aerospace industries, the expanding electronics sector, and the growing preference for durable and sustainable materials are key market drivers. Technological advancements in nanomaterial synthesis and processing techniques are continuously improving the properties and performance of nanohybrid composites, further propelling market growth. Evolving consumer preferences toward eco-friendly and sustainable products are also influencing market demand, leading to the development of bio-based and recyclable nanohybrid composites. The market size was valued at xx Million in 2024 and is expected to reach xx Million by 2033, representing a significant growth trajectory.
Key Markets & Segments Leading Nanohybrid Composites Market
The Electrical and Electronics application segment currently dominates the Nanohybrid Composites market, driven by the increasing demand for miniaturization and improved performance in electronic devices. The Silica (SiO2) material type holds a significant market share, owing to its versatility, cost-effectiveness, and excellent properties. Geographically, North America and Europe are currently leading markets, benefiting from strong industrial growth and technological advancements.
- Dominant Region: North America and Europe.
- Dominant Application: Electrical and Electronics.
- Dominant Material Type: Silica (SiO2).
Drivers for Growth:
- Strong demand for lightweight and high-performance materials in diverse industries.
- Increasing adoption of nanotechnology in various applications.
- Government initiatives promoting the use of advanced materials.
- Rising investments in research and development activities.
Nanohybrid Composites Market Product Developments
Recent product innovations in the Nanohybrid Composites market focus on enhancing material properties like strength, flexibility, and durability. This includes the development of novel nanohybrid composite materials with improved thermal conductivity, electrical insulation, and barrier properties. These advancements are expanding the applications of nanohybrid composites into new areas such as energy storage, biomedical devices, and advanced manufacturing. The competitive landscape is characterized by continuous innovation and efforts to differentiate product offerings based on superior performance characteristics and cost-effectiveness.
Challenges in the Nanohybrid Composites Market Market
The Nanohybrid Composites market faces challenges related to the high cost of nanomaterials, potential health and environmental concerns, and complexities in manufacturing and processing. Regulatory hurdles related to the use and handling of nanomaterials pose another significant challenge. Supply chain disruptions can impact the availability and cost of raw materials, influencing overall market dynamics. Intense competition among established players and new entrants also presents challenges for market participants.
Forces Driving Nanohybrid Composites Market Growth
Technological advancements in nanomaterial synthesis and processing, coupled with growing demand for high-performance materials across various industries, are key drivers for market expansion. Government support for research and development in nanotechnology, and the increasing adoption of sustainable manufacturing practices, further stimulate market growth. Economic growth in key markets globally also contributes significantly to market expansion.
Challenges in the Nanohybrid Composites Market Market (Long-Term Growth Catalysts)
Long-term growth will be fueled by continuous innovation in nanohybrid composite materials, leading to the development of even more advanced and specialized products. Strategic partnerships and collaborations between material suppliers, technology providers, and end-users will play a vital role in driving market expansion. Expansion into new and emerging markets, particularly in developing economies, presents a significant opportunity for long-term growth.
Emerging Opportunities in Nanohybrid Composites Market
Emerging opportunities lie in the development of bio-based and recyclable nanohybrid composites, addressing growing environmental concerns. The increasing demand for personalized medicine and advanced healthcare technologies is creating opportunities for the use of nanohybrid composites in biomedical applications. New markets such as 3D printing and additive manufacturing are also offering significant growth potential for nanohybrid composites.
Leading Players in the Nanohybrid Composites Market Sector
- ZYVEX TECHNOLOGIES
- Merck KGaA
- Inframat Corporation
- Kerr Corporation
- 3M
- BASF SE
- TAIHO Corporation
- Jiangsu Cnano Technology Co
- EPG AG
- RTP Company
- Akzo Nobel N V
- Nanocyl S A
- Foster Corporation
- PlasmaChem GmbH
- SHOWA DENKO K K
- Powdermet Inc
Key Milestones in Nanohybrid Composites Market Industry
- 2020: Merck KGaA launches a new line of high-performance nanohybrid composites for the automotive industry.
- 2021: 3M announces a strategic partnership with a leading nanomaterial supplier to expand its product portfolio.
- 2022: BASF SE invests in a new manufacturing facility for nanohybrid composites.
- 2023: Several M&A activities are recorded within the market, indicating consolidation.
- 2024: New regulations impacting nanomaterial safety are implemented in key markets.
Strategic Outlook for Nanohybrid Composites Market Market
The Nanohybrid Composites market presents a promising outlook for future growth, driven by technological advancements, expanding applications, and increasing demand for high-performance materials. Strategic opportunities include focusing on developing sustainable and eco-friendly materials, expanding into new and emerging markets, and forming strategic partnerships to enhance market reach and product innovation. Continuous R&D and investment in advanced manufacturing capabilities will be crucial for success in this dynamic market.
Nanohybrid Composites Market Segmentation
-
1. Material Type
- 1.1. Silica (SiO2)
- 1.2. Titanium dioxide (TiO2)
- 1.3. Zirconia (ZrO2)
- 1.4. Carbons
- 1.5. Metals
-
2. Application
- 2.1. Dental Materials
- 2.2. Electrical and Electronics
- 2.3. Paints and Coatings
- 2.4. Other Applications
Nanohybrid Composites Market Segmentation By Geography
-
1. Asia Pacific
- 1.1. China
- 1.2. India
- 1.3. Japan
- 1.4. South Korea
- 1.5. Rest of Asia Pacific
-
2. North America
- 2.1. United States
- 2.2. Canada
- 2.3. Mexico
-
3. Europe
- 3.1. Germany
- 3.2. United Kingdom
- 3.3. Italy
- 3.4. France
- 3.5. Rest of Europe
-
4. Rest of the World
- 4.1. South America
- 4.2. Middle East and Africa
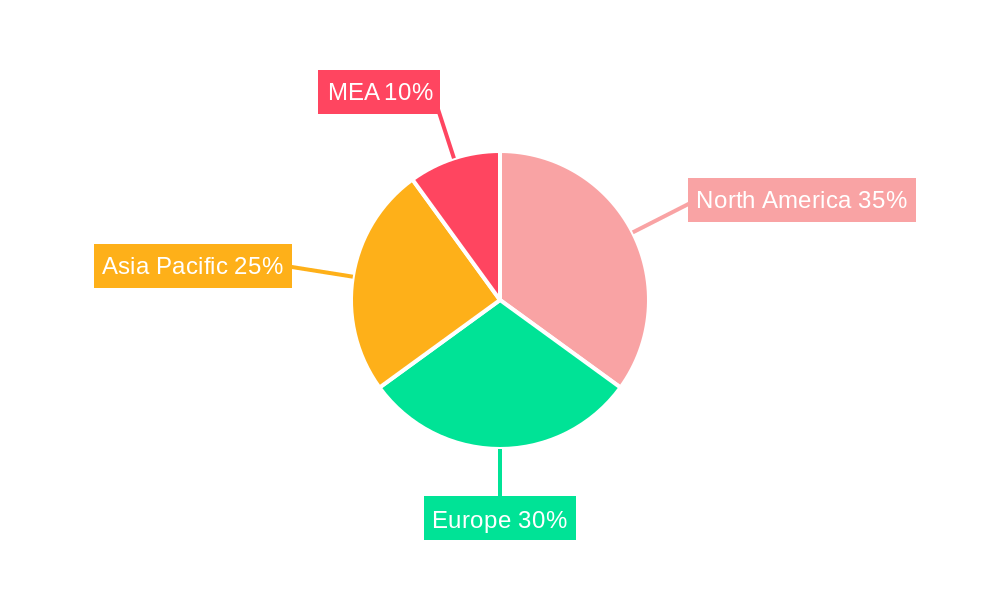
Nanohybrid Composites Market Regional Market Share
Geographic Coverage of Nanohybrid Composites Market
Nanohybrid Composites Market REPORT HIGHLIGHTS
| Aspects | Details |
|---|---|
| Study Period | 2020-2034 |
| Base Year | 2025 |
| Estimated Year | 2026 |
| Forecast Period | 2026-2034 |
| Historical Period | 2020-2025 |
| Growth Rate | CAGR of > 10.00% from 2020-2034 |
| Segmentation |
|
Table of Contents
- 1. Introduction
- 1.1. Research Scope
- 1.2. Market Segmentation
- 1.3. Research Methodology
- 1.4. Definitions and Assumptions
- 2. Executive Summary
- 2.1. Introduction
- 3. Market Dynamics
- 3.1. Introduction
- 3.2. Market Drivers
- 3.2.1. Growing Usage of Nanohybrid Composites in the Dental Industry; Other Drivers
- 3.3. Market Restrains
- 3.3.1. Substitutions like Nano-filled Composites
- 3.4. Market Trends
- 3.4.1. Progressive Usage of Dental Materials Rises the Demand for the Market
- 4. Market Factor Analysis
- 4.1. Porters Five Forces
- 4.2. Supply/Value Chain
- 4.3. PESTEL analysis
- 4.4. Market Entropy
- 4.5. Patent/Trademark Analysis
- 5. Global Nanohybrid Composites Market Analysis, Insights and Forecast, 2020-2032
- 5.1. Market Analysis, Insights and Forecast - by Material Type
- 5.1.1. Silica (SiO2)
- 5.1.2. Titanium dioxide (TiO2)
- 5.1.3. Zirconia (ZrO2)
- 5.1.4. Carbons
- 5.1.5. Metals
- 5.2. Market Analysis, Insights and Forecast - by Application
- 5.2.1. Dental Materials
- 5.2.2. Electrical and Electronics
- 5.2.3. Paints and Coatings
- 5.2.4. Other Applications
- 5.3. Market Analysis, Insights and Forecast - by Region
- 5.3.1. Asia Pacific
- 5.3.2. North America
- 5.3.3. Europe
- 5.3.4. Rest of the World
- 5.1. Market Analysis, Insights and Forecast - by Material Type
- 6. Asia Pacific Nanohybrid Composites Market Analysis, Insights and Forecast, 2020-2032
- 6.1. Market Analysis, Insights and Forecast - by Material Type
- 6.1.1. Silica (SiO2)
- 6.1.2. Titanium dioxide (TiO2)
- 6.1.3. Zirconia (ZrO2)
- 6.1.4. Carbons
- 6.1.5. Metals
- 6.2. Market Analysis, Insights and Forecast - by Application
- 6.2.1. Dental Materials
- 6.2.2. Electrical and Electronics
- 6.2.3. Paints and Coatings
- 6.2.4. Other Applications
- 6.1. Market Analysis, Insights and Forecast - by Material Type
- 7. North America Nanohybrid Composites Market Analysis, Insights and Forecast, 2020-2032
- 7.1. Market Analysis, Insights and Forecast - by Material Type
- 7.1.1. Silica (SiO2)
- 7.1.2. Titanium dioxide (TiO2)
- 7.1.3. Zirconia (ZrO2)
- 7.1.4. Carbons
- 7.1.5. Metals
- 7.2. Market Analysis, Insights and Forecast - by Application
- 7.2.1. Dental Materials
- 7.2.2. Electrical and Electronics
- 7.2.3. Paints and Coatings
- 7.2.4. Other Applications
- 7.1. Market Analysis, Insights and Forecast - by Material Type
- 8. Europe Nanohybrid Composites Market Analysis, Insights and Forecast, 2020-2032
- 8.1. Market Analysis, Insights and Forecast - by Material Type
- 8.1.1. Silica (SiO2)
- 8.1.2. Titanium dioxide (TiO2)
- 8.1.3. Zirconia (ZrO2)
- 8.1.4. Carbons
- 8.1.5. Metals
- 8.2. Market Analysis, Insights and Forecast - by Application
- 8.2.1. Dental Materials
- 8.2.2. Electrical and Electronics
- 8.2.3. Paints and Coatings
- 8.2.4. Other Applications
- 8.1. Market Analysis, Insights and Forecast - by Material Type
- 9. Rest of the World Nanohybrid Composites Market Analysis, Insights and Forecast, 2020-2032
- 9.1. Market Analysis, Insights and Forecast - by Material Type
- 9.1.1. Silica (SiO2)
- 9.1.2. Titanium dioxide (TiO2)
- 9.1.3. Zirconia (ZrO2)
- 9.1.4. Carbons
- 9.1.5. Metals
- 9.2. Market Analysis, Insights and Forecast - by Application
- 9.2.1. Dental Materials
- 9.2.2. Electrical and Electronics
- 9.2.3. Paints and Coatings
- 9.2.4. Other Applications
- 9.1. Market Analysis, Insights and Forecast - by Material Type
- 10. Competitive Analysis
- 10.1. Global Market Share Analysis 2025
- 10.2. Company Profiles
- 10.2.1 ZYVEX TECHNOLOGIES*List Not Exhaustive
- 10.2.1.1. Overview
- 10.2.1.2. Products
- 10.2.1.3. SWOT Analysis
- 10.2.1.4. Recent Developments
- 10.2.1.5. Financials (Based on Availability)
- 10.2.2 Merck KGaA
- 10.2.2.1. Overview
- 10.2.2.2. Products
- 10.2.2.3. SWOT Analysis
- 10.2.2.4. Recent Developments
- 10.2.2.5. Financials (Based on Availability)
- 10.2.3 Inframat Corporation
- 10.2.3.1. Overview
- 10.2.3.2. Products
- 10.2.3.3. SWOT Analysis
- 10.2.3.4. Recent Developments
- 10.2.3.5. Financials (Based on Availability)
- 10.2.4 Kerr Corporation
- 10.2.4.1. Overview
- 10.2.4.2. Products
- 10.2.4.3. SWOT Analysis
- 10.2.4.4. Recent Developments
- 10.2.4.5. Financials (Based on Availability)
- 10.2.5 3M
- 10.2.5.1. Overview
- 10.2.5.2. Products
- 10.2.5.3. SWOT Analysis
- 10.2.5.4. Recent Developments
- 10.2.5.5. Financials (Based on Availability)
- 10.2.6 BASF SE
- 10.2.6.1. Overview
- 10.2.6.2. Products
- 10.2.6.3. SWOT Analysis
- 10.2.6.4. Recent Developments
- 10.2.6.5. Financials (Based on Availability)
- 10.2.7 TAIHO Corporation
- 10.2.7.1. Overview
- 10.2.7.2. Products
- 10.2.7.3. SWOT Analysis
- 10.2.7.4. Recent Developments
- 10.2.7.5. Financials (Based on Availability)
- 10.2.8 Jiangsu Cnano Technology Co
- 10.2.8.1. Overview
- 10.2.8.2. Products
- 10.2.8.3. SWOT Analysis
- 10.2.8.4. Recent Developments
- 10.2.8.5. Financials (Based on Availability)
- 10.2.9 EPG AG
- 10.2.9.1. Overview
- 10.2.9.2. Products
- 10.2.9.3. SWOT Analysis
- 10.2.9.4. Recent Developments
- 10.2.9.5. Financials (Based on Availability)
- 10.2.10 RTP Company
- 10.2.10.1. Overview
- 10.2.10.2. Products
- 10.2.10.3. SWOT Analysis
- 10.2.10.4. Recent Developments
- 10.2.10.5. Financials (Based on Availability)
- 10.2.11 Akzo Nobel N V
- 10.2.11.1. Overview
- 10.2.11.2. Products
- 10.2.11.3. SWOT Analysis
- 10.2.11.4. Recent Developments
- 10.2.11.5. Financials (Based on Availability)
- 10.2.12 Nanocyl S A
- 10.2.12.1. Overview
- 10.2.12.2. Products
- 10.2.12.3. SWOT Analysis
- 10.2.12.4. Recent Developments
- 10.2.12.5. Financials (Based on Availability)
- 10.2.13 Foster Corporation
- 10.2.13.1. Overview
- 10.2.13.2. Products
- 10.2.13.3. SWOT Analysis
- 10.2.13.4. Recent Developments
- 10.2.13.5. Financials (Based on Availability)
- 10.2.14 PlasmaChem GmbH
- 10.2.14.1. Overview
- 10.2.14.2. Products
- 10.2.14.3. SWOT Analysis
- 10.2.14.4. Recent Developments
- 10.2.14.5. Financials (Based on Availability)
- 10.2.15 SHOWA DENKO K K
- 10.2.15.1. Overview
- 10.2.15.2. Products
- 10.2.15.3. SWOT Analysis
- 10.2.15.4. Recent Developments
- 10.2.15.5. Financials (Based on Availability)
- 10.2.16 Powdermet Inc
- 10.2.16.1. Overview
- 10.2.16.2. Products
- 10.2.16.3. SWOT Analysis
- 10.2.16.4. Recent Developments
- 10.2.16.5. Financials (Based on Availability)
- 10.2.1 ZYVEX TECHNOLOGIES*List Not Exhaustive
List of Figures
- Figure 1: Global Nanohybrid Composites Market Revenue Breakdown (Million, %) by Region 2025 & 2033
- Figure 2: Asia Pacific Nanohybrid Composites Market Revenue (Million), by Material Type 2025 & 2033
- Figure 3: Asia Pacific Nanohybrid Composites Market Revenue Share (%), by Material Type 2025 & 2033
- Figure 4: Asia Pacific Nanohybrid Composites Market Revenue (Million), by Application 2025 & 2033
- Figure 5: Asia Pacific Nanohybrid Composites Market Revenue Share (%), by Application 2025 & 2033
- Figure 6: Asia Pacific Nanohybrid Composites Market Revenue (Million), by Country 2025 & 2033
- Figure 7: Asia Pacific Nanohybrid Composites Market Revenue Share (%), by Country 2025 & 2033
- Figure 8: North America Nanohybrid Composites Market Revenue (Million), by Material Type 2025 & 2033
- Figure 9: North America Nanohybrid Composites Market Revenue Share (%), by Material Type 2025 & 2033
- Figure 10: North America Nanohybrid Composites Market Revenue (Million), by Application 2025 & 2033
- Figure 11: North America Nanohybrid Composites Market Revenue Share (%), by Application 2025 & 2033
- Figure 12: North America Nanohybrid Composites Market Revenue (Million), by Country 2025 & 2033
- Figure 13: North America Nanohybrid Composites Market Revenue Share (%), by Country 2025 & 2033
- Figure 14: Europe Nanohybrid Composites Market Revenue (Million), by Material Type 2025 & 2033
- Figure 15: Europe Nanohybrid Composites Market Revenue Share (%), by Material Type 2025 & 2033
- Figure 16: Europe Nanohybrid Composites Market Revenue (Million), by Application 2025 & 2033
- Figure 17: Europe Nanohybrid Composites Market Revenue Share (%), by Application 2025 & 2033
- Figure 18: Europe Nanohybrid Composites Market Revenue (Million), by Country 2025 & 2033
- Figure 19: Europe Nanohybrid Composites Market Revenue Share (%), by Country 2025 & 2033
- Figure 20: Rest of the World Nanohybrid Composites Market Revenue (Million), by Material Type 2025 & 2033
- Figure 21: Rest of the World Nanohybrid Composites Market Revenue Share (%), by Material Type 2025 & 2033
- Figure 22: Rest of the World Nanohybrid Composites Market Revenue (Million), by Application 2025 & 2033
- Figure 23: Rest of the World Nanohybrid Composites Market Revenue Share (%), by Application 2025 & 2033
- Figure 24: Rest of the World Nanohybrid Composites Market Revenue (Million), by Country 2025 & 2033
- Figure 25: Rest of the World Nanohybrid Composites Market Revenue Share (%), by Country 2025 & 2033
List of Tables
- Table 1: Global Nanohybrid Composites Market Revenue Million Forecast, by Material Type 2020 & 2033
- Table 2: Global Nanohybrid Composites Market Revenue Million Forecast, by Application 2020 & 2033
- Table 3: Global Nanohybrid Composites Market Revenue Million Forecast, by Region 2020 & 2033
- Table 4: Global Nanohybrid Composites Market Revenue Million Forecast, by Material Type 2020 & 2033
- Table 5: Global Nanohybrid Composites Market Revenue Million Forecast, by Application 2020 & 2033
- Table 6: Global Nanohybrid Composites Market Revenue Million Forecast, by Country 2020 & 2033
- Table 7: China Nanohybrid Composites Market Revenue (Million) Forecast, by Application 2020 & 2033
- Table 8: India Nanohybrid Composites Market Revenue (Million) Forecast, by Application 2020 & 2033
- Table 9: Japan Nanohybrid Composites Market Revenue (Million) Forecast, by Application 2020 & 2033
- Table 10: South Korea Nanohybrid Composites Market Revenue (Million) Forecast, by Application 2020 & 2033
- Table 11: Rest of Asia Pacific Nanohybrid Composites Market Revenue (Million) Forecast, by Application 2020 & 2033
- Table 12: Global Nanohybrid Composites Market Revenue Million Forecast, by Material Type 2020 & 2033
- Table 13: Global Nanohybrid Composites Market Revenue Million Forecast, by Application 2020 & 2033
- Table 14: Global Nanohybrid Composites Market Revenue Million Forecast, by Country 2020 & 2033
- Table 15: United States Nanohybrid Composites Market Revenue (Million) Forecast, by Application 2020 & 2033
- Table 16: Canada Nanohybrid Composites Market Revenue (Million) Forecast, by Application 2020 & 2033
- Table 17: Mexico Nanohybrid Composites Market Revenue (Million) Forecast, by Application 2020 & 2033
- Table 18: Global Nanohybrid Composites Market Revenue Million Forecast, by Material Type 2020 & 2033
- Table 19: Global Nanohybrid Composites Market Revenue Million Forecast, by Application 2020 & 2033
- Table 20: Global Nanohybrid Composites Market Revenue Million Forecast, by Country 2020 & 2033
- Table 21: Germany Nanohybrid Composites Market Revenue (Million) Forecast, by Application 2020 & 2033
- Table 22: United Kingdom Nanohybrid Composites Market Revenue (Million) Forecast, by Application 2020 & 2033
- Table 23: Italy Nanohybrid Composites Market Revenue (Million) Forecast, by Application 2020 & 2033
- Table 24: France Nanohybrid Composites Market Revenue (Million) Forecast, by Application 2020 & 2033
- Table 25: Rest of Europe Nanohybrid Composites Market Revenue (Million) Forecast, by Application 2020 & 2033
- Table 26: Global Nanohybrid Composites Market Revenue Million Forecast, by Material Type 2020 & 2033
- Table 27: Global Nanohybrid Composites Market Revenue Million Forecast, by Application 2020 & 2033
- Table 28: Global Nanohybrid Composites Market Revenue Million Forecast, by Country 2020 & 2033
- Table 29: South America Nanohybrid Composites Market Revenue (Million) Forecast, by Application 2020 & 2033
- Table 30: Middle East and Africa Nanohybrid Composites Market Revenue (Million) Forecast, by Application 2020 & 2033
Frequently Asked Questions
1. What is the projected Compound Annual Growth Rate (CAGR) of the Nanohybrid Composites Market?
The projected CAGR is approximately > 10.00%.
2. Which companies are prominent players in the Nanohybrid Composites Market?
Key companies in the market include ZYVEX TECHNOLOGIES*List Not Exhaustive, Merck KGaA, Inframat Corporation, Kerr Corporation, 3M, BASF SE, TAIHO Corporation, Jiangsu Cnano Technology Co, EPG AG, RTP Company, Akzo Nobel N V, Nanocyl S A, Foster Corporation, PlasmaChem GmbH, SHOWA DENKO K K, Powdermet Inc.
3. What are the main segments of the Nanohybrid Composites Market?
The market segments include Material Type, Application.
4. Can you provide details about the market size?
The market size is estimated to be USD XX Million as of 2022.
5. What are some drivers contributing to market growth?
Growing Usage of Nanohybrid Composites in the Dental Industry; Other Drivers.
6. What are the notable trends driving market growth?
Progressive Usage of Dental Materials Rises the Demand for the Market.
7. Are there any restraints impacting market growth?
Substitutions like Nano-filled Composites.
8. Can you provide examples of recent developments in the market?
N/A
9. What pricing options are available for accessing the report?
Pricing options include single-user, multi-user, and enterprise licenses priced at USD 4750, USD 5250, and USD 8750 respectively.
10. Is the market size provided in terms of value or volume?
The market size is provided in terms of value, measured in Million.
11. Are there any specific market keywords associated with the report?
Yes, the market keyword associated with the report is "Nanohybrid Composites Market," which aids in identifying and referencing the specific market segment covered.
12. How do I determine which pricing option suits my needs best?
The pricing options vary based on user requirements and access needs. Individual users may opt for single-user licenses, while businesses requiring broader access may choose multi-user or enterprise licenses for cost-effective access to the report.
13. Are there any additional resources or data provided in the Nanohybrid Composites Market report?
While the report offers comprehensive insights, it's advisable to review the specific contents or supplementary materials provided to ascertain if additional resources or data are available.
14. How can I stay updated on further developments or reports in the Nanohybrid Composites Market?
To stay informed about further developments, trends, and reports in the Nanohybrid Composites Market, consider subscribing to industry newsletters, following relevant companies and organizations, or regularly checking reputable industry news sources and publications.
Methodology
Step 1 - Identification of Relevant Samples Size from Population Database


Step 2 - Approaches for Defining Global Market Size (Value, Volume* & Price*)

Note*: In applicable scenarios
Step 3 - Data Sources
Primary Research
- Web Analytics
- Survey Reports
- Research Institute
- Latest Research Reports
- Opinion Leaders
Secondary Research
- Annual Reports
- White Paper
- Latest Press Release
- Industry Association
- Paid Database
- Investor Presentations

Step 4 - Data Triangulation
Involves using different sources of information in order to increase the validity of a study
These sources are likely to be stakeholders in a program - participants, other researchers, program staff, other community members, and so on.
Then we put all data in single framework & apply various statistical tools to find out the dynamic on the market.
During the analysis stage, feedback from the stakeholder groups would be compared to determine areas of agreement as well as areas of divergence