

Key Insights
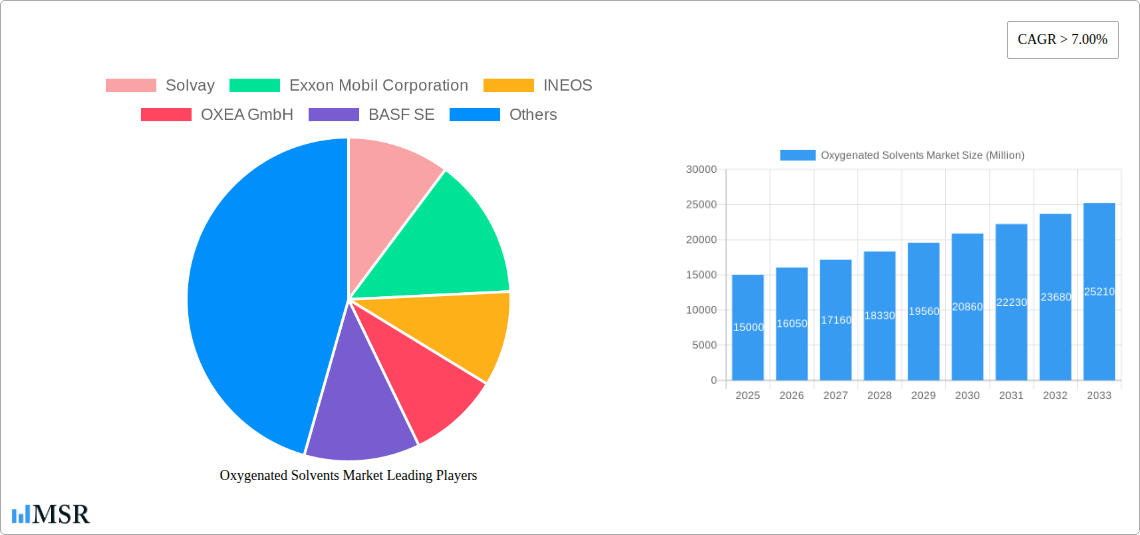
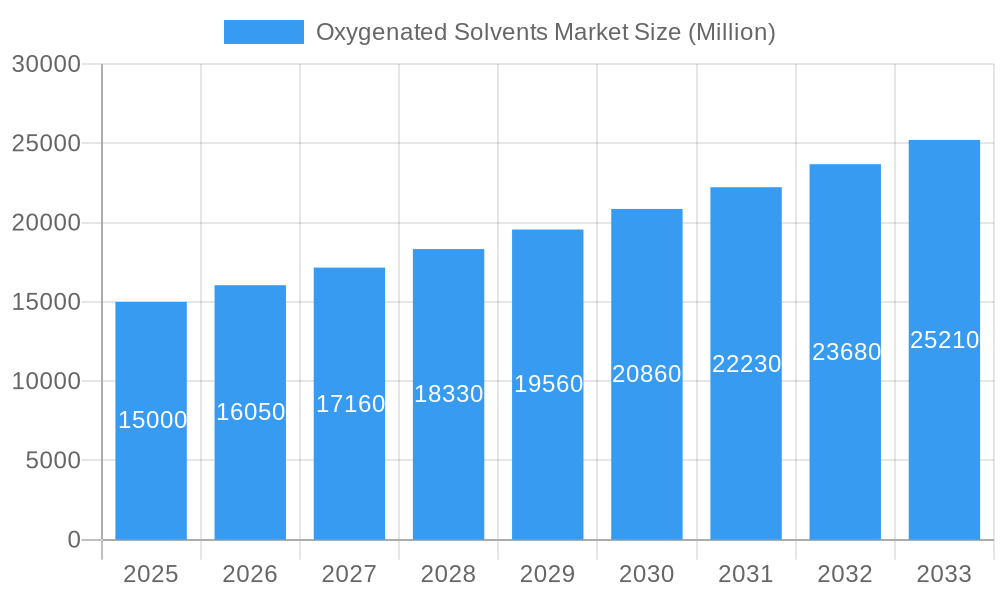
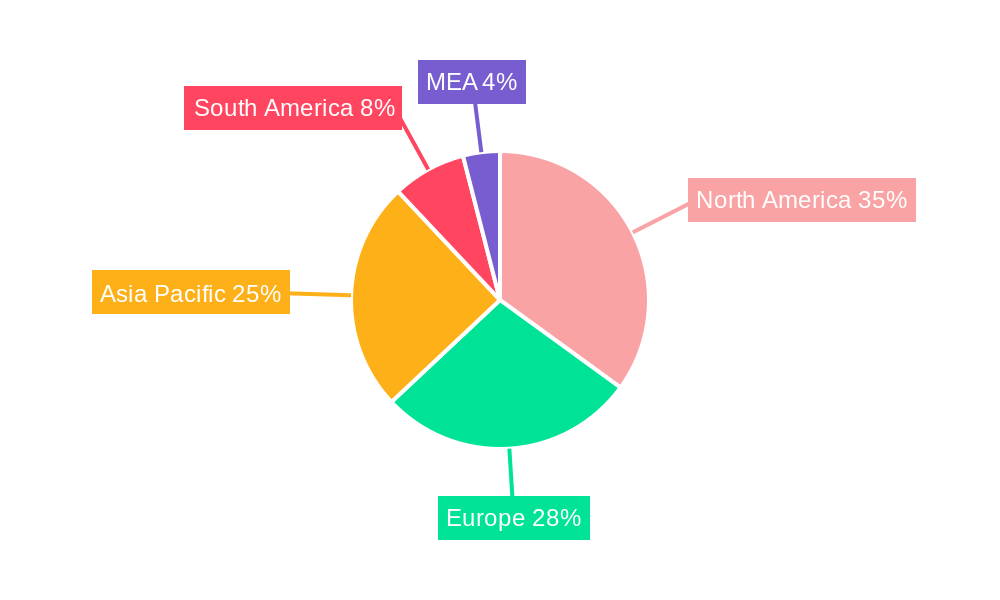
The global oxygenated solvents market is experiencing robust growth, projected to maintain a Compound Annual Growth Rate (CAGR) exceeding 7% from 2025 to 2033. This expansion is driven by several key factors. The increasing demand from the paints and coatings industry, fueled by construction and infrastructure development globally, constitutes a significant market driver. The pharmaceutical sector's reliance on oxygenated solvents as critical components in drug manufacturing and formulation also contributes substantially to market growth. Furthermore, the expanding cosmetics and personal care industry, with its focus on innovative formulations, is creating a growing demand for these solvents. The rise of environmentally friendly and sustainable solvent alternatives within the cleaning products sector is simultaneously impacting market segmentation. While regulatory pressures related to volatile organic compound (VOC) emissions present a restraint, the development of less-harmful, high-performance oxygenated solvents is mitigating this challenge and opening new avenues for market expansion. Regional growth patterns are diverse, with North America and Asia-Pacific currently dominating the market due to robust industrial activities and substantial consumer spending in these regions. Europe remains a significant player, benefiting from its well-established chemical industry and stringent environmental regulations that are driving innovation. The competitive landscape is characterized by the presence of several major players, including Solvay, ExxonMobil, INEOS, OXEA, BASF, Shell, Arkema, Dow, and Eastman Chemical, each vying for market share through product innovation and strategic partnerships.
Oxygenated Solvents Market Market Size (In Billion)
The market segmentation by type (alcohols, ketones, glycols, esters, and others) reveals that alcohols and esters currently hold significant market shares due to their widespread applications across various industries. However, the rising demand for bio-based and biodegradable solvents is propelling the growth of alternative types. Similarly, the application-based segmentation highlights the dominant role of paints and coatings, followed by the pharmaceutical and cleaning products sectors. Future growth is anticipated to be driven by advancements in technology leading to the development of high-performance, specialized oxygenated solvents tailored for specific applications. This will lead to further diversification within the market segments and present opportunities for both established players and emerging market entrants. The continued focus on sustainability and environmental regulations will necessitate continuous innovation to meet evolving market demands and ensure long-term market viability.
Oxygenated Solvents Market Company Market Share
Oxygenated Solvents Market Report: 2019-2033 Forecast
This comprehensive report provides an in-depth analysis of the global Oxygenated Solvents Market, offering invaluable insights for stakeholders seeking to navigate this dynamic sector. The study covers the period 2019-2033, with a base year of 2025 and a forecast period of 2025-2033, providing a detailed historical perspective (2019-2024) and future projections. The market is segmented by type (Alcohols, Ketones, Glycols, Esters, Other Types) and application (Paints and Coatings, Pharmaceuticals, Cleaning Products, Cosmetics, Agriculture, Other Applications), highlighting key trends and growth opportunities. Leading players such as Solvay, Exxon Mobil Corporation, INEOS, OXEA GmbH, BASF SE, Royal Dutch Shell Plc, Arkema Group, Dow, and Eastman Chemical Company are profiled, offering a competitive landscape analysis. The report's detailed market sizing and CAGR projections, coupled with expert analysis, make it an essential resource for strategic decision-making.
Oxygenated Solvents Market Market Concentration & Dynamics
The Oxygenated Solvents market exhibits a moderately concentrated landscape, with a few major players holding significant market share. The top five companies account for approximately xx% of the global market in 2025. Market concentration is influenced by factors such as economies of scale, technological advancements, and access to raw materials. The industry is characterized by ongoing innovation, particularly in the development of sustainable and environmentally friendly solvents. Regulatory frameworks, particularly those focused on environmental protection and worker safety, play a crucial role in shaping market dynamics. The presence of substitute products, such as water-based solvents, poses a competitive challenge, although the unique properties of oxygenated solvents often maintain demand in specialized applications. End-user trends, particularly the growing demand for sustainable products across various sectors, are significantly impacting market growth. M&A activity in the sector has been moderate in recent years, with approximately xx deals recorded between 2019 and 2024. These activities often involve companies seeking to expand their product portfolios, access new technologies, or gain a larger market share.
Oxygenated Solvents Market Industry Insights & Trends
The global Oxygenated Solvents market is poised for significant growth, with a projected CAGR of xx% during the forecast period (2025-2033). The market size is estimated at $xx Million in 2025 and is expected to reach $xx Million by 2033. Several key factors are driving this expansion. The growing demand for paints and coatings, especially in the construction and automotive industries, is a major contributor. Similarly, the increasing consumption of oxygenated solvents in the pharmaceutical and cosmetic sectors is fueling market growth. Technological advancements in solvent synthesis and purification processes are enhancing product quality and efficiency. Changing consumer preferences, with an increasing focus on environmentally friendly and sustainable products, are also impacting market trends. However, the industry faces challenges such as fluctuating raw material prices and stringent environmental regulations. These factors necessitate innovative solutions and strategic adaptations by market players.
Key Markets & Segments Leading Oxygenated Solvents Market
The dominant region for oxygenated solvents in 2025 is Asia-Pacific, driven by robust economic growth and significant infrastructure development in countries like China and India. Within the types segment, Alcohols hold the largest market share, followed by Esters and Ketones. The Paints and Coatings application segment dominates the overall market, reflecting the extensive use of oxygenated solvents in this industry.
Key Drivers by Segment:
- Alcohols: High demand from the pharmaceutical and cleaning products industries.
- Esters: Growing use in the paints and coatings sector due to their excellent solvency properties.
- Ketones: Application in specialized cleaning products and coatings.
- Paints and Coatings: Expansion of the construction and automotive industries.
- Pharmaceuticals: Stringent quality requirements driving demand for high-purity solvents.
- Cleaning Products: Increasing demand for effective and safe cleaning solutions.
Dominance Analysis: Asia-Pacific's dominance stems from rapid industrialization and urbanization, leading to increased demand across various end-use sectors. The Alcohols segment's leadership is attributed to its versatile nature and wide-ranging applications, particularly in the pharmaceutical industry. The strong performance of the Paints and Coatings application segment is driven by its importance in various industries such as construction, automotive, and furniture.
Oxygenated Solvents Market Product Developments
Recent years have witnessed significant advancements in oxygenated solvent technology, focusing on enhanced sustainability and performance. Manufacturers are developing bio-based solvents derived from renewable sources to reduce reliance on petroleum-based raw materials. Innovations in solvent purification techniques have resulted in higher-purity solvents, better suited for demanding applications in pharmaceuticals and electronics. The development of solvents with improved solvency properties and reduced environmental impact is giving manufacturers a competitive edge. These advancements enhance the overall value proposition of oxygenated solvents, particularly in markets with stringent environmental regulations.
Challenges in the Oxygenated Solvents Market Market
The Oxygenated Solvents market faces several challenges. Stringent environmental regulations related to volatile organic compound (VOC) emissions impose constraints on the use of certain solvents. Fluctuations in raw material prices impact profitability and create market volatility. Intense competition among established players and the emergence of new entrants increase pressure on pricing and margins. Supply chain disruptions, particularly those related to raw material sourcing and transportation, can also affect market stability. These challenges necessitate strategic adaptation and continuous innovation to maintain market competitiveness.
Forces Driving Oxygenated Solvents Market Growth
Several factors drive the growth of the Oxygenated Solvents market. Technological advancements, such as the development of sustainable and high-performance solvents, contribute significantly. Economic growth, particularly in developing economies, fuels demand across diverse end-use sectors. Supportive government policies and regulations promoting the use of environmentally friendly solvents also contribute to market expansion. For instance, initiatives focused on reducing VOC emissions are driving the adoption of greener solvents. The rise of the green chemistry movement further emphasizes the need for sustainable solvents.
Challenges in the Oxygenated Solvents Market Market
Long-term growth catalysts include strategic partnerships among manufacturers and end-users to develop specialized solvent solutions. Continuous innovation in solvent technology, focusing on improved performance and sustainability, will be crucial. Expansion into new markets and applications, particularly in emerging economies, will drive long-term growth. The development of bio-based solvents and other sustainable alternatives will enhance the industry's environmental profile and secure long-term market viability.
Emerging Opportunities in Oxygenated Solvents Market
Emerging opportunities lie in the development of bio-based and recycled solvents, aligning with the growing demand for sustainable products. The use of oxygenated solvents in new applications, such as 3D printing and advanced materials, presents further growth potential. The rising demand for high-purity solvents in specialized industries, such as pharmaceuticals and electronics, provides further avenues for market expansion. Tailoring solvent properties for specific applications opens up new market niches and enhances profitability.
Leading Players in the Oxygenated Solvents Market Sector
Key Milestones in Oxygenated Solvents Market Industry
- 2020: Introduction of a new bio-based solvent by Company X.
- 2021: Merger between Company Y and Company Z, expanding their product portfolio.
- 2022: Launch of a new solvent purification technology by Company A.
- 2023: Implementation of stricter environmental regulations in Region B impacting solvent production.
- 2024: Significant investment in R&D by Company C focused on sustainable solvents.
Strategic Outlook for Oxygenated Solvents Market Market
The Oxygenated Solvents market presents a promising outlook for long-term growth. Strategic investments in R&D, focusing on sustainable and high-performance solvents, are crucial. Expanding into new and emerging markets, along with establishing strategic partnerships, are key for securing future market share. Focusing on customer needs and delivering innovative solutions will be essential for success in this dynamic market. The industry's commitment to sustainability and environmental responsibility will further shape its future trajectory.
Oxygenated Solvents Market Segmentation
-
1. Type
- 1.1. Alcohols
- 1.2. Ketones
- 1.3. Glycols
- 1.4. Esters
- 1.5. Other Types
-
2. Application
- 2.1. Paints and Coatings
- 2.2. Pharmaceuticals
- 2.3. Cleaning Products
- 2.4. Cosmetics
- 2.5. Agriculture
- 2.6. Other Applications
Oxygenated Solvents Market Segmentation By Geography
-
1. Asia Pacific
- 1.1. China
- 1.2. India
- 1.3. Japan
- 1.4. South Korea
- 1.5. Rest of Asia Pacific
-
2. North America
- 2.1. United States
- 2.2. Canada
- 2.3. Mexico
-
3. Europe
- 3.1. Germany
- 3.2. United Kingdom
- 3.3. France
- 3.4. Italy
- 3.5. Rest of Europe
-
4. South America
- 4.1. Brazil
- 4.2. Argentina
- 4.3. Rest of South America
- 5. Middle East
-
6. Saudi Arabia
- 6.1. South Africa
- 6.2. Rest of Middle East
Oxygenated Solvents Market Regional Market Share
Geographic Coverage of Oxygenated Solvents Market
Oxygenated Solvents Market REPORT HIGHLIGHTS
| Aspects | Details |
|---|---|
| Study Period | 2020-2034 |
| Base Year | 2025 |
| Estimated Year | 2026 |
| Forecast Period | 2026-2034 |
| Historical Period | 2020-2025 |
| Growth Rate | CAGR of 5% from 2020-2034 |
| Segmentation |
|
Table of Contents
- 1. Introduction
- 1.1. Research Scope
- 1.2. Market Segmentation
- 1.3. Research Methodology
- 1.4. Definitions and Assumptions
- 2. Executive Summary
- 2.1. Introduction
- 3. Market Dynamics
- 3.1. Introduction
- 3.2. Market Drivers
- 3.2.1. ; Growing Applications across Various Industries; Other Drivers
- 3.3. Market Restrains
- 3.3.1. ; Unfavourable Conditions Arising due to the COVID-19 Outbreak; Other Restraints
- 3.4. Market Trends
- 3.4.1. Paints & Coatings Segment to Propel the Demand
- 4. Market Factor Analysis
- 4.1. Porters Five Forces
- 4.2. Supply/Value Chain
- 4.3. PESTEL analysis
- 4.4. Market Entropy
- 4.5. Patent/Trademark Analysis
- 5. Global Oxygenated Solvents Market Analysis, Insights and Forecast, 2020-2032
- 5.1. Market Analysis, Insights and Forecast - by Type
- 5.1.1. Alcohols
- 5.1.2. Ketones
- 5.1.3. Glycols
- 5.1.4. Esters
- 5.1.5. Other Types
- 5.2. Market Analysis, Insights and Forecast - by Application
- 5.2.1. Paints and Coatings
- 5.2.2. Pharmaceuticals
- 5.2.3. Cleaning Products
- 5.2.4. Cosmetics
- 5.2.5. Agriculture
- 5.2.6. Other Applications
- 5.3. Market Analysis, Insights and Forecast - by Region
- 5.3.1. Asia Pacific
- 5.3.2. North America
- 5.3.3. Europe
- 5.3.4. South America
- 5.3.5. Middle East
- 5.3.6. Saudi Arabia
- 5.1. Market Analysis, Insights and Forecast - by Type
- 6. Asia Pacific Oxygenated Solvents Market Analysis, Insights and Forecast, 2020-2032
- 6.1. Market Analysis, Insights and Forecast - by Type
- 6.1.1. Alcohols
- 6.1.2. Ketones
- 6.1.3. Glycols
- 6.1.4. Esters
- 6.1.5. Other Types
- 6.2. Market Analysis, Insights and Forecast - by Application
- 6.2.1. Paints and Coatings
- 6.2.2. Pharmaceuticals
- 6.2.3. Cleaning Products
- 6.2.4. Cosmetics
- 6.2.5. Agriculture
- 6.2.6. Other Applications
- 6.1. Market Analysis, Insights and Forecast - by Type
- 7. North America Oxygenated Solvents Market Analysis, Insights and Forecast, 2020-2032
- 7.1. Market Analysis, Insights and Forecast - by Type
- 7.1.1. Alcohols
- 7.1.2. Ketones
- 7.1.3. Glycols
- 7.1.4. Esters
- 7.1.5. Other Types
- 7.2. Market Analysis, Insights and Forecast - by Application
- 7.2.1. Paints and Coatings
- 7.2.2. Pharmaceuticals
- 7.2.3. Cleaning Products
- 7.2.4. Cosmetics
- 7.2.5. Agriculture
- 7.2.6. Other Applications
- 7.1. Market Analysis, Insights and Forecast - by Type
- 8. Europe Oxygenated Solvents Market Analysis, Insights and Forecast, 2020-2032
- 8.1. Market Analysis, Insights and Forecast - by Type
- 8.1.1. Alcohols
- 8.1.2. Ketones
- 8.1.3. Glycols
- 8.1.4. Esters
- 8.1.5. Other Types
- 8.2. Market Analysis, Insights and Forecast - by Application
- 8.2.1. Paints and Coatings
- 8.2.2. Pharmaceuticals
- 8.2.3. Cleaning Products
- 8.2.4. Cosmetics
- 8.2.5. Agriculture
- 8.2.6. Other Applications
- 8.1. Market Analysis, Insights and Forecast - by Type
- 9. South America Oxygenated Solvents Market Analysis, Insights and Forecast, 2020-2032
- 9.1. Market Analysis, Insights and Forecast - by Type
- 9.1.1. Alcohols
- 9.1.2. Ketones
- 9.1.3. Glycols
- 9.1.4. Esters
- 9.1.5. Other Types
- 9.2. Market Analysis, Insights and Forecast - by Application
- 9.2.1. Paints and Coatings
- 9.2.2. Pharmaceuticals
- 9.2.3. Cleaning Products
- 9.2.4. Cosmetics
- 9.2.5. Agriculture
- 9.2.6. Other Applications
- 9.1. Market Analysis, Insights and Forecast - by Type
- 10. Middle East Oxygenated Solvents Market Analysis, Insights and Forecast, 2020-2032
- 10.1. Market Analysis, Insights and Forecast - by Type
- 10.1.1. Alcohols
- 10.1.2. Ketones
- 10.1.3. Glycols
- 10.1.4. Esters
- 10.1.5. Other Types
- 10.2. Market Analysis, Insights and Forecast - by Application
- 10.2.1. Paints and Coatings
- 10.2.2. Pharmaceuticals
- 10.2.3. Cleaning Products
- 10.2.4. Cosmetics
- 10.2.5. Agriculture
- 10.2.6. Other Applications
- 10.1. Market Analysis, Insights and Forecast - by Type
- 11. Saudi Arabia Oxygenated Solvents Market Analysis, Insights and Forecast, 2020-2032
- 11.1. Market Analysis, Insights and Forecast - by Type
- 11.1.1. Alcohols
- 11.1.2. Ketones
- 11.1.3. Glycols
- 11.1.4. Esters
- 11.1.5. Other Types
- 11.2. Market Analysis, Insights and Forecast - by Application
- 11.2.1. Paints and Coatings
- 11.2.2. Pharmaceuticals
- 11.2.3. Cleaning Products
- 11.2.4. Cosmetics
- 11.2.5. Agriculture
- 11.2.6. Other Applications
- 11.1. Market Analysis, Insights and Forecast - by Type
- 12. Competitive Analysis
- 12.1. Global Market Share Analysis 2025
- 12.2. Company Profiles
- 12.2.1 Solvay
- 12.2.1.1. Overview
- 12.2.1.2. Products
- 12.2.1.3. SWOT Analysis
- 12.2.1.4. Recent Developments
- 12.2.1.5. Financials (Based on Availability)
- 12.2.2 Exxon Mobil Corporation
- 12.2.2.1. Overview
- 12.2.2.2. Products
- 12.2.2.3. SWOT Analysis
- 12.2.2.4. Recent Developments
- 12.2.2.5. Financials (Based on Availability)
- 12.2.3 INEOS
- 12.2.3.1. Overview
- 12.2.3.2. Products
- 12.2.3.3. SWOT Analysis
- 12.2.3.4. Recent Developments
- 12.2.3.5. Financials (Based on Availability)
- 12.2.4 OXEA GmbH
- 12.2.4.1. Overview
- 12.2.4.2. Products
- 12.2.4.3. SWOT Analysis
- 12.2.4.4. Recent Developments
- 12.2.4.5. Financials (Based on Availability)
- 12.2.5 BASF SE
- 12.2.5.1. Overview
- 12.2.5.2. Products
- 12.2.5.3. SWOT Analysis
- 12.2.5.4. Recent Developments
- 12.2.5.5. Financials (Based on Availability)
- 12.2.6 Royal Dutch Shell Plc
- 12.2.6.1. Overview
- 12.2.6.2. Products
- 12.2.6.3. SWOT Analysis
- 12.2.6.4. Recent Developments
- 12.2.6.5. Financials (Based on Availability)
- 12.2.7 Arkema Group
- 12.2.7.1. Overview
- 12.2.7.2. Products
- 12.2.7.3. SWOT Analysis
- 12.2.7.4. Recent Developments
- 12.2.7.5. Financials (Based on Availability)
- 12.2.8 Dow
- 12.2.8.1. Overview
- 12.2.8.2. Products
- 12.2.8.3. SWOT Analysis
- 12.2.8.4. Recent Developments
- 12.2.8.5. Financials (Based on Availability)
- 12.2.9 Eastman Chemical Company
- 12.2.9.1. Overview
- 12.2.9.2. Products
- 12.2.9.3. SWOT Analysis
- 12.2.9.4. Recent Developments
- 12.2.9.5. Financials (Based on Availability)
- 12.2.1 Solvay
List of Figures
- Figure 1: Global Oxygenated Solvents Market Revenue Breakdown (undefined, %) by Region 2025 & 2033
- Figure 2: Global Oxygenated Solvents Market Volume Breakdown (K Tons, %) by Region 2025 & 2033
- Figure 3: Asia Pacific Oxygenated Solvents Market Revenue (undefined), by Type 2025 & 2033
- Figure 4: Asia Pacific Oxygenated Solvents Market Volume (K Tons), by Type 2025 & 2033
- Figure 5: Asia Pacific Oxygenated Solvents Market Revenue Share (%), by Type 2025 & 2033
- Figure 6: Asia Pacific Oxygenated Solvents Market Volume Share (%), by Type 2025 & 2033
- Figure 7: Asia Pacific Oxygenated Solvents Market Revenue (undefined), by Application 2025 & 2033
- Figure 8: Asia Pacific Oxygenated Solvents Market Volume (K Tons), by Application 2025 & 2033
- Figure 9: Asia Pacific Oxygenated Solvents Market Revenue Share (%), by Application 2025 & 2033
- Figure 10: Asia Pacific Oxygenated Solvents Market Volume Share (%), by Application 2025 & 2033
- Figure 11: Asia Pacific Oxygenated Solvents Market Revenue (undefined), by Country 2025 & 2033
- Figure 12: Asia Pacific Oxygenated Solvents Market Volume (K Tons), by Country 2025 & 2033
- Figure 13: Asia Pacific Oxygenated Solvents Market Revenue Share (%), by Country 2025 & 2033
- Figure 14: Asia Pacific Oxygenated Solvents Market Volume Share (%), by Country 2025 & 2033
- Figure 15: North America Oxygenated Solvents Market Revenue (undefined), by Type 2025 & 2033
- Figure 16: North America Oxygenated Solvents Market Volume (K Tons), by Type 2025 & 2033
- Figure 17: North America Oxygenated Solvents Market Revenue Share (%), by Type 2025 & 2033
- Figure 18: North America Oxygenated Solvents Market Volume Share (%), by Type 2025 & 2033
- Figure 19: North America Oxygenated Solvents Market Revenue (undefined), by Application 2025 & 2033
- Figure 20: North America Oxygenated Solvents Market Volume (K Tons), by Application 2025 & 2033
- Figure 21: North America Oxygenated Solvents Market Revenue Share (%), by Application 2025 & 2033
- Figure 22: North America Oxygenated Solvents Market Volume Share (%), by Application 2025 & 2033
- Figure 23: North America Oxygenated Solvents Market Revenue (undefined), by Country 2025 & 2033
- Figure 24: North America Oxygenated Solvents Market Volume (K Tons), by Country 2025 & 2033
- Figure 25: North America Oxygenated Solvents Market Revenue Share (%), by Country 2025 & 2033
- Figure 26: North America Oxygenated Solvents Market Volume Share (%), by Country 2025 & 2033
- Figure 27: Europe Oxygenated Solvents Market Revenue (undefined), by Type 2025 & 2033
- Figure 28: Europe Oxygenated Solvents Market Volume (K Tons), by Type 2025 & 2033
- Figure 29: Europe Oxygenated Solvents Market Revenue Share (%), by Type 2025 & 2033
- Figure 30: Europe Oxygenated Solvents Market Volume Share (%), by Type 2025 & 2033
- Figure 31: Europe Oxygenated Solvents Market Revenue (undefined), by Application 2025 & 2033
- Figure 32: Europe Oxygenated Solvents Market Volume (K Tons), by Application 2025 & 2033
- Figure 33: Europe Oxygenated Solvents Market Revenue Share (%), by Application 2025 & 2033
- Figure 34: Europe Oxygenated Solvents Market Volume Share (%), by Application 2025 & 2033
- Figure 35: Europe Oxygenated Solvents Market Revenue (undefined), by Country 2025 & 2033
- Figure 36: Europe Oxygenated Solvents Market Volume (K Tons), by Country 2025 & 2033
- Figure 37: Europe Oxygenated Solvents Market Revenue Share (%), by Country 2025 & 2033
- Figure 38: Europe Oxygenated Solvents Market Volume Share (%), by Country 2025 & 2033
- Figure 39: South America Oxygenated Solvents Market Revenue (undefined), by Type 2025 & 2033
- Figure 40: South America Oxygenated Solvents Market Volume (K Tons), by Type 2025 & 2033
- Figure 41: South America Oxygenated Solvents Market Revenue Share (%), by Type 2025 & 2033
- Figure 42: South America Oxygenated Solvents Market Volume Share (%), by Type 2025 & 2033
- Figure 43: South America Oxygenated Solvents Market Revenue (undefined), by Application 2025 & 2033
- Figure 44: South America Oxygenated Solvents Market Volume (K Tons), by Application 2025 & 2033
- Figure 45: South America Oxygenated Solvents Market Revenue Share (%), by Application 2025 & 2033
- Figure 46: South America Oxygenated Solvents Market Volume Share (%), by Application 2025 & 2033
- Figure 47: South America Oxygenated Solvents Market Revenue (undefined), by Country 2025 & 2033
- Figure 48: South America Oxygenated Solvents Market Volume (K Tons), by Country 2025 & 2033
- Figure 49: South America Oxygenated Solvents Market Revenue Share (%), by Country 2025 & 2033
- Figure 50: South America Oxygenated Solvents Market Volume Share (%), by Country 2025 & 2033
- Figure 51: Middle East Oxygenated Solvents Market Revenue (undefined), by Type 2025 & 2033
- Figure 52: Middle East Oxygenated Solvents Market Volume (K Tons), by Type 2025 & 2033
- Figure 53: Middle East Oxygenated Solvents Market Revenue Share (%), by Type 2025 & 2033
- Figure 54: Middle East Oxygenated Solvents Market Volume Share (%), by Type 2025 & 2033
- Figure 55: Middle East Oxygenated Solvents Market Revenue (undefined), by Application 2025 & 2033
- Figure 56: Middle East Oxygenated Solvents Market Volume (K Tons), by Application 2025 & 2033
- Figure 57: Middle East Oxygenated Solvents Market Revenue Share (%), by Application 2025 & 2033
- Figure 58: Middle East Oxygenated Solvents Market Volume Share (%), by Application 2025 & 2033
- Figure 59: Middle East Oxygenated Solvents Market Revenue (undefined), by Country 2025 & 2033
- Figure 60: Middle East Oxygenated Solvents Market Volume (K Tons), by Country 2025 & 2033
- Figure 61: Middle East Oxygenated Solvents Market Revenue Share (%), by Country 2025 & 2033
- Figure 62: Middle East Oxygenated Solvents Market Volume Share (%), by Country 2025 & 2033
- Figure 63: Saudi Arabia Oxygenated Solvents Market Revenue (undefined), by Type 2025 & 2033
- Figure 64: Saudi Arabia Oxygenated Solvents Market Volume (K Tons), by Type 2025 & 2033
- Figure 65: Saudi Arabia Oxygenated Solvents Market Revenue Share (%), by Type 2025 & 2033
- Figure 66: Saudi Arabia Oxygenated Solvents Market Volume Share (%), by Type 2025 & 2033
- Figure 67: Saudi Arabia Oxygenated Solvents Market Revenue (undefined), by Application 2025 & 2033
- Figure 68: Saudi Arabia Oxygenated Solvents Market Volume (K Tons), by Application 2025 & 2033
- Figure 69: Saudi Arabia Oxygenated Solvents Market Revenue Share (%), by Application 2025 & 2033
- Figure 70: Saudi Arabia Oxygenated Solvents Market Volume Share (%), by Application 2025 & 2033
- Figure 71: Saudi Arabia Oxygenated Solvents Market Revenue (undefined), by Country 2025 & 2033
- Figure 72: Saudi Arabia Oxygenated Solvents Market Volume (K Tons), by Country 2025 & 2033
- Figure 73: Saudi Arabia Oxygenated Solvents Market Revenue Share (%), by Country 2025 & 2033
- Figure 74: Saudi Arabia Oxygenated Solvents Market Volume Share (%), by Country 2025 & 2033
List of Tables
- Table 1: Global Oxygenated Solvents Market Revenue undefined Forecast, by Type 2020 & 2033
- Table 2: Global Oxygenated Solvents Market Volume K Tons Forecast, by Type 2020 & 2033
- Table 3: Global Oxygenated Solvents Market Revenue undefined Forecast, by Application 2020 & 2033
- Table 4: Global Oxygenated Solvents Market Volume K Tons Forecast, by Application 2020 & 2033
- Table 5: Global Oxygenated Solvents Market Revenue undefined Forecast, by Region 2020 & 2033
- Table 6: Global Oxygenated Solvents Market Volume K Tons Forecast, by Region 2020 & 2033
- Table 7: Global Oxygenated Solvents Market Revenue undefined Forecast, by Type 2020 & 2033
- Table 8: Global Oxygenated Solvents Market Volume K Tons Forecast, by Type 2020 & 2033
- Table 9: Global Oxygenated Solvents Market Revenue undefined Forecast, by Application 2020 & 2033
- Table 10: Global Oxygenated Solvents Market Volume K Tons Forecast, by Application 2020 & 2033
- Table 11: Global Oxygenated Solvents Market Revenue undefined Forecast, by Country 2020 & 2033
- Table 12: Global Oxygenated Solvents Market Volume K Tons Forecast, by Country 2020 & 2033
- Table 13: China Oxygenated Solvents Market Revenue (undefined) Forecast, by Application 2020 & 2033
- Table 14: China Oxygenated Solvents Market Volume (K Tons) Forecast, by Application 2020 & 2033
- Table 15: India Oxygenated Solvents Market Revenue (undefined) Forecast, by Application 2020 & 2033
- Table 16: India Oxygenated Solvents Market Volume (K Tons) Forecast, by Application 2020 & 2033
- Table 17: Japan Oxygenated Solvents Market Revenue (undefined) Forecast, by Application 2020 & 2033
- Table 18: Japan Oxygenated Solvents Market Volume (K Tons) Forecast, by Application 2020 & 2033
- Table 19: South Korea Oxygenated Solvents Market Revenue (undefined) Forecast, by Application 2020 & 2033
- Table 20: South Korea Oxygenated Solvents Market Volume (K Tons) Forecast, by Application 2020 & 2033
- Table 21: Rest of Asia Pacific Oxygenated Solvents Market Revenue (undefined) Forecast, by Application 2020 & 2033
- Table 22: Rest of Asia Pacific Oxygenated Solvents Market Volume (K Tons) Forecast, by Application 2020 & 2033
- Table 23: Global Oxygenated Solvents Market Revenue undefined Forecast, by Type 2020 & 2033
- Table 24: Global Oxygenated Solvents Market Volume K Tons Forecast, by Type 2020 & 2033
- Table 25: Global Oxygenated Solvents Market Revenue undefined Forecast, by Application 2020 & 2033
- Table 26: Global Oxygenated Solvents Market Volume K Tons Forecast, by Application 2020 & 2033
- Table 27: Global Oxygenated Solvents Market Revenue undefined Forecast, by Country 2020 & 2033
- Table 28: Global Oxygenated Solvents Market Volume K Tons Forecast, by Country 2020 & 2033
- Table 29: United States Oxygenated Solvents Market Revenue (undefined) Forecast, by Application 2020 & 2033
- Table 30: United States Oxygenated Solvents Market Volume (K Tons) Forecast, by Application 2020 & 2033
- Table 31: Canada Oxygenated Solvents Market Revenue (undefined) Forecast, by Application 2020 & 2033
- Table 32: Canada Oxygenated Solvents Market Volume (K Tons) Forecast, by Application 2020 & 2033
- Table 33: Mexico Oxygenated Solvents Market Revenue (undefined) Forecast, by Application 2020 & 2033
- Table 34: Mexico Oxygenated Solvents Market Volume (K Tons) Forecast, by Application 2020 & 2033
- Table 35: Global Oxygenated Solvents Market Revenue undefined Forecast, by Type 2020 & 2033
- Table 36: Global Oxygenated Solvents Market Volume K Tons Forecast, by Type 2020 & 2033
- Table 37: Global Oxygenated Solvents Market Revenue undefined Forecast, by Application 2020 & 2033
- Table 38: Global Oxygenated Solvents Market Volume K Tons Forecast, by Application 2020 & 2033
- Table 39: Global Oxygenated Solvents Market Revenue undefined Forecast, by Country 2020 & 2033
- Table 40: Global Oxygenated Solvents Market Volume K Tons Forecast, by Country 2020 & 2033
- Table 41: Germany Oxygenated Solvents Market Revenue (undefined) Forecast, by Application 2020 & 2033
- Table 42: Germany Oxygenated Solvents Market Volume (K Tons) Forecast, by Application 2020 & 2033
- Table 43: United Kingdom Oxygenated Solvents Market Revenue (undefined) Forecast, by Application 2020 & 2033
- Table 44: United Kingdom Oxygenated Solvents Market Volume (K Tons) Forecast, by Application 2020 & 2033
- Table 45: France Oxygenated Solvents Market Revenue (undefined) Forecast, by Application 2020 & 2033
- Table 46: France Oxygenated Solvents Market Volume (K Tons) Forecast, by Application 2020 & 2033
- Table 47: Italy Oxygenated Solvents Market Revenue (undefined) Forecast, by Application 2020 & 2033
- Table 48: Italy Oxygenated Solvents Market Volume (K Tons) Forecast, by Application 2020 & 2033
- Table 49: Rest of Europe Oxygenated Solvents Market Revenue (undefined) Forecast, by Application 2020 & 2033
- Table 50: Rest of Europe Oxygenated Solvents Market Volume (K Tons) Forecast, by Application 2020 & 2033
- Table 51: Global Oxygenated Solvents Market Revenue undefined Forecast, by Type 2020 & 2033
- Table 52: Global Oxygenated Solvents Market Volume K Tons Forecast, by Type 2020 & 2033
- Table 53: Global Oxygenated Solvents Market Revenue undefined Forecast, by Application 2020 & 2033
- Table 54: Global Oxygenated Solvents Market Volume K Tons Forecast, by Application 2020 & 2033
- Table 55: Global Oxygenated Solvents Market Revenue undefined Forecast, by Country 2020 & 2033
- Table 56: Global Oxygenated Solvents Market Volume K Tons Forecast, by Country 2020 & 2033
- Table 57: Brazil Oxygenated Solvents Market Revenue (undefined) Forecast, by Application 2020 & 2033
- Table 58: Brazil Oxygenated Solvents Market Volume (K Tons) Forecast, by Application 2020 & 2033
- Table 59: Argentina Oxygenated Solvents Market Revenue (undefined) Forecast, by Application 2020 & 2033
- Table 60: Argentina Oxygenated Solvents Market Volume (K Tons) Forecast, by Application 2020 & 2033
- Table 61: Rest of South America Oxygenated Solvents Market Revenue (undefined) Forecast, by Application 2020 & 2033
- Table 62: Rest of South America Oxygenated Solvents Market Volume (K Tons) Forecast, by Application 2020 & 2033
- Table 63: Global Oxygenated Solvents Market Revenue undefined Forecast, by Type 2020 & 2033
- Table 64: Global Oxygenated Solvents Market Volume K Tons Forecast, by Type 2020 & 2033
- Table 65: Global Oxygenated Solvents Market Revenue undefined Forecast, by Application 2020 & 2033
- Table 66: Global Oxygenated Solvents Market Volume K Tons Forecast, by Application 2020 & 2033
- Table 67: Global Oxygenated Solvents Market Revenue undefined Forecast, by Country 2020 & 2033
- Table 68: Global Oxygenated Solvents Market Volume K Tons Forecast, by Country 2020 & 2033
- Table 69: Global Oxygenated Solvents Market Revenue undefined Forecast, by Type 2020 & 2033
- Table 70: Global Oxygenated Solvents Market Volume K Tons Forecast, by Type 2020 & 2033
- Table 71: Global Oxygenated Solvents Market Revenue undefined Forecast, by Application 2020 & 2033
- Table 72: Global Oxygenated Solvents Market Volume K Tons Forecast, by Application 2020 & 2033
- Table 73: Global Oxygenated Solvents Market Revenue undefined Forecast, by Country 2020 & 2033
- Table 74: Global Oxygenated Solvents Market Volume K Tons Forecast, by Country 2020 & 2033
- Table 75: South Africa Oxygenated Solvents Market Revenue (undefined) Forecast, by Application 2020 & 2033
- Table 76: South Africa Oxygenated Solvents Market Volume (K Tons) Forecast, by Application 2020 & 2033
- Table 77: Rest of Middle East Oxygenated Solvents Market Revenue (undefined) Forecast, by Application 2020 & 2033
- Table 78: Rest of Middle East Oxygenated Solvents Market Volume (K Tons) Forecast, by Application 2020 & 2033
Frequently Asked Questions
1. What is the projected Compound Annual Growth Rate (CAGR) of the Oxygenated Solvents Market?
The projected CAGR is approximately 5%.
2. Which companies are prominent players in the Oxygenated Solvents Market?
Key companies in the market include Solvay, Exxon Mobil Corporation, INEOS, OXEA GmbH, BASF SE, Royal Dutch Shell Plc, Arkema Group, Dow, Eastman Chemical Company.
3. What are the main segments of the Oxygenated Solvents Market?
The market segments include Type, Application.
4. Can you provide details about the market size?
The market size is estimated to be USD XXX N/A as of 2022.
5. What are some drivers contributing to market growth?
; Growing Applications across Various Industries; Other Drivers.
6. What are the notable trends driving market growth?
Paints & Coatings Segment to Propel the Demand.
7. Are there any restraints impacting market growth?
; Unfavourable Conditions Arising due to the COVID-19 Outbreak; Other Restraints.
8. Can you provide examples of recent developments in the market?
N/A
9. What pricing options are available for accessing the report?
Pricing options include single-user, multi-user, and enterprise licenses priced at USD 4750, USD 5250, and USD 8750 respectively.
10. Is the market size provided in terms of value or volume?
The market size is provided in terms of value, measured in N/A and volume, measured in K Tons.
11. Are there any specific market keywords associated with the report?
Yes, the market keyword associated with the report is "Oxygenated Solvents Market," which aids in identifying and referencing the specific market segment covered.
12. How do I determine which pricing option suits my needs best?
The pricing options vary based on user requirements and access needs. Individual users may opt for single-user licenses, while businesses requiring broader access may choose multi-user or enterprise licenses for cost-effective access to the report.
13. Are there any additional resources or data provided in the Oxygenated Solvents Market report?
While the report offers comprehensive insights, it's advisable to review the specific contents or supplementary materials provided to ascertain if additional resources or data are available.
14. How can I stay updated on further developments or reports in the Oxygenated Solvents Market?
To stay informed about further developments, trends, and reports in the Oxygenated Solvents Market, consider subscribing to industry newsletters, following relevant companies and organizations, or regularly checking reputable industry news sources and publications.
Methodology
Step 1 - Identification of Relevant Samples Size from Population Database


Step 2 - Approaches for Defining Global Market Size (Value, Volume* & Price*)

Note*: In applicable scenarios
Step 3 - Data Sources
Primary Research
- Web Analytics
- Survey Reports
- Research Institute
- Latest Research Reports
- Opinion Leaders
Secondary Research
- Annual Reports
- White Paper
- Latest Press Release
- Industry Association
- Paid Database
- Investor Presentations

Step 4 - Data Triangulation
Involves using different sources of information in order to increase the validity of a study
These sources are likely to be stakeholders in a program - participants, other researchers, program staff, other community members, and so on.
Then we put all data in single framework & apply various statistical tools to find out the dynamic on the market.
During the analysis stage, feedback from the stakeholder groups would be compared to determine areas of agreement as well as areas of divergence