

Key Insights
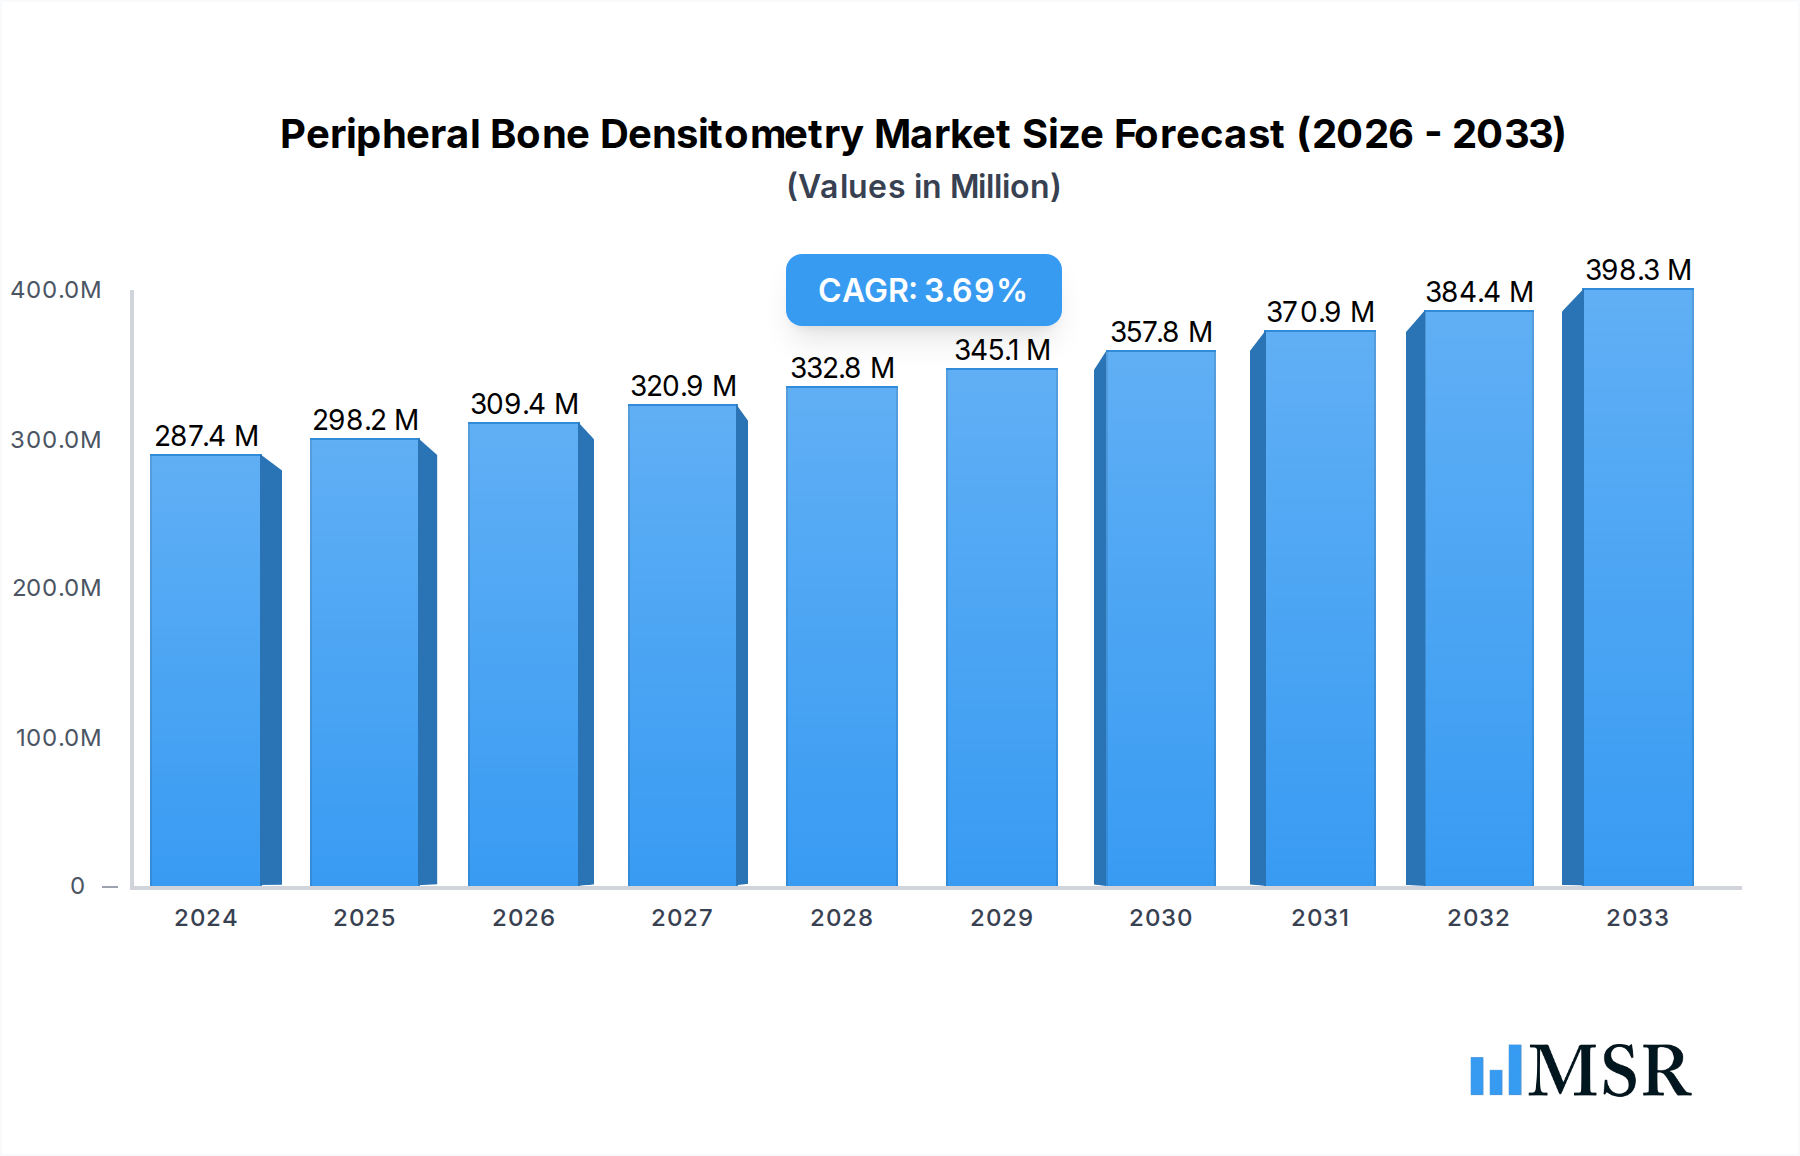
The global Peripheral Bone Densitometry market is experiencing robust growth, projected to reach USD 287.4 million by 2024, with a projected Compound Annual Growth Rate (CAGR) of 4.6% over the forecast period from 2025 to 2033. This expansion is primarily driven by the increasing prevalence of osteoporosis and other bone-related disorders, particularly among aging populations worldwide. Early and accurate diagnosis of these conditions is crucial for effective management and prevention of fractures, thus fueling the demand for advanced bone densitometry technologies. Furthermore, a growing awareness among healthcare professionals and patients about the benefits of early detection, coupled with advancements in imaging technologies leading to more accurate and less invasive diagnostic tools, are significant growth catalysts. The market is also benefiting from increased healthcare expenditure and a growing focus on preventative healthcare measures.

Peripheral Bone Densitometry Market Size (In Million)
The market is segmented across various applications, with Hospitals and Clinics being the dominant segments due to their widespread adoption of diagnostic imaging equipment and established patient care pathways. Technologically, Dual Energy X-Ray Absorptiometry (pDEXA) is expected to maintain a leading position owing to its superior accuracy and widespread clinical acceptance for measuring bone mineral density. However, advancements in Single Energy X-Ray Absorptiometry (SEXA) and Quantitative Ultrasound (QUS) are also contributing to market dynamics, offering more accessible and cost-effective screening options. Geographically, North America and Europe are anticipated to lead the market, driven by high disease prevalence, advanced healthcare infrastructure, and significant investment in medical technology. The Asia Pacific region is poised for substantial growth, fueled by a burgeoning patient population, increasing disposable income, and a growing emphasis on improving diagnostic capabilities.
Peripheral Bone Densitometry Company Market Share
Peripheral Bone Densitometry Market Concentration & Dynamics
The peripheral bone densitometry market exhibits a moderate concentration, with key players like GE Healthcare, BeamMed, and Osteometer MediTech holding significant market shares. The innovation ecosystem is robust, fueled by continuous research and development in imaging technologies and software algorithms, aiming to improve accuracy, speed, and patient comfort. Regulatory frameworks, primarily driven by health and safety standards and device approval processes, play a crucial role in market access and product development timelines. While direct substitutes for comprehensive bone density assessment are limited, advancements in less invasive screening methods and the increasing use of AI-driven diagnostic tools represent potential indirect competition. End-user trends lean towards an increasing demand for early osteoporosis detection, particularly among aging populations and individuals with known risk factors. Mergers and acquisitions (M&A) activities, while not overly frequent, contribute to market consolidation and the expansion of product portfolios. For instance, recent M&A deals have aimed to integrate complementary technologies and broaden geographic reach, with an estimated xx M&A deals observed during the historical period. The market share distribution shows GE Healthcare leading with approximately 25%, followed by BeamMed at 18%, and Diagnostic Medical Systems at 12%, with the remaining share fragmented among smaller players.
Peripheral Bone Densitometry Industry Insights & Trends
The global peripheral bone densitometry market is poised for substantial growth, driven by an increasing prevalence of osteoporosis and osteopenia, particularly in aging demographics worldwide. The estimated market size in 2023 was approximately $350 million, with projections indicating a Compound Annual Growth Rate (CAGR) of xx% during the forecast period of 2025–2033. This growth is significantly propelled by the rising awareness of bone health management and the early detection of osteoporosis, which can prevent debilitating fractures. Technological disruptions are at the forefront of market evolution. Innovations in imaging techniques, such as advanced Dual Energy X-Ray Absorptiometry (pDEXA) systems offering enhanced precision and reduced radiation exposure, are becoming standard. Furthermore, the integration of artificial intelligence (AI) and machine learning (ML) into densitometry software is revolutionizing data analysis, enabling more accurate diagnoses and personalized treatment plans. The development of portable and user-friendly devices is also expanding the reach of bone density testing beyond specialized centers, making it more accessible in clinics and even primary care settings. Evolving consumer behaviors, characterized by a proactive approach to health and wellness, are further fueling demand for preventative screenings. As global healthcare expenditure rises and insurance coverage for bone density testing expands in various regions, market penetration is expected to deepen. The emphasis on value-based healthcare and the need to reduce the long-term economic burden of osteoporotic fractures are also key drivers encouraging the adoption of peripheral bone densitometry technologies.
Key Markets & Segments Leading Peripheral Bone Densitometry
The peripheral bone densitometry market is experiencing significant traction across various regions and application segments. North America currently leads the market, driven by a high prevalence of osteoporosis, robust healthcare infrastructure, and strong government initiatives promoting bone health awareness. The United States, in particular, is a dominant country due to its large aging population and advanced healthcare system, with an estimated xx% of the global market share.
Dominant Applications:
- Hospitals: Hospitals are major consumers of peripheral bone densitometry systems, owing to their comprehensive diagnostic capabilities and the presence of specialized orthopedic and endocrinology departments. The demand is driven by the need for accurate diagnosis and management of osteoporosis in hospitalized patients, including those with existing fractures or high-risk conditions. The market share for hospitals is estimated at xx%.
- Clinics: The increasing focus on outpatient care and preventative health has led to a significant surge in the adoption of peripheral bone densitometry in clinics. These settings benefit from the portability and ease of use of many devices, enabling wider screening programs and early intervention strategies. Clinics represent a growing segment, accounting for an estimated xx% of the market.
- Others: This segment includes specialized diagnostic centers, research institutions, and long-term care facilities. These entities contribute to the market by conducting research, offering specialized diagnostic services, and ensuring bone health management for vulnerable populations. This segment holds an estimated xx% of the market.
Leading Technology Types:
- Dual Energy X-Ray Absorptiometry (pDEXA): pDEXA remains the gold standard for bone density measurement due to its accuracy, reliability, and relatively low radiation dose. Advancements in pDEXA technology, including higher resolution and faster scanning times, continue to drive its dominance. This segment is projected to hold the largest market share, estimated at xx%.
- Quantitative Ultrasound (QUS): QUS offers a non-ionizing, portable, and cost-effective alternative for bone assessment, particularly for fracture risk prediction. Its growing adoption in primary care settings and as a screening tool contributes to its increasing market share, estimated at xx%.
- Single Energy X-Ray Absorptiometry (SEXA): While less common for comprehensive bone density assessment than pDEXA, SEXA finds applications in specific peripheral bone measurements, contributing an estimated xx% to the market.
- Peripheral Quantitative Computed Tomography (pQCT): pQCT provides detailed information about bone geometry and strength, offering a more comprehensive assessment of bone health. Its niche applications in research and specialized clinical settings contribute an estimated xx% to the market.
- Radiographic Absorptiometry (RA): RA represents a smaller segment with specific diagnostic applications, contributing an estimated xx% to the overall market.
The growth in these segments is underpinned by factors such as increasing healthcare expenditure, the rising burden of osteoporosis-related fractures, and the technological advancements that make these diagnostic tools more accessible and efficient.
Peripheral Bone Densitometry Product Developments
Recent product developments in peripheral bone densitometry are focused on enhancing diagnostic accuracy, patient comfort, and workflow efficiency. Innovations include the introduction of advanced imaging algorithms that reduce scanning times and improve the precision of measurements, particularly for Dual Energy X-Ray Absorptiometry (pDEXA) systems. Many new devices are also designed to be more compact and portable, facilitating their use in diverse clinical settings, from hospitals to smaller clinics and even mobile screening units. The integration of AI-powered software is a significant trend, enabling automated analysis, anomaly detection, and more comprehensive fracture risk assessment. These advancements not only offer a competitive edge to manufacturers but also provide healthcare professionals with more powerful tools for early diagnosis and personalized patient management, ultimately improving patient outcomes in the fight against osteoporosis.
Challenges in the Peripheral Bone Densitometry Market
The peripheral bone densitometry market faces several challenges that could impede its growth trajectory. High initial equipment costs can be a significant barrier for smaller clinics and healthcare facilities, limiting widespread adoption, particularly in developing economies. Stringent regulatory approval processes for new devices and software updates can lead to extended time-to-market and increased development expenses. Furthermore, the availability of skilled technicians to operate and interpret the results from these sophisticated systems can be a constraint in certain regions. The increasing competition from alternative or complementary diagnostic methods, although not direct substitutes for bone mineral density assessment, also presents a challenge by potentially fragmenting the market share for specialized densitometry services.
Forces Driving Peripheral Bone Densitometry Growth
The peripheral bone densitometry market is propelled by several robust growth drivers. The escalating global prevalence of osteoporosis and osteopenia, driven by an aging population and changing lifestyle factors, creates a substantial and growing demand for diagnostic solutions. Technological advancements, particularly in pDEXA and QUS technologies, are leading to more accurate, faster, and less invasive testing, enhancing patient acceptance and clinical utility. Government initiatives and growing awareness campaigns aimed at promoting bone health and early detection of osteoporosis are also significantly contributing to market expansion. Moreover, the economic burden associated with osteoporotic fractures, leading to increased healthcare costs and reduced quality of life, is prompting healthcare providers and payers to invest more in preventative diagnostic measures.
Challenges in the Peripheral Bone Densitometry Market
Long-term growth catalysts for the peripheral bone densitometry market are rooted in continuous innovation and strategic market expansion. The ongoing development of AI and machine learning capabilities to enhance diagnostic accuracy and provide predictive analytics for fracture risk will be instrumental. Strategic partnerships between device manufacturers and healthcare providers can foster wider adoption and integration of these technologies into routine clinical practice. Furthermore, exploring emerging markets with a growing aging population and increasing healthcare expenditure presents significant opportunities for market penetration and sustained growth. The focus on developing more cost-effective and user-friendly devices will also be crucial for democratizing access to bone health diagnostics globally.
Emerging Opportunities in Peripheral Bone Densitometry
Emerging opportunities in the peripheral bone densitometry market are poised to redefine its landscape. The increasing adoption of point-of-care diagnostics and the development of smaller, more portable QUS and pDEXA devices are opening doors for use in primary care settings, pharmacies, and even home healthcare, expanding market reach beyond traditional hospital and clinic environments. The integration of advanced AI algorithms for real-time analysis and automated reporting is enhancing efficiency and accuracy, driving demand for sophisticated solutions. Furthermore, a growing emphasis on personalized medicine and preventative healthcare is creating a demand for more comprehensive bone health assessments that can be tailored to individual patient needs and risk profiles, presenting opportunities for innovative product development and service offerings.
Leading Players in the Peripheral Bone Densitometry Sector
- BeamMed
- CompuMed
- CooperSurgical
- Diagnostic Medical Systems
- GE Healthcare
- Lone Oak Medical Technologies
- Osteometer MediTech
Key Milestones in Peripheral Bone Densitometry Industry
- 2019: Introduction of AI-powered analysis software for pDEXA, enhancing diagnostic accuracy and efficiency.
- 2020: Launch of a new generation of portable QUS devices designed for primary care settings, improving accessibility for early osteoporosis screening.
- 2021: Significant advancements in pDEXA technology leading to reduced scanning times and improved image resolution, enhancing patient comfort and workflow.
- 2022: Increased regulatory approvals for integrated bone health management platforms combining densitometry with treatment tracking.
- 2023: Strategic partnerships formed to expand the reach of peripheral bone densitometry services in underserved regions globally.
Strategic Outlook for Peripheral Bone Densitometry Market
The strategic outlook for the peripheral bone densitometry market is highly positive, fueled by sustained demand for accurate bone health diagnostics and continuous technological innovation. Growth accelerators will include the further integration of AI for predictive analytics, the development of more cost-effective and portable devices for wider accessibility, and strategic expansion into emerging markets with growing aging populations. Focus on user-friendly interfaces and seamless data integration into electronic health records will also be key differentiators. The market is expected to witness a steady increase in adoption as healthcare systems globally prioritize preventative care and the management of chronic diseases like osteoporosis, ensuring a robust future for peripheral bone densitometry.
Peripheral Bone Densitometry Segmentation
-
1. Application
- 1.1. Hospitals
- 1.2. Clinics
- 1.3. Others
-
2. Types
- 2.1. Single Energy X-Ray Absorptiometry (SEXA)
- 2.2. Dual Energy X-Ray Absorptiometry (pDEXA)
- 2.3. Radiographic Absorptiometry (RA)
- 2.4. Quantitative Ultrasound (QUS)
- 2.5. Peripheral Quantitative Computed Tomography (pQCT)
Peripheral Bone Densitometry Segmentation By Geography
-
1. North America
- 1.1. United States
- 1.2. Canada
- 1.3. Mexico
-
2. South America
- 2.1. Brazil
- 2.2. Argentina
- 2.3. Rest of South America
-
3. Europe
- 3.1. United Kingdom
- 3.2. Germany
- 3.3. France
- 3.4. Italy
- 3.5. Spain
- 3.6. Russia
- 3.7. Benelux
- 3.8. Nordics
- 3.9. Rest of Europe
-
4. Middle East & Africa
- 4.1. Turkey
- 4.2. Israel
- 4.3. GCC
- 4.4. North Africa
- 4.5. South Africa
- 4.6. Rest of Middle East & Africa
-
5. Asia Pacific
- 5.1. China
- 5.2. India
- 5.3. Japan
- 5.4. South Korea
- 5.5. ASEAN
- 5.6. Oceania
- 5.7. Rest of Asia Pacific

Peripheral Bone Densitometry Regional Market Share
Geographic Coverage of Peripheral Bone Densitometry
Peripheral Bone Densitometry REPORT HIGHLIGHTS
| Aspects | Details |
|---|---|
| Study Period | 2020-2034 |
| Base Year | 2025 |
| Estimated Year | 2026 |
| Forecast Period | 2026-2034 |
| Historical Period | 2020-2025 |
| Growth Rate | CAGR of 4.6% from 2020-2034 |
| Segmentation |
|
Table of Contents
- 1. Introduction
- 1.1. Research Scope
- 1.2. Market Segmentation
- 1.3. Research Methodology
- 1.4. Definitions and Assumptions
- 2. Executive Summary
- 2.1. Introduction
- 3. Market Dynamics
- 3.1. Introduction
- 3.2. Market Drivers
- 3.3. Market Restrains
- 3.4. Market Trends
- 4. Market Factor Analysis
- 4.1. Porters Five Forces
- 4.2. Supply/Value Chain
- 4.3. PESTEL analysis
- 4.4. Market Entropy
- 4.5. Patent/Trademark Analysis
- 5. Global Peripheral Bone Densitometry Analysis, Insights and Forecast, 2020-2032
- 5.1. Market Analysis, Insights and Forecast - by Application
- 5.1.1. Hospitals
- 5.1.2. Clinics
- 5.1.3. Others
- 5.2. Market Analysis, Insights and Forecast - by Types
- 5.2.1. Single Energy X-Ray Absorptiometry (SEXA)
- 5.2.2. Dual Energy X-Ray Absorptiometry (pDEXA)
- 5.2.3. Radiographic Absorptiometry (RA)
- 5.2.4. Quantitative Ultrasound (QUS)
- 5.2.5. Peripheral Quantitative Computed Tomography (pQCT)
- 5.3. Market Analysis, Insights and Forecast - by Region
- 5.3.1. North America
- 5.3.2. South America
- 5.3.3. Europe
- 5.3.4. Middle East & Africa
- 5.3.5. Asia Pacific
- 5.1. Market Analysis, Insights and Forecast - by Application
- 6. North America Peripheral Bone Densitometry Analysis, Insights and Forecast, 2020-2032
- 6.1. Market Analysis, Insights and Forecast - by Application
- 6.1.1. Hospitals
- 6.1.2. Clinics
- 6.1.3. Others
- 6.2. Market Analysis, Insights and Forecast - by Types
- 6.2.1. Single Energy X-Ray Absorptiometry (SEXA)
- 6.2.2. Dual Energy X-Ray Absorptiometry (pDEXA)
- 6.2.3. Radiographic Absorptiometry (RA)
- 6.2.4. Quantitative Ultrasound (QUS)
- 6.2.5. Peripheral Quantitative Computed Tomography (pQCT)
- 6.1. Market Analysis, Insights and Forecast - by Application
- 7. South America Peripheral Bone Densitometry Analysis, Insights and Forecast, 2020-2032
- 7.1. Market Analysis, Insights and Forecast - by Application
- 7.1.1. Hospitals
- 7.1.2. Clinics
- 7.1.3. Others
- 7.2. Market Analysis, Insights and Forecast - by Types
- 7.2.1. Single Energy X-Ray Absorptiometry (SEXA)
- 7.2.2. Dual Energy X-Ray Absorptiometry (pDEXA)
- 7.2.3. Radiographic Absorptiometry (RA)
- 7.2.4. Quantitative Ultrasound (QUS)
- 7.2.5. Peripheral Quantitative Computed Tomography (pQCT)
- 7.1. Market Analysis, Insights and Forecast - by Application
- 8. Europe Peripheral Bone Densitometry Analysis, Insights and Forecast, 2020-2032
- 8.1. Market Analysis, Insights and Forecast - by Application
- 8.1.1. Hospitals
- 8.1.2. Clinics
- 8.1.3. Others
- 8.2. Market Analysis, Insights and Forecast - by Types
- 8.2.1. Single Energy X-Ray Absorptiometry (SEXA)
- 8.2.2. Dual Energy X-Ray Absorptiometry (pDEXA)
- 8.2.3. Radiographic Absorptiometry (RA)
- 8.2.4. Quantitative Ultrasound (QUS)
- 8.2.5. Peripheral Quantitative Computed Tomography (pQCT)
- 8.1. Market Analysis, Insights and Forecast - by Application
- 9. Middle East & Africa Peripheral Bone Densitometry Analysis, Insights and Forecast, 2020-2032
- 9.1. Market Analysis, Insights and Forecast - by Application
- 9.1.1. Hospitals
- 9.1.2. Clinics
- 9.1.3. Others
- 9.2. Market Analysis, Insights and Forecast - by Types
- 9.2.1. Single Energy X-Ray Absorptiometry (SEXA)
- 9.2.2. Dual Energy X-Ray Absorptiometry (pDEXA)
- 9.2.3. Radiographic Absorptiometry (RA)
- 9.2.4. Quantitative Ultrasound (QUS)
- 9.2.5. Peripheral Quantitative Computed Tomography (pQCT)
- 9.1. Market Analysis, Insights and Forecast - by Application
- 10. Asia Pacific Peripheral Bone Densitometry Analysis, Insights and Forecast, 2020-2032
- 10.1. Market Analysis, Insights and Forecast - by Application
- 10.1.1. Hospitals
- 10.1.2. Clinics
- 10.1.3. Others
- 10.2. Market Analysis, Insights and Forecast - by Types
- 10.2.1. Single Energy X-Ray Absorptiometry (SEXA)
- 10.2.2. Dual Energy X-Ray Absorptiometry (pDEXA)
- 10.2.3. Radiographic Absorptiometry (RA)
- 10.2.4. Quantitative Ultrasound (QUS)
- 10.2.5. Peripheral Quantitative Computed Tomography (pQCT)
- 10.1. Market Analysis, Insights and Forecast - by Application
- 11. Competitive Analysis
- 11.1. Global Market Share Analysis 2025
- 11.2. Company Profiles
- 11.2.1 BeamMed
- 11.2.1.1. Overview
- 11.2.1.2. Products
- 11.2.1.3. SWOT Analysis
- 11.2.1.4. Recent Developments
- 11.2.1.5. Financials (Based on Availability)
- 11.2.2 CompuMed
- 11.2.2.1. Overview
- 11.2.2.2. Products
- 11.2.2.3. SWOT Analysis
- 11.2.2.4. Recent Developments
- 11.2.2.5. Financials (Based on Availability)
- 11.2.3 CooperSurgical
- 11.2.3.1. Overview
- 11.2.3.2. Products
- 11.2.3.3. SWOT Analysis
- 11.2.3.4. Recent Developments
- 11.2.3.5. Financials (Based on Availability)
- 11.2.4 Diagnostic Medical Systems
- 11.2.4.1. Overview
- 11.2.4.2. Products
- 11.2.4.3. SWOT Analysis
- 11.2.4.4. Recent Developments
- 11.2.4.5. Financials (Based on Availability)
- 11.2.5 GE Healthcare
- 11.2.5.1. Overview
- 11.2.5.2. Products
- 11.2.5.3. SWOT Analysis
- 11.2.5.4. Recent Developments
- 11.2.5.5. Financials (Based on Availability)
- 11.2.6 Lone Oak Medical Technologies
- 11.2.6.1. Overview
- 11.2.6.2. Products
- 11.2.6.3. SWOT Analysis
- 11.2.6.4. Recent Developments
- 11.2.6.5. Financials (Based on Availability)
- 11.2.7 Osteometer MediTech
- 11.2.7.1. Overview
- 11.2.7.2. Products
- 11.2.7.3. SWOT Analysis
- 11.2.7.4. Recent Developments
- 11.2.7.5. Financials (Based on Availability)
- 11.2.1 BeamMed
List of Figures
- Figure 1: Global Peripheral Bone Densitometry Revenue Breakdown (million, %) by Region 2025 & 2033
- Figure 2: North America Peripheral Bone Densitometry Revenue (million), by Application 2025 & 2033
- Figure 3: North America Peripheral Bone Densitometry Revenue Share (%), by Application 2025 & 2033
- Figure 4: North America Peripheral Bone Densitometry Revenue (million), by Types 2025 & 2033
- Figure 5: North America Peripheral Bone Densitometry Revenue Share (%), by Types 2025 & 2033
- Figure 6: North America Peripheral Bone Densitometry Revenue (million), by Country 2025 & 2033
- Figure 7: North America Peripheral Bone Densitometry Revenue Share (%), by Country 2025 & 2033
- Figure 8: South America Peripheral Bone Densitometry Revenue (million), by Application 2025 & 2033
- Figure 9: South America Peripheral Bone Densitometry Revenue Share (%), by Application 2025 & 2033
- Figure 10: South America Peripheral Bone Densitometry Revenue (million), by Types 2025 & 2033
- Figure 11: South America Peripheral Bone Densitometry Revenue Share (%), by Types 2025 & 2033
- Figure 12: South America Peripheral Bone Densitometry Revenue (million), by Country 2025 & 2033
- Figure 13: South America Peripheral Bone Densitometry Revenue Share (%), by Country 2025 & 2033
- Figure 14: Europe Peripheral Bone Densitometry Revenue (million), by Application 2025 & 2033
- Figure 15: Europe Peripheral Bone Densitometry Revenue Share (%), by Application 2025 & 2033
- Figure 16: Europe Peripheral Bone Densitometry Revenue (million), by Types 2025 & 2033
- Figure 17: Europe Peripheral Bone Densitometry Revenue Share (%), by Types 2025 & 2033
- Figure 18: Europe Peripheral Bone Densitometry Revenue (million), by Country 2025 & 2033
- Figure 19: Europe Peripheral Bone Densitometry Revenue Share (%), by Country 2025 & 2033
- Figure 20: Middle East & Africa Peripheral Bone Densitometry Revenue (million), by Application 2025 & 2033
- Figure 21: Middle East & Africa Peripheral Bone Densitometry Revenue Share (%), by Application 2025 & 2033
- Figure 22: Middle East & Africa Peripheral Bone Densitometry Revenue (million), by Types 2025 & 2033
- Figure 23: Middle East & Africa Peripheral Bone Densitometry Revenue Share (%), by Types 2025 & 2033
- Figure 24: Middle East & Africa Peripheral Bone Densitometry Revenue (million), by Country 2025 & 2033
- Figure 25: Middle East & Africa Peripheral Bone Densitometry Revenue Share (%), by Country 2025 & 2033
- Figure 26: Asia Pacific Peripheral Bone Densitometry Revenue (million), by Application 2025 & 2033
- Figure 27: Asia Pacific Peripheral Bone Densitometry Revenue Share (%), by Application 2025 & 2033
- Figure 28: Asia Pacific Peripheral Bone Densitometry Revenue (million), by Types 2025 & 2033
- Figure 29: Asia Pacific Peripheral Bone Densitometry Revenue Share (%), by Types 2025 & 2033
- Figure 30: Asia Pacific Peripheral Bone Densitometry Revenue (million), by Country 2025 & 2033
- Figure 31: Asia Pacific Peripheral Bone Densitometry Revenue Share (%), by Country 2025 & 2033
List of Tables
- Table 1: Global Peripheral Bone Densitometry Revenue million Forecast, by Application 2020 & 2033
- Table 2: Global Peripheral Bone Densitometry Revenue million Forecast, by Types 2020 & 2033
- Table 3: Global Peripheral Bone Densitometry Revenue million Forecast, by Region 2020 & 2033
- Table 4: Global Peripheral Bone Densitometry Revenue million Forecast, by Application 2020 & 2033
- Table 5: Global Peripheral Bone Densitometry Revenue million Forecast, by Types 2020 & 2033
- Table 6: Global Peripheral Bone Densitometry Revenue million Forecast, by Country 2020 & 2033
- Table 7: United States Peripheral Bone Densitometry Revenue (million) Forecast, by Application 2020 & 2033
- Table 8: Canada Peripheral Bone Densitometry Revenue (million) Forecast, by Application 2020 & 2033
- Table 9: Mexico Peripheral Bone Densitometry Revenue (million) Forecast, by Application 2020 & 2033
- Table 10: Global Peripheral Bone Densitometry Revenue million Forecast, by Application 2020 & 2033
- Table 11: Global Peripheral Bone Densitometry Revenue million Forecast, by Types 2020 & 2033
- Table 12: Global Peripheral Bone Densitometry Revenue million Forecast, by Country 2020 & 2033
- Table 13: Brazil Peripheral Bone Densitometry Revenue (million) Forecast, by Application 2020 & 2033
- Table 14: Argentina Peripheral Bone Densitometry Revenue (million) Forecast, by Application 2020 & 2033
- Table 15: Rest of South America Peripheral Bone Densitometry Revenue (million) Forecast, by Application 2020 & 2033
- Table 16: Global Peripheral Bone Densitometry Revenue million Forecast, by Application 2020 & 2033
- Table 17: Global Peripheral Bone Densitometry Revenue million Forecast, by Types 2020 & 2033
- Table 18: Global Peripheral Bone Densitometry Revenue million Forecast, by Country 2020 & 2033
- Table 19: United Kingdom Peripheral Bone Densitometry Revenue (million) Forecast, by Application 2020 & 2033
- Table 20: Germany Peripheral Bone Densitometry Revenue (million) Forecast, by Application 2020 & 2033
- Table 21: France Peripheral Bone Densitometry Revenue (million) Forecast, by Application 2020 & 2033
- Table 22: Italy Peripheral Bone Densitometry Revenue (million) Forecast, by Application 2020 & 2033
- Table 23: Spain Peripheral Bone Densitometry Revenue (million) Forecast, by Application 2020 & 2033
- Table 24: Russia Peripheral Bone Densitometry Revenue (million) Forecast, by Application 2020 & 2033
- Table 25: Benelux Peripheral Bone Densitometry Revenue (million) Forecast, by Application 2020 & 2033
- Table 26: Nordics Peripheral Bone Densitometry Revenue (million) Forecast, by Application 2020 & 2033
- Table 27: Rest of Europe Peripheral Bone Densitometry Revenue (million) Forecast, by Application 2020 & 2033
- Table 28: Global Peripheral Bone Densitometry Revenue million Forecast, by Application 2020 & 2033
- Table 29: Global Peripheral Bone Densitometry Revenue million Forecast, by Types 2020 & 2033
- Table 30: Global Peripheral Bone Densitometry Revenue million Forecast, by Country 2020 & 2033
- Table 31: Turkey Peripheral Bone Densitometry Revenue (million) Forecast, by Application 2020 & 2033
- Table 32: Israel Peripheral Bone Densitometry Revenue (million) Forecast, by Application 2020 & 2033
- Table 33: GCC Peripheral Bone Densitometry Revenue (million) Forecast, by Application 2020 & 2033
- Table 34: North Africa Peripheral Bone Densitometry Revenue (million) Forecast, by Application 2020 & 2033
- Table 35: South Africa Peripheral Bone Densitometry Revenue (million) Forecast, by Application 2020 & 2033
- Table 36: Rest of Middle East & Africa Peripheral Bone Densitometry Revenue (million) Forecast, by Application 2020 & 2033
- Table 37: Global Peripheral Bone Densitometry Revenue million Forecast, by Application 2020 & 2033
- Table 38: Global Peripheral Bone Densitometry Revenue million Forecast, by Types 2020 & 2033
- Table 39: Global Peripheral Bone Densitometry Revenue million Forecast, by Country 2020 & 2033
- Table 40: China Peripheral Bone Densitometry Revenue (million) Forecast, by Application 2020 & 2033
- Table 41: India Peripheral Bone Densitometry Revenue (million) Forecast, by Application 2020 & 2033
- Table 42: Japan Peripheral Bone Densitometry Revenue (million) Forecast, by Application 2020 & 2033
- Table 43: South Korea Peripheral Bone Densitometry Revenue (million) Forecast, by Application 2020 & 2033
- Table 44: ASEAN Peripheral Bone Densitometry Revenue (million) Forecast, by Application 2020 & 2033
- Table 45: Oceania Peripheral Bone Densitometry Revenue (million) Forecast, by Application 2020 & 2033
- Table 46: Rest of Asia Pacific Peripheral Bone Densitometry Revenue (million) Forecast, by Application 2020 & 2033
Frequently Asked Questions
1. What is the projected Compound Annual Growth Rate (CAGR) of the Peripheral Bone Densitometry?
The projected CAGR is approximately 4.6%.
2. Which companies are prominent players in the Peripheral Bone Densitometry?
Key companies in the market include BeamMed, CompuMed, CooperSurgical, Diagnostic Medical Systems, GE Healthcare, Lone Oak Medical Technologies, Osteometer MediTech.
3. What are the main segments of the Peripheral Bone Densitometry?
The market segments include Application, Types.
4. Can you provide details about the market size?
The market size is estimated to be USD 287.4 million as of 2022.
5. What are some drivers contributing to market growth?
N/A
6. What are the notable trends driving market growth?
N/A
7. Are there any restraints impacting market growth?
N/A
8. Can you provide examples of recent developments in the market?
N/A
9. What pricing options are available for accessing the report?
Pricing options include single-user, multi-user, and enterprise licenses priced at USD 3350.00, USD 5025.00, and USD 6700.00 respectively.
10. Is the market size provided in terms of value or volume?
The market size is provided in terms of value, measured in million.
11. Are there any specific market keywords associated with the report?
Yes, the market keyword associated with the report is "Peripheral Bone Densitometry," which aids in identifying and referencing the specific market segment covered.
12. How do I determine which pricing option suits my needs best?
The pricing options vary based on user requirements and access needs. Individual users may opt for single-user licenses, while businesses requiring broader access may choose multi-user or enterprise licenses for cost-effective access to the report.
13. Are there any additional resources or data provided in the Peripheral Bone Densitometry report?
While the report offers comprehensive insights, it's advisable to review the specific contents or supplementary materials provided to ascertain if additional resources or data are available.
14. How can I stay updated on further developments or reports in the Peripheral Bone Densitometry?
To stay informed about further developments, trends, and reports in the Peripheral Bone Densitometry, consider subscribing to industry newsletters, following relevant companies and organizations, or regularly checking reputable industry news sources and publications.
Methodology
Step 1 - Identification of Relevant Samples Size from Population Database


Step 2 - Approaches for Defining Global Market Size (Value, Volume* & Price*)

Note*: In applicable scenarios
Step 3 - Data Sources
Primary Research
- Web Analytics
- Survey Reports
- Research Institute
- Latest Research Reports
- Opinion Leaders
Secondary Research
- Annual Reports
- White Paper
- Latest Press Release
- Industry Association
- Paid Database
- Investor Presentations

Step 4 - Data Triangulation
Involves using different sources of information in order to increase the validity of a study
These sources are likely to be stakeholders in a program - participants, other researchers, program staff, other community members, and so on.
Then we put all data in single framework & apply various statistical tools to find out the dynamic on the market.
During the analysis stage, feedback from the stakeholder groups would be compared to determine areas of agreement as well as areas of divergence