

Key Insights
The global perlite market is projected to reach $2.45 billion by 2025, expanding at a Compound Annual Growth Rate (CAGR) of 5.78% through 2033. This significant growth is driven by increasing demand across construction (insulation, fire-proofing), horticulture (soil aeration, water retention), and industrial filtration. Perlite's lightweight, superior thermal and acoustic insulation, and inert properties position it as a leading alternative to conventional materials. The growing emphasis on sustainable construction and energy efficiency further amplifies perlite adoption.
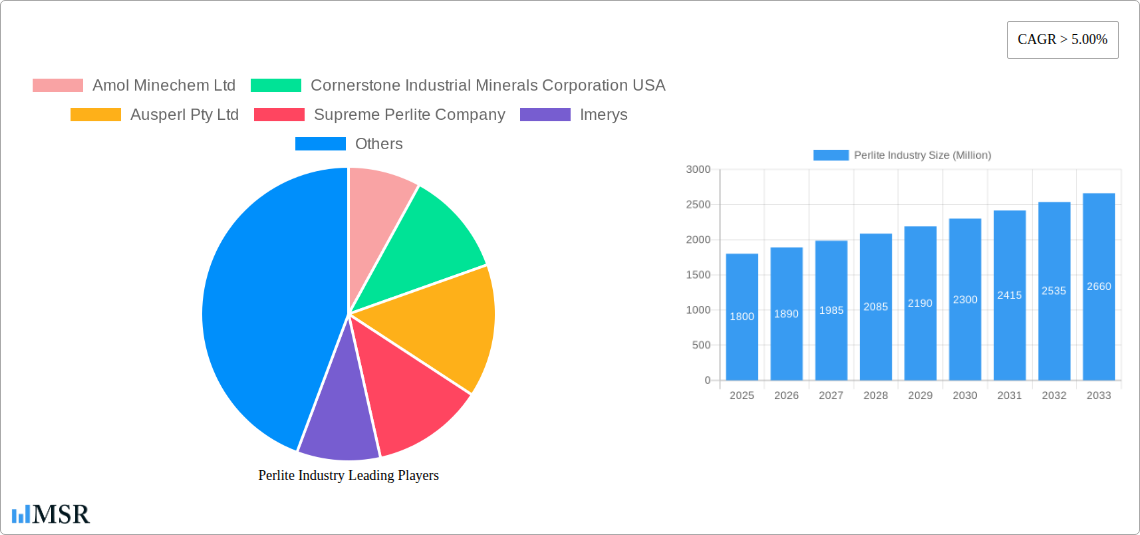
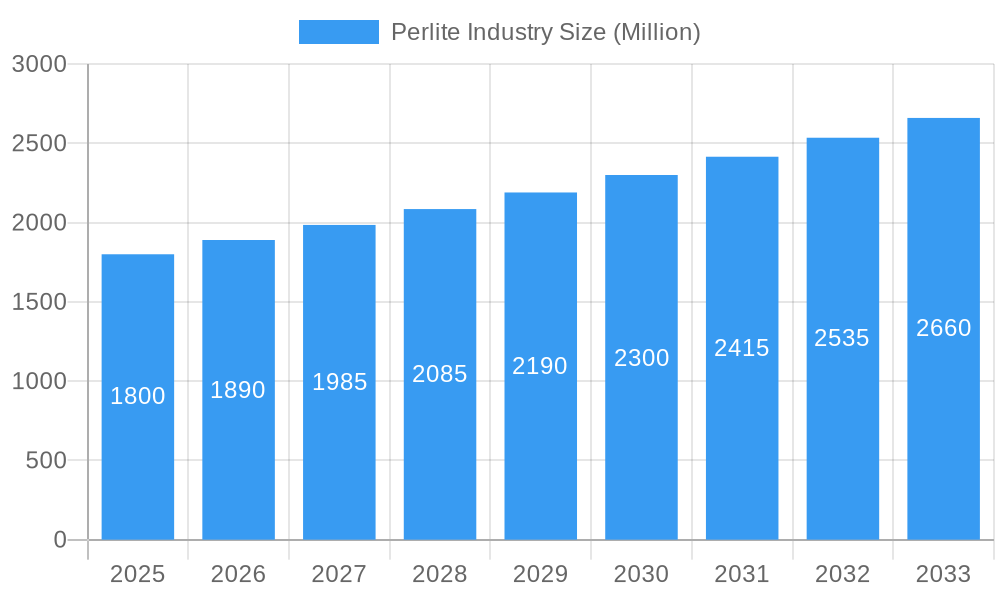
Perlite Industry Market Size (In Billion)
Key growth catalysts include global urbanization and infrastructure development, especially in the Asia Pacific and Middle East & Africa regions, which offer substantial perlite consumption potential. While transportation costs and substitute materials present minor challenges, advancements in perlite processing and application technologies are expected to mitigate these. Leading companies are actively investing in R&D and production capacity expansion to meet this escalating demand.
Perlite Industry Company Market Share
Gain deep insights into the perlite market, including its structure, key drivers, segments, innovations, challenges, opportunities, and competitive landscape. This report offers strategic intelligence for perlite producers, suppliers, construction material providers, agricultural input companies, and filtration specialists.
Perlite Industry Market Concentration & Dynamics
The global perlite market exhibits a moderate concentration, with key players like Imerys, Omya AG, and Cornerstone Industrial Minerals Corporation USA holding significant market share. Innovation is driven by advancements in processing technologies and the discovery of new applications, particularly in sustainable construction and agriculture. Regulatory frameworks, such as building codes promoting energy efficiency and environmental standards for soil amendments, indirectly influence perlite demand. Substitute products, including vermiculite, expanded clay, and synthetic fillers, present competitive pressures. End-user trends reveal a growing preference for lightweight, inert, and eco-friendly materials, bolstering perlite's appeal in insulation, fillers, and horticultural applications. Merger and acquisition (M&A) activities, such as the February 2023 acquisition of a share in Aegean Perlites by Titan Cement, signal consolidation and strategic expansion within the sector. The report analyzes M&A deal counts and their impact on market dynamics, providing a clear picture of the evolving competitive landscape. The market size for perlite is estimated to reach over $500 Million by 2025, with a projected CAGR of approximately 5.5% during the forecast period.
Perlite Industry Industry Insights & Trends
The perlite industry is experiencing robust growth, propelled by increasing demand across diverse applications. The construction sector is a major consumer, driven by the escalating need for effective thermal insulation and fire-proofing materials in residential, commercial, and industrial buildings. The lightweight nature and excellent insulating properties of expanded perlite make it an ideal choice for reducing energy consumption and enhancing building safety. Furthermore, the global focus on sustainable building practices and stricter building codes designed to improve energy efficiency directly benefit the perlite market. In agriculture, agro-perlite plays a crucial role in improving soil aeration, drainage, and water retention, leading to enhanced crop yields and reduced water usage. This aligns with the growing trend towards precision agriculture and sustainable farming methods. The filtration industry also represents a significant segment, with perlite's porous structure making it an effective filter aid for beverages, industrial liquids, and pharmaceuticals. The Vapex product type, known for its excellent moisture absorption properties, is finding increasing use in packaging and industrial applications. Technological advancements in perlite processing are enabling the development of specialized grades with tailored properties, opening up new market niches and driving innovation. The base year 2025 estimates the global perlite market size at over $500 Million, with a projected CAGR of approximately 5.5% during the forecast period from 2025 to 2033. The historical period from 2019 to 2024 shows steady growth, indicating a strong foundation for future expansion.
Key Markets & Segments Leading Perlite Industry
The North American region, particularly the United States, stands as a dominant market in the perlite industry, driven by extensive construction activities and a mature agricultural sector. The expanded perlite product type is a significant revenue generator, extensively utilized in insulation applications for both residential and commercial buildings. Factors like stringent building codes promoting energy efficiency and a growing demand for lightweight construction materials fuel its dominance. In the agro-perlite segment, drivers include the increasing adoption of sustainable agricultural practices, the need for enhanced soil quality to boost crop yields, and the growing hydroponics market. Countries like Mexico and Canada also contribute to North America's leading position.
The European market is another significant contributor, with strong demand for perlite in insulation and fire-proofing applications, particularly in countries with a strong focus on energy-efficient buildings and historical renovation projects.
The Asia-Pacific region is emerging as a high-growth market, fueled by rapid urbanization, infrastructure development, and a burgeoning agricultural sector in countries like China and India. The demand for perlite as a filler in plastics, paints, and coatings is also on the rise in this region.
- Expanded Perlite: Dominates due to its widespread use in construction for insulation and lightweight aggregates. Economic growth and infrastructure development are key drivers.
- Agro-perlite: Experiencing rapid growth due to increasing adoption of sustainable farming and precision agriculture. Environmental concerns and the need for improved soil health are significant drivers.
- Fillers: Driven by the demand from the plastics, paints, coatings, and rubber industries, seeking cost-effective and performance-enhancing additives. Industrial growth and manufacturing expansion are key drivers.
- Insulation: A core application for expanded perlite, benefiting from energy efficiency regulations and the demand for comfortable and safe living and working spaces.
- Filtration: Essential for various industries, including food and beverage, pharmaceuticals, and water treatment, where perlite's inert and porous nature is highly valued. Growing industrial production and stricter quality control measures are key drivers.
Perlite Industry Product Developments
The perlite industry is witnessing continuous product innovation, focusing on enhancing performance and expanding application areas. Advanced processing techniques are yielding perlite grades with improved thermal resistance, fire retardancy, and sound absorption properties, making them more suitable for high-performance construction materials. Innovations in agro-perlite formulations are leading to products with enhanced nutrient-holding capacities and controlled release mechanisms, benefiting modern agricultural practices. The development of specialized perlite-based composites for lightweight structural components and the exploration of perlite's potential in advanced filtration media are also noteworthy. These developments are driven by a competitive landscape and the increasing demand for sustainable and high-performing materials.
Challenges in the Perlite Industry Market
The perlite industry faces several challenges that could impede its growth. Supply chain disruptions, particularly those related to logistics and transportation costs, can impact product availability and pricing. Fluctuations in raw material prices and energy costs associated with perlite processing can affect profit margins for manufacturers. Furthermore, competition from substitute materials such as vermiculite, glass wool, and mineral wool, which offer similar properties, presents a continuous threat. Stringent environmental regulations related to mining and processing, while promoting sustainability, can also increase operational costs and complexity. The lack of awareness about the full range of perlite's benefits in certain niche applications can also hinder market penetration.
Forces Driving Perlite Industry Growth
Several key forces are propelling the perlite industry forward. The global surge in construction activities, particularly in emerging economies, is a primary growth driver, increasing demand for lightweight aggregates and insulation materials. The escalating focus on energy efficiency in buildings, spurred by government regulations and consumer awareness, significantly boosts the use of expanded perlite for thermal insulation. In agriculture, the growing adoption of sustainable farming practices and the need for improved soil conditions are driving the demand for agro-perlite. Technological advancements in processing and the discovery of novel applications, such as in specialty coatings and advanced filtration, are also contributing to market expansion.
Challenges in the Perlite Industry Market
Long-term growth catalysts within the perlite industry are rooted in innovation and market expansion. Continued research and development into new applications, such as in the medical field for drug delivery systems or in advanced composite materials, hold significant promise. Strategic partnerships and collaborations between perlite producers and end-users can foster tailored product development and market penetration. Furthermore, exploring untapped geographical markets with a growing demand for construction and agricultural inputs will be crucial for sustained growth. The increasing global emphasis on circular economy principles could also unlock opportunities for perlite in recycling and waste management applications.
Emerging Opportunities in Perlite Industry
Emerging opportunities in the perlite industry are diverse and promising. The growing demand for sustainable and eco-friendly building materials presents a significant avenue for expanded perlite. Its lightweight nature contributes to reduced transportation emissions and lower embodied energy in construction. The horticultural sector continues to offer robust growth, with an increasing interest in soilless cultivation techniques like hydroponics and aeroponics, where agro-perlite is a key component. The automotive and aerospace industries are exploring perlite for lightweight composite materials, offering potential for fuel efficiency improvements. Furthermore, the development of advanced filtration media using perlite for niche applications in pharmaceuticals and biotechnology represents a high-value opportunity.
Leading Players in the Perlite Industry Sector
- Amol Minechem Ltd
- Cornerstone Industrial Minerals Corporation USA
- Ausperl Pty Ltd
- Supreme Perlite Company
- Imerys
- Termolita
- Profiltra BV
- Midwest Perlite
- Carolina Perlite Co Inc
- Azer Perlite Corporation
- Blue Pacific Minerals
- Omya AG
- Mianeh Prlite Expanding Co Ltd
- Saudi Perlite Industries
- Bergama Mining Perlite
Key Milestones in Perlite Industry Industry
- February 2023: Titan Cement acquired a share in Aegean Perlites. This strategic move provides Titan Cement with direct access to perlite and pozzolan quarries on Yali island, including port facilities. The investment aims to increase the volume of pozzolan-based cementitious products with a lower clinker factor, aligning with Titan's target to reduce CO2 emissions by 35% by 2030 and increase the share of green products in its portfolio.
- April 2022: Silica Holdings, Inc. announced price increases for most non-contracted diatomaceous earth, perlite, and cellulose products. This decision was driven by persistent inflationary pressures on raw materials, packaging, labor, logistics, and maintenance expenses, impacting industries such as food and beverage filtration, renewable diesel, catalysts, paints and coatings, plastics, and industrial oil.
Strategic Outlook for Perlite Industry Market
The strategic outlook for the perlite industry is exceptionally positive, with continued growth anticipated across key segments. The ongoing global push for sustainable construction will solidify the demand for expanded perlite in insulation and lightweight aggregates. The agricultural sector's embrace of advanced farming techniques will further drive the adoption of agro-perlite. Key growth accelerators include continued investment in processing technology, leading to higher-value, specialized perlite grades, and the exploration of novel applications in emerging sectors like advanced composites and biotechnology. Market expansion into regions with developing infrastructure and growing agricultural needs, coupled with a focus on product differentiation and enhanced customer service, will be crucial for long-term success. The industry is poised for sustained growth, driven by innovation and a commitment to sustainability.
Perlite Industry Segmentation
-
1. Product Type
- 1.1. Expanded Perlite
- 1.2. Agro-perlite
- 1.3. Vapex
- 1.4. Other Product Types
-
2. Application
- 2.1. Fillers
- 2.2. Fire-proofing
- 2.3. Insulation
- 2.4. Filtration
- 2.5. Abrasives
- 2.6. Other Applications
Perlite Industry Segmentation By Geography
-
1. Asia Pacific
- 1.1. China
- 1.2. India
- 1.3. Japan
- 1.4. South Korea
- 1.5. Rest of Asia Pacific
-
2. North America
- 2.1. United States
- 2.2. Canada
- 2.3. Mexico
- 2.4. Rest of North America
-
3. Europe
- 3.1. Germany
- 3.2. United Kingdom
- 3.3. France
- 3.4. Italy
- 3.5. Russia
- 3.6. Rest of Europe
-
4. South America
- 4.1. Brazil
- 4.2. Argentina
- 4.3. Rest of South America
-
5. Middle East and Africa
- 5.1. Saudi Arabia
- 5.2. South Africa
- 5.3. UAE
- 5.4. Rest of Middle East and Africa
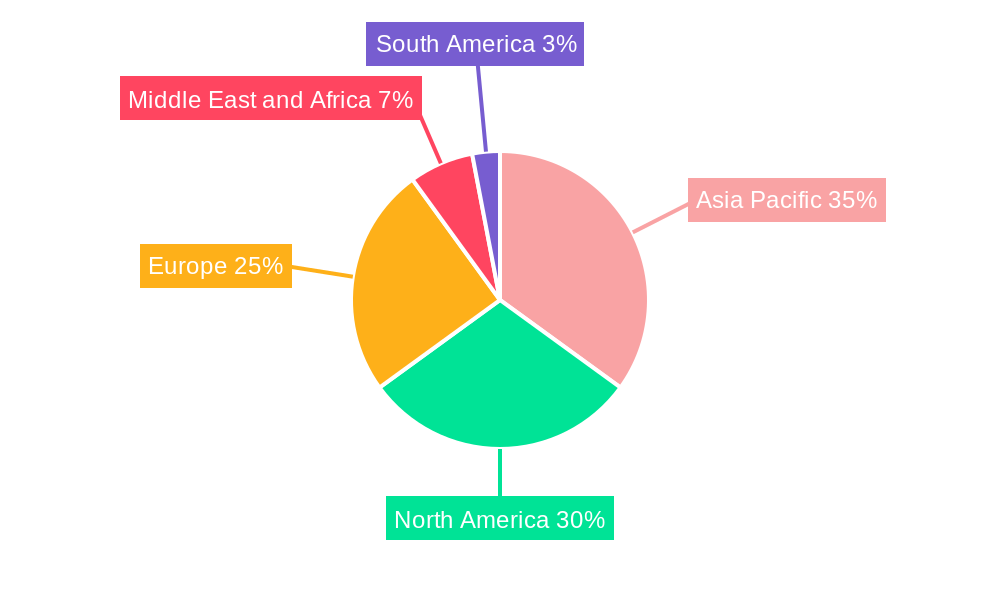
Perlite Industry Regional Market Share
Geographic Coverage of Perlite Industry
Perlite Industry REPORT HIGHLIGHTS
| Aspects | Details |
|---|---|
| Study Period | 2020-2034 |
| Base Year | 2025 |
| Estimated Year | 2026 |
| Forecast Period | 2026-2034 |
| Historical Period | 2020-2025 |
| Growth Rate | CAGR of 5.78% from 2020-2034 |
| Segmentation |
|
Table of Contents
- 1. Introduction
- 1.1. Research Scope
- 1.2. Market Segmentation
- 1.3. Research Objective
- 1.4. Definitions and Assumptions
- 2. Executive Summary
- 2.1. Market Snapshot
- 3. Market Dynamics
- 3.1. Market Drivers
- 3.2. Market Restrains
- 3.3. Market Trends
- 3.4. Market Opportunities
- 4. Market Factor Analysis
- 4.1. Porters Five Forces
- 4.1.1. Bargaining Power of Suppliers
- 4.1.2. Bargaining Power of Buyers
- 4.1.3. Threat of New Entrants
- 4.1.4. Threat of Substitutes
- 4.1.5. Competitive Rivalry
- 4.2. PESTEL analysis
- 4.3. BCG Analysis
- 4.3.1. Stars (High Growth, High Market Share)
- 4.3.2. Cash Cows (Low Growth, High Market Share)
- 4.3.3. Question Mark (High Growth, Low Market Share)
- 4.3.4. Dogs (Low Growth, Low Market Share)
- 4.4. Ansoff Matrix Analysis
- 4.5. Supply Chain Analysis
- 4.6. Regulatory Landscape
- 4.7. Current Market Potential and Opportunity Assessment (TAM–SAM–SOM Framework)
- 4.8. MSR Analyst Note
- 4.1. Porters Five Forces
- 5. Market Analysis, Insights and Forecast 2021-2033
- 5.1. Market Analysis, Insights and Forecast - by Product Type
- 5.1.1. Expanded Perlite
- 5.1.2. Agro-perlite
- 5.1.3. Vapex
- 5.1.4. Other Product Types
- 5.2. Market Analysis, Insights and Forecast - by Application
- 5.2.1. Fillers
- 5.2.2. Fire-proofing
- 5.2.3. Insulation
- 5.2.4. Filtration
- 5.2.5. Abrasives
- 5.2.6. Other Applications
- 5.3. Market Analysis, Insights and Forecast - by Region
- 5.3.1. Asia Pacific
- 5.3.2. North America
- 5.3.3. Europe
- 5.3.4. South America
- 5.3.5. Middle East and Africa
- 5.1. Market Analysis, Insights and Forecast - by Product Type
- 6. Global Perlite Industry Analysis, Insights and Forecast, 2021-2033
- 6.1. Market Analysis, Insights and Forecast - by Product Type
- 6.1.1. Expanded Perlite
- 6.1.2. Agro-perlite
- 6.1.3. Vapex
- 6.1.4. Other Product Types
- 6.2. Market Analysis, Insights and Forecast - by Application
- 6.2.1. Fillers
- 6.2.2. Fire-proofing
- 6.2.3. Insulation
- 6.2.4. Filtration
- 6.2.5. Abrasives
- 6.2.6. Other Applications
- 6.1. Market Analysis, Insights and Forecast - by Product Type
- 7. Asia Pacific Perlite Industry Analysis, Insights and Forecast, 2020-2032
- 7.1. Market Analysis, Insights and Forecast - by Product Type
- 7.1.1. Expanded Perlite
- 7.1.2. Agro-perlite
- 7.1.3. Vapex
- 7.1.4. Other Product Types
- 7.2. Market Analysis, Insights and Forecast - by Application
- 7.2.1. Fillers
- 7.2.2. Fire-proofing
- 7.2.3. Insulation
- 7.2.4. Filtration
- 7.2.5. Abrasives
- 7.2.6. Other Applications
- 7.1. Market Analysis, Insights and Forecast - by Product Type
- 8. North America Perlite Industry Analysis, Insights and Forecast, 2020-2032
- 8.1. Market Analysis, Insights and Forecast - by Product Type
- 8.1.1. Expanded Perlite
- 8.1.2. Agro-perlite
- 8.1.3. Vapex
- 8.1.4. Other Product Types
- 8.2. Market Analysis, Insights and Forecast - by Application
- 8.2.1. Fillers
- 8.2.2. Fire-proofing
- 8.2.3. Insulation
- 8.2.4. Filtration
- 8.2.5. Abrasives
- 8.2.6. Other Applications
- 8.1. Market Analysis, Insights and Forecast - by Product Type
- 9. Europe Perlite Industry Analysis, Insights and Forecast, 2020-2032
- 9.1. Market Analysis, Insights and Forecast - by Product Type
- 9.1.1. Expanded Perlite
- 9.1.2. Agro-perlite
- 9.1.3. Vapex
- 9.1.4. Other Product Types
- 9.2. Market Analysis, Insights and Forecast - by Application
- 9.2.1. Fillers
- 9.2.2. Fire-proofing
- 9.2.3. Insulation
- 9.2.4. Filtration
- 9.2.5. Abrasives
- 9.2.6. Other Applications
- 9.1. Market Analysis, Insights and Forecast - by Product Type
- 10. South America Perlite Industry Analysis, Insights and Forecast, 2020-2032
- 10.1. Market Analysis, Insights and Forecast - by Product Type
- 10.1.1. Expanded Perlite
- 10.1.2. Agro-perlite
- 10.1.3. Vapex
- 10.1.4. Other Product Types
- 10.2. Market Analysis, Insights and Forecast - by Application
- 10.2.1. Fillers
- 10.2.2. Fire-proofing
- 10.2.3. Insulation
- 10.2.4. Filtration
- 10.2.5. Abrasives
- 10.2.6. Other Applications
- 10.1. Market Analysis, Insights and Forecast - by Product Type
- 11. Middle East and Africa Perlite Industry Analysis, Insights and Forecast, 2020-2032
- 11.1. Market Analysis, Insights and Forecast - by Product Type
- 11.1.1. Expanded Perlite
- 11.1.2. Agro-perlite
- 11.1.3. Vapex
- 11.1.4. Other Product Types
- 11.2. Market Analysis, Insights and Forecast - by Application
- 11.2.1. Fillers
- 11.2.2. Fire-proofing
- 11.2.3. Insulation
- 11.2.4. Filtration
- 11.2.5. Abrasives
- 11.2.6. Other Applications
- 11.1. Market Analysis, Insights and Forecast - by Product Type
- 12. Competitive Analysis
- 12.1. Company Profiles
- 12.1.1 Amol Minechem Ltd
- 12.1.1.1. Company Overview
- 12.1.1.2. Products
- 12.1.1.3. Company Financials
- 12.1.1.4. SWOT Analysis
- 12.1.2 Cornerstone Industrial Minerals Corporation USA
- 12.1.2.1. Company Overview
- 12.1.2.2. Products
- 12.1.2.3. Company Financials
- 12.1.2.4. SWOT Analysis
- 12.1.3 Ausperl Pty Ltd
- 12.1.3.1. Company Overview
- 12.1.3.2. Products
- 12.1.3.3. Company Financials
- 12.1.3.4. SWOT Analysis
- 12.1.4 Supreme Perlite Company
- 12.1.4.1. Company Overview
- 12.1.4.2. Products
- 12.1.4.3. Company Financials
- 12.1.4.4. SWOT Analysis
- 12.1.5 Imerys
- 12.1.5.1. Company Overview
- 12.1.5.2. Products
- 12.1.5.3. Company Financials
- 12.1.5.4. SWOT Analysis
- 12.1.6 Termolita
- 12.1.6.1. Company Overview
- 12.1.6.2. Products
- 12.1.6.3. Company Financials
- 12.1.6.4. SWOT Analysis
- 12.1.7 Profiltra BV
- 12.1.7.1. Company Overview
- 12.1.7.2. Products
- 12.1.7.3. Company Financials
- 12.1.7.4. SWOT Analysis
- 12.1.8 Midwest Perlite
- 12.1.8.1. Company Overview
- 12.1.8.2. Products
- 12.1.8.3. Company Financials
- 12.1.8.4. SWOT Analysis
- 12.1.9 Carolina Perlite Co Inc
- 12.1.9.1. Company Overview
- 12.1.9.2. Products
- 12.1.9.3. Company Financials
- 12.1.9.4. SWOT Analysis
- 12.1.10 Azer Perlite Corporation
- 12.1.10.1. Company Overview
- 12.1.10.2. Products
- 12.1.10.3. Company Financials
- 12.1.10.4. SWOT Analysis
- 12.1.11 Blue Pacific Minerals
- 12.1.11.1. Company Overview
- 12.1.11.2. Products
- 12.1.11.3. Company Financials
- 12.1.11.4. SWOT Analysis
- 12.1.12 Omya AG
- 12.1.12.1. Company Overview
- 12.1.12.2. Products
- 12.1.12.3. Company Financials
- 12.1.12.4. SWOT Analysis
- 12.1.13 Mianeh Prlite Expanding Co Ltd
- 12.1.13.1. Company Overview
- 12.1.13.2. Products
- 12.1.13.3. Company Financials
- 12.1.13.4. SWOT Analysis
- 12.1.14 Saudi Perlite Industries
- 12.1.14.1. Company Overview
- 12.1.14.2. Products
- 12.1.14.3. Company Financials
- 12.1.14.4. SWOT Analysis
- 12.1.15 Bergama Mining Perlite
- 12.1.15.1. Company Overview
- 12.1.15.2. Products
- 12.1.15.3. Company Financials
- 12.1.15.4. SWOT Analysis
- 12.1.1 Amol Minechem Ltd
- 12.2. Market Entropy
- 12.2.1 Company's Key Areas Served
- 12.2.2 Recent Developments
- 12.3. Company Market Share Analysis 2025
- 12.3.1 Top 5 Companies Market Share Analysis
- 12.3.2 Top 3 Companies Market Share Analysis
- 12.4. List of Potential Customers
- 13. Research Methodology
List of Figures
- Figure 1: Global Perlite Industry Revenue Breakdown (billion, %) by Region 2025 & 2033
- Figure 2: Global Perlite Industry Volume Breakdown (K Tons, %) by Region 2025 & 2033
- Figure 3: Asia Pacific Perlite Industry Revenue (billion), by Product Type 2025 & 2033
- Figure 4: Asia Pacific Perlite Industry Volume (K Tons), by Product Type 2025 & 2033
- Figure 5: Asia Pacific Perlite Industry Revenue Share (%), by Product Type 2025 & 2033
- Figure 6: Asia Pacific Perlite Industry Volume Share (%), by Product Type 2025 & 2033
- Figure 7: Asia Pacific Perlite Industry Revenue (billion), by Application 2025 & 2033
- Figure 8: Asia Pacific Perlite Industry Volume (K Tons), by Application 2025 & 2033
- Figure 9: Asia Pacific Perlite Industry Revenue Share (%), by Application 2025 & 2033
- Figure 10: Asia Pacific Perlite Industry Volume Share (%), by Application 2025 & 2033
- Figure 11: Asia Pacific Perlite Industry Revenue (billion), by Country 2025 & 2033
- Figure 12: Asia Pacific Perlite Industry Volume (K Tons), by Country 2025 & 2033
- Figure 13: Asia Pacific Perlite Industry Revenue Share (%), by Country 2025 & 2033
- Figure 14: Asia Pacific Perlite Industry Volume Share (%), by Country 2025 & 2033
- Figure 15: North America Perlite Industry Revenue (billion), by Product Type 2025 & 2033
- Figure 16: North America Perlite Industry Volume (K Tons), by Product Type 2025 & 2033
- Figure 17: North America Perlite Industry Revenue Share (%), by Product Type 2025 & 2033
- Figure 18: North America Perlite Industry Volume Share (%), by Product Type 2025 & 2033
- Figure 19: North America Perlite Industry Revenue (billion), by Application 2025 & 2033
- Figure 20: North America Perlite Industry Volume (K Tons), by Application 2025 & 2033
- Figure 21: North America Perlite Industry Revenue Share (%), by Application 2025 & 2033
- Figure 22: North America Perlite Industry Volume Share (%), by Application 2025 & 2033
- Figure 23: North America Perlite Industry Revenue (billion), by Country 2025 & 2033
- Figure 24: North America Perlite Industry Volume (K Tons), by Country 2025 & 2033
- Figure 25: North America Perlite Industry Revenue Share (%), by Country 2025 & 2033
- Figure 26: North America Perlite Industry Volume Share (%), by Country 2025 & 2033
- Figure 27: Europe Perlite Industry Revenue (billion), by Product Type 2025 & 2033
- Figure 28: Europe Perlite Industry Volume (K Tons), by Product Type 2025 & 2033
- Figure 29: Europe Perlite Industry Revenue Share (%), by Product Type 2025 & 2033
- Figure 30: Europe Perlite Industry Volume Share (%), by Product Type 2025 & 2033
- Figure 31: Europe Perlite Industry Revenue (billion), by Application 2025 & 2033
- Figure 32: Europe Perlite Industry Volume (K Tons), by Application 2025 & 2033
- Figure 33: Europe Perlite Industry Revenue Share (%), by Application 2025 & 2033
- Figure 34: Europe Perlite Industry Volume Share (%), by Application 2025 & 2033
- Figure 35: Europe Perlite Industry Revenue (billion), by Country 2025 & 2033
- Figure 36: Europe Perlite Industry Volume (K Tons), by Country 2025 & 2033
- Figure 37: Europe Perlite Industry Revenue Share (%), by Country 2025 & 2033
- Figure 38: Europe Perlite Industry Volume Share (%), by Country 2025 & 2033
- Figure 39: South America Perlite Industry Revenue (billion), by Product Type 2025 & 2033
- Figure 40: South America Perlite Industry Volume (K Tons), by Product Type 2025 & 2033
- Figure 41: South America Perlite Industry Revenue Share (%), by Product Type 2025 & 2033
- Figure 42: South America Perlite Industry Volume Share (%), by Product Type 2025 & 2033
- Figure 43: South America Perlite Industry Revenue (billion), by Application 2025 & 2033
- Figure 44: South America Perlite Industry Volume (K Tons), by Application 2025 & 2033
- Figure 45: South America Perlite Industry Revenue Share (%), by Application 2025 & 2033
- Figure 46: South America Perlite Industry Volume Share (%), by Application 2025 & 2033
- Figure 47: South America Perlite Industry Revenue (billion), by Country 2025 & 2033
- Figure 48: South America Perlite Industry Volume (K Tons), by Country 2025 & 2033
- Figure 49: South America Perlite Industry Revenue Share (%), by Country 2025 & 2033
- Figure 50: South America Perlite Industry Volume Share (%), by Country 2025 & 2033
- Figure 51: Middle East and Africa Perlite Industry Revenue (billion), by Product Type 2025 & 2033
- Figure 52: Middle East and Africa Perlite Industry Volume (K Tons), by Product Type 2025 & 2033
- Figure 53: Middle East and Africa Perlite Industry Revenue Share (%), by Product Type 2025 & 2033
- Figure 54: Middle East and Africa Perlite Industry Volume Share (%), by Product Type 2025 & 2033
- Figure 55: Middle East and Africa Perlite Industry Revenue (billion), by Application 2025 & 2033
- Figure 56: Middle East and Africa Perlite Industry Volume (K Tons), by Application 2025 & 2033
- Figure 57: Middle East and Africa Perlite Industry Revenue Share (%), by Application 2025 & 2033
- Figure 58: Middle East and Africa Perlite Industry Volume Share (%), by Application 2025 & 2033
- Figure 59: Middle East and Africa Perlite Industry Revenue (billion), by Country 2025 & 2033
- Figure 60: Middle East and Africa Perlite Industry Volume (K Tons), by Country 2025 & 2033
- Figure 61: Middle East and Africa Perlite Industry Revenue Share (%), by Country 2025 & 2033
- Figure 62: Middle East and Africa Perlite Industry Volume Share (%), by Country 2025 & 2033
List of Tables
- Table 1: Global Perlite Industry Revenue billion Forecast, by Product Type 2020 & 2033
- Table 2: Global Perlite Industry Volume K Tons Forecast, by Product Type 2020 & 2033
- Table 3: Global Perlite Industry Revenue billion Forecast, by Application 2020 & 2033
- Table 4: Global Perlite Industry Volume K Tons Forecast, by Application 2020 & 2033
- Table 5: Global Perlite Industry Revenue billion Forecast, by Region 2020 & 2033
- Table 6: Global Perlite Industry Volume K Tons Forecast, by Region 2020 & 2033
- Table 7: Global Perlite Industry Revenue billion Forecast, by Product Type 2020 & 2033
- Table 8: Global Perlite Industry Volume K Tons Forecast, by Product Type 2020 & 2033
- Table 9: Global Perlite Industry Revenue billion Forecast, by Application 2020 & 2033
- Table 10: Global Perlite Industry Volume K Tons Forecast, by Application 2020 & 2033
- Table 11: Global Perlite Industry Revenue billion Forecast, by Country 2020 & 2033
- Table 12: Global Perlite Industry Volume K Tons Forecast, by Country 2020 & 2033
- Table 13: China Perlite Industry Revenue (billion) Forecast, by Application 2020 & 2033
- Table 14: China Perlite Industry Volume (K Tons) Forecast, by Application 2020 & 2033
- Table 15: India Perlite Industry Revenue (billion) Forecast, by Application 2020 & 2033
- Table 16: India Perlite Industry Volume (K Tons) Forecast, by Application 2020 & 2033
- Table 17: Japan Perlite Industry Revenue (billion) Forecast, by Application 2020 & 2033
- Table 18: Japan Perlite Industry Volume (K Tons) Forecast, by Application 2020 & 2033
- Table 19: South Korea Perlite Industry Revenue (billion) Forecast, by Application 2020 & 2033
- Table 20: South Korea Perlite Industry Volume (K Tons) Forecast, by Application 2020 & 2033
- Table 21: Rest of Asia Pacific Perlite Industry Revenue (billion) Forecast, by Application 2020 & 2033
- Table 22: Rest of Asia Pacific Perlite Industry Volume (K Tons) Forecast, by Application 2020 & 2033
- Table 23: Global Perlite Industry Revenue billion Forecast, by Product Type 2020 & 2033
- Table 24: Global Perlite Industry Volume K Tons Forecast, by Product Type 2020 & 2033
- Table 25: Global Perlite Industry Revenue billion Forecast, by Application 2020 & 2033
- Table 26: Global Perlite Industry Volume K Tons Forecast, by Application 2020 & 2033
- Table 27: Global Perlite Industry Revenue billion Forecast, by Country 2020 & 2033
- Table 28: Global Perlite Industry Volume K Tons Forecast, by Country 2020 & 2033
- Table 29: United States Perlite Industry Revenue (billion) Forecast, by Application 2020 & 2033
- Table 30: United States Perlite Industry Volume (K Tons) Forecast, by Application 2020 & 2033
- Table 31: Canada Perlite Industry Revenue (billion) Forecast, by Application 2020 & 2033
- Table 32: Canada Perlite Industry Volume (K Tons) Forecast, by Application 2020 & 2033
- Table 33: Mexico Perlite Industry Revenue (billion) Forecast, by Application 2020 & 2033
- Table 34: Mexico Perlite Industry Volume (K Tons) Forecast, by Application 2020 & 2033
- Table 35: Rest of North America Perlite Industry Revenue (billion) Forecast, by Application 2020 & 2033
- Table 36: Rest of North America Perlite Industry Volume (K Tons) Forecast, by Application 2020 & 2033
- Table 37: Global Perlite Industry Revenue billion Forecast, by Product Type 2020 & 2033
- Table 38: Global Perlite Industry Volume K Tons Forecast, by Product Type 2020 & 2033
- Table 39: Global Perlite Industry Revenue billion Forecast, by Application 2020 & 2033
- Table 40: Global Perlite Industry Volume K Tons Forecast, by Application 2020 & 2033
- Table 41: Global Perlite Industry Revenue billion Forecast, by Country 2020 & 2033
- Table 42: Global Perlite Industry Volume K Tons Forecast, by Country 2020 & 2033
- Table 43: Germany Perlite Industry Revenue (billion) Forecast, by Application 2020 & 2033
- Table 44: Germany Perlite Industry Volume (K Tons) Forecast, by Application 2020 & 2033
- Table 45: United Kingdom Perlite Industry Revenue (billion) Forecast, by Application 2020 & 2033
- Table 46: United Kingdom Perlite Industry Volume (K Tons) Forecast, by Application 2020 & 2033
- Table 47: France Perlite Industry Revenue (billion) Forecast, by Application 2020 & 2033
- Table 48: France Perlite Industry Volume (K Tons) Forecast, by Application 2020 & 2033
- Table 49: Italy Perlite Industry Revenue (billion) Forecast, by Application 2020 & 2033
- Table 50: Italy Perlite Industry Volume (K Tons) Forecast, by Application 2020 & 2033
- Table 51: Russia Perlite Industry Revenue (billion) Forecast, by Application 2020 & 2033
- Table 52: Russia Perlite Industry Volume (K Tons) Forecast, by Application 2020 & 2033
- Table 53: Rest of Europe Perlite Industry Revenue (billion) Forecast, by Application 2020 & 2033
- Table 54: Rest of Europe Perlite Industry Volume (K Tons) Forecast, by Application 2020 & 2033
- Table 55: Global Perlite Industry Revenue billion Forecast, by Product Type 2020 & 2033
- Table 56: Global Perlite Industry Volume K Tons Forecast, by Product Type 2020 & 2033
- Table 57: Global Perlite Industry Revenue billion Forecast, by Application 2020 & 2033
- Table 58: Global Perlite Industry Volume K Tons Forecast, by Application 2020 & 2033
- Table 59: Global Perlite Industry Revenue billion Forecast, by Country 2020 & 2033
- Table 60: Global Perlite Industry Volume K Tons Forecast, by Country 2020 & 2033
- Table 61: Brazil Perlite Industry Revenue (billion) Forecast, by Application 2020 & 2033
- Table 62: Brazil Perlite Industry Volume (K Tons) Forecast, by Application 2020 & 2033
- Table 63: Argentina Perlite Industry Revenue (billion) Forecast, by Application 2020 & 2033
- Table 64: Argentina Perlite Industry Volume (K Tons) Forecast, by Application 2020 & 2033
- Table 65: Rest of South America Perlite Industry Revenue (billion) Forecast, by Application 2020 & 2033
- Table 66: Rest of South America Perlite Industry Volume (K Tons) Forecast, by Application 2020 & 2033
- Table 67: Global Perlite Industry Revenue billion Forecast, by Product Type 2020 & 2033
- Table 68: Global Perlite Industry Volume K Tons Forecast, by Product Type 2020 & 2033
- Table 69: Global Perlite Industry Revenue billion Forecast, by Application 2020 & 2033
- Table 70: Global Perlite Industry Volume K Tons Forecast, by Application 2020 & 2033
- Table 71: Global Perlite Industry Revenue billion Forecast, by Country 2020 & 2033
- Table 72: Global Perlite Industry Volume K Tons Forecast, by Country 2020 & 2033
- Table 73: Saudi Arabia Perlite Industry Revenue (billion) Forecast, by Application 2020 & 2033
- Table 74: Saudi Arabia Perlite Industry Volume (K Tons) Forecast, by Application 2020 & 2033
- Table 75: South Africa Perlite Industry Revenue (billion) Forecast, by Application 2020 & 2033
- Table 76: South Africa Perlite Industry Volume (K Tons) Forecast, by Application 2020 & 2033
- Table 77: UAE Perlite Industry Revenue (billion) Forecast, by Application 2020 & 2033
- Table 78: UAE Perlite Industry Volume (K Tons) Forecast, by Application 2020 & 2033
- Table 79: Rest of Middle East and Africa Perlite Industry Revenue (billion) Forecast, by Application 2020 & 2033
- Table 80: Rest of Middle East and Africa Perlite Industry Volume (K Tons) Forecast, by Application 2020 & 2033
Frequently Asked Questions
1. What is the projected Compound Annual Growth Rate (CAGR) of the Perlite Industry?
The projected CAGR is approximately 5.78%.
2. Which companies are prominent players in the Perlite Industry?
Key companies in the market include Amol Minechem Ltd, Cornerstone Industrial Minerals Corporation USA, Ausperl Pty Ltd, Supreme Perlite Company, Imerys, Termolita, Profiltra BV, Midwest Perlite, Carolina Perlite Co Inc, Azer Perlite Corporation, Blue Pacific Minerals, Omya AG, Mianeh Prlite Expanding Co Ltd, Saudi Perlite Industries, Bergama Mining Perlite.
3. What are the main segments of the Perlite Industry?
The market segments include Product Type, Application.
4. Can you provide details about the market size?
The market size is estimated to be USD 2.45 billion as of 2022.
5. What are some drivers contributing to market growth?
Surge in Demand in the Agricultural and Construction Industries; Increasing Usage in the Metallurgical Industry; Other Drivers.
6. What are the notable trends driving market growth?
Increasing Demand from Construction Sector.
7. Are there any restraints impacting market growth?
Availability of Substitutes; Health Problems Due to Prolonged Exposure; Other Restraints.
8. Can you provide examples of recent developments in the market?
February 2023: Titan Cement acquired a share in Aegean Perlites. The company operates perlite and pozzolan quarries on the island of Yali. It also has access to port facilities. Titan Group says it is investing in direct access to pozzolan reserves to increase its volume of pozzolan-based cementitious products with a lower clinker factor. The deal is connected to Titan's target to reduce its CO2 emissions by 35% by 2030, compared to 1990 levels, and increase the share of green products in its portfolio to over 50%.
9. What pricing options are available for accessing the report?
Pricing options include single-user, multi-user, and enterprise licenses priced at USD 4750, USD 5250, and USD 8750 respectively.
10. Is the market size provided in terms of value or volume?
The market size is provided in terms of value, measured in billion and volume, measured in K Tons.
11. Are there any specific market keywords associated with the report?
Yes, the market keyword associated with the report is "Perlite Industry," which aids in identifying and referencing the specific market segment covered.
12. How do I determine which pricing option suits my needs best?
The pricing options vary based on user requirements and access needs. Individual users may opt for single-user licenses, while businesses requiring broader access may choose multi-user or enterprise licenses for cost-effective access to the report.
13. Are there any additional resources or data provided in the Perlite Industry report?
While the report offers comprehensive insights, it's advisable to review the specific contents or supplementary materials provided to ascertain if additional resources or data are available.
14. How can I stay updated on further developments or reports in the Perlite Industry?
To stay informed about further developments, trends, and reports in the Perlite Industry, consider subscribing to industry newsletters, following relevant companies and organizations, or regularly checking reputable industry news sources and publications.
Methodology
Step 1 - Identification of Relevant Samples Size from Population Database


Step 2 - Approaches for Defining Global Market Size (Value, Volume* & Price*)

Note*: In applicable scenarios
Step 3 - Data Sources
Primary Research
- Web Analytics
- Survey Reports
- Research Institute
- Latest Research Reports
- Opinion Leaders
Secondary Research
- Annual Reports
- White Paper
- Latest Press Release
- Industry Association
- Paid Database
- Investor Presentations

Step 4 - Data Triangulation
Involves using different sources of information in order to increase the validity of a study
These sources are likely to be stakeholders in a program - participants, other researchers, program staff, other community members, and so on.
Then we put all data in single framework & apply various statistical tools to find out the dynamic on the market.
During the analysis stage, feedback from the stakeholder groups would be compared to determine areas of agreement as well as areas of divergence