

Key Insights
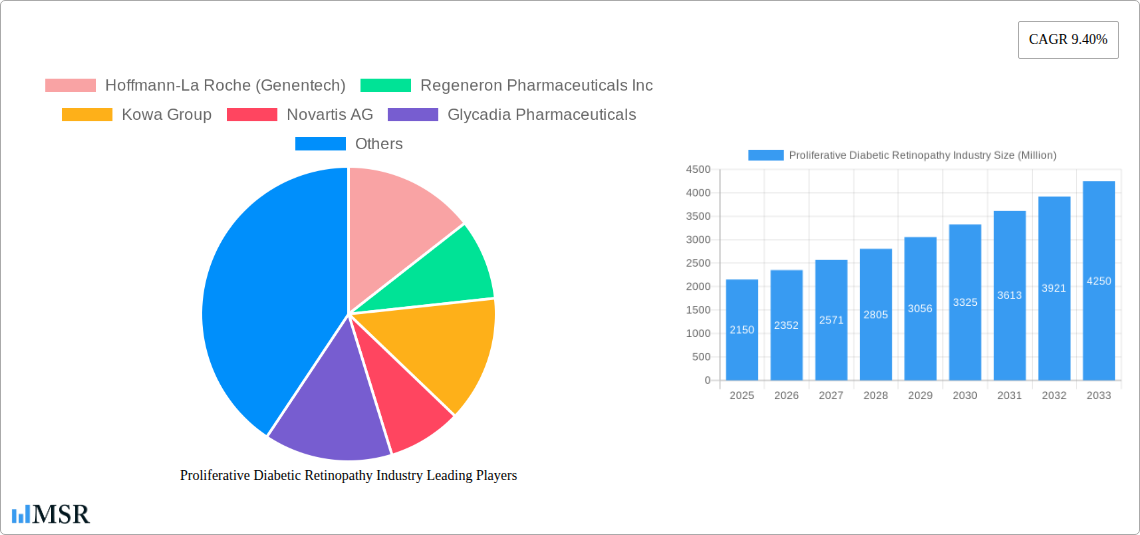
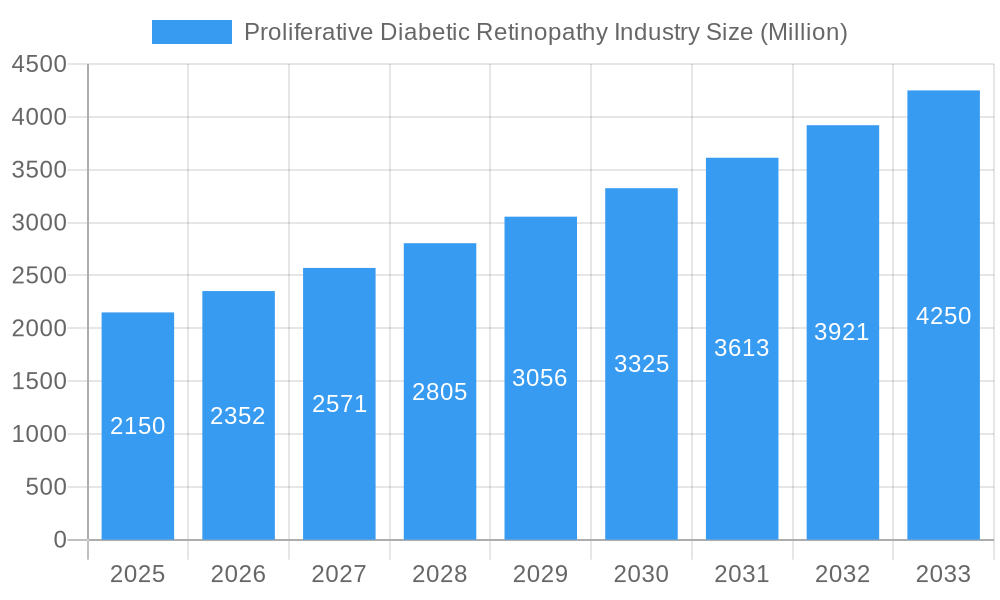
The Proliferative Diabetic Retinopathy (PDR) market is poised for significant expansion, driven by the escalating global prevalence of diabetes and its associated ocular complications. With an estimated market size of approximately $2,150 million in 2025, the industry is projected to witness a robust Compound Annual Growth Rate (CAGR) of 9.40% through 2033. This growth is primarily fueled by advancements in treatment modalities, particularly the increasing adoption of Anti-VEGF agents, which offer superior efficacy in inhibiting neovascularization and improving visual outcomes. The growing awareness among diabetic patients about the risks of vision loss and the importance of early detection and treatment further bolsters market demand. Moreover, favorable reimbursement policies in key regions and continuous innovation in drug delivery systems are expected to accelerate market penetration.
Proliferative Diabetic Retinopathy Industry Market Size (In Billion)
The PDR market landscape is characterized by a diverse range of therapeutic approaches, with Anti-VEGF agents and Corticosteroids emerging as dominant treatment segments due to their proven effectiveness and expanding indications. Laser surgery, while a long-standing treatment, is gradually being complemented by less invasive and more targeted pharmacological interventions. The competitive environment is shaped by the presence of major pharmaceutical giants and specialized biotechnology firms, all vying for market share through strategic partnerships, product development, and geographical expansion. North America and Europe currently represent the largest markets, owing to high diabetes rates, advanced healthcare infrastructure, and significant investment in R&D. However, the Asia Pacific region is anticipated to exhibit the fastest growth trajectory, propelled by increasing healthcare expenditure, a burgeoning diabetic population, and improving access to advanced treatments. Key market restraints include the high cost of some advanced therapies and potential side effects associated with certain treatments, which may limit adoption in cost-sensitive markets.
Proliferative Diabetic Retinopathy Industry Company Market Share
Proliferative Diabetic Retinopathy Market: Comprehensive Industry Analysis & Forecast (2019-2033)
Report Description:
Unlock critical insights into the Proliferative Diabetic Retinopathy (PDR) Industry with this in-depth market analysis. Covering the period from 2019 to 2033, with a base year of 2025, this report provides a detailed examination of market dynamics, growth drivers, challenges, and opportunities. Discover the competitive landscape, including key players like Hoffmann-La Roche (Genentech), Regeneron Pharmaceuticals Inc, Kowa Group, Novartis AG, Glycadia Pharmaceuticals, Oxurion NV, Alimera Sciences, Allergan Plc, and BCN Peptides. Analyze the market segmentation by Treatment Type: Anti-VEGF Agents, Corticosteroids, Laser Surgery, Others. This report is essential for pharmaceutical companies, biotechnology firms, research institutions, investors, and healthcare providers seeking to understand and capitalize on the rapidly evolving PDR treatment market. Leveraging high-ranking SEO keywords, this comprehensive guide ensures maximum visibility and attracts key stakeholders.
Proliferative Diabetic Retinopathy Industry Market Concentration & Dynamics
The Proliferative Diabetic Retinopathy (PDR) industry exhibits a moderate to high market concentration, dominated by a few key players who hold significant market share in the development and distribution of novel PDR treatments. Innovation ecosystems are vibrant, driven by ongoing research into advanced therapies and drug delivery systems aimed at improving patient outcomes and reducing the incidence of vision loss. Regulatory frameworks, primarily governed by bodies like the FDA and EMA, play a crucial role in shaping market entry and product approval, necessitating rigorous clinical trials and safety evaluations. Substitute products, while limited in their direct efficacy against advanced PDR, include less invasive procedures and lifestyle management strategies that can delay disease progression. End-user trends are increasingly focused on minimally invasive treatments, improved quality of life, and early detection of diabetic retinopathy complications. Merger and acquisition (M&A) activities are expected to continue as larger pharmaceutical companies seek to expand their ophthalmology portfolios and acquire promising technologies. M&A deal counts have been approximately xx in the historical period (2019-2024), indicating strategic consolidation. Market share for leading Anti-VEGF agents is estimated to be over 70% of the PDR treatment market.
Proliferative Diabetic Retinopathy Industry Industry Insights & Trends
The Proliferative Diabetic Retinopathy (PDR) industry is poised for significant growth, driven by a confluence of factors including the escalating global prevalence of diabetes, an aging population, and advancements in ophthalmic treatment modalities. The market size for PDR treatments was approximately USD 5 Billion in the base year 2025, and is projected to reach USD 8 Billion by 2033, exhibiting a Compound Annual Growth Rate (CAGR) of 5.5% during the forecast period (2025-2033). This growth is underpinned by an increasing understanding of the pathophysiology of diabetic retinopathy, leading to the development of more targeted and effective therapies. Technological disruptions are profoundly impacting the industry, with innovations in gene therapy, sustained-release drug delivery systems, and intravitreal injections revolutionizing treatment paradigms. For instance, the development of longer-acting Anti-VEGF agents is reducing the frequency of injections, thereby improving patient compliance and quality of life. Evolving consumer behaviors, or rather patient preferences, are shifting towards treatments that offer better efficacy, fewer side effects, and improved visual acuity preservation. Early detection and proactive management of diabetes are also becoming paramount, indirectly influencing the demand for PDR treatments as the diabetic population expands. The increasing incidence of diabetic eye disease globally, coupled with a growing awareness among patients and healthcare providers about the importance of regular eye screenings, are key market drivers. Furthermore, reimbursement policies and government initiatives aimed at managing chronic diseases are also contributing to market expansion. The market is witnessing a paradigm shift from traditional laser photocoagulation to pharmacotherapy, particularly Anti-VEGF agents, due to their superior efficacy in reducing neovascularization and intraretinal fluid.
Key Markets & Segments Leading Proliferative Diabetic Retinopathy Industry
The Anti-VEGF Agents segment is the undisputed leader within the Proliferative Diabetic Retinopathy (PDR) industry, commanding a substantial market share due to its proven efficacy in inhibiting the growth of new blood vessels in the retina. This dominance is further propelled by the increasing global prevalence of diabetes mellitus, a primary risk factor for PDR.
- Drivers for Anti-VEGF Agent Dominance:
- High Efficacy: Proven ability to significantly reduce neovascularization and preserve vision.
- Minimally Invasive Nature: Intravitreal injections are generally well-tolerated and require less downtime compared to traditional laser surgery.
- Growing Diabetic Population: The escalating global rates of diabetes directly translate to a larger patient pool requiring PDR treatment.
- Technological Advancements: Development of longer-acting formulations reducing injection frequency and improving patient compliance.
- Favorable Reimbursement Policies: Growing recognition and coverage for Anti-VEGF therapies by healthcare systems globally.
Regionally, North America and Europe currently lead the PDR market, driven by a high prevalence of diabetes, advanced healthcare infrastructure, robust R&D investments, and favorable regulatory environments that facilitate the adoption of new treatments. The United States, in particular, represents a significant market due to its large diabetic population and high healthcare spending. Asia-Pacific is emerging as a high-growth region, fueled by rising diabetes rates, improving healthcare access, and increasing awareness of diabetic eye disease.
Within the Treatment Type segmentation, Anti-VEGF agents consistently outperform other modalities. While Corticosteroids offer an alternative, their use is often limited by potential side effects such as elevated intraocular pressure and cataract formation. Laser Surgery, though a foundational treatment, is increasingly being supplanted by pharmacotherapy for its ability to address the underlying molecular drivers of neovascularization more effectively. The 'Others' segment encompasses emerging therapies and adjunctive treatments, which are gaining traction but do not yet rival the market penetration of Anti-VEGF agents. The economic growth in developing nations, coupled with increased investment in healthcare infrastructure, is creating fertile ground for market expansion across all treatment types, albeit with a strong preference for the more advanced Anti-VEGF therapies.
Proliferative Diabetic Retinopathy Industry Product Developments
Product development in the Proliferative Diabetic Retinopathy (PDR) industry is heavily focused on enhancing the efficacy and duration of action of existing therapies, alongside exploring novel treatment modalities. Key innovations include the development of sustained-release intravitreal implants that deliver Anti-VEGF agents over extended periods, reducing the need for frequent injections. Furthermore, research is progressing on gene therapies and novel molecular targets that aim to address the root causes of neovascularization more comprehensively. These advancements are driven by the need to improve patient outcomes, minimize treatment burden, and offer more personalized therapeutic approaches, thereby creating a competitive edge for companies at the forefront of innovation.
Challenges in the Proliferative Diabetic Retinopathy Industry Market
The Proliferative Diabetic Retinopathy (PDR) industry faces several significant challenges. Regulatory hurdles can slow down the approval process for novel therapies, requiring extensive and costly clinical trials. Supply chain complexities for specialized ophthalmic drugs, particularly for sustained-release formulations, can impact market availability and cost. Intense competitive pressures among established and emerging players necessitate continuous innovation and strategic pricing. Furthermore, the high cost of advanced treatments can create access barriers for certain patient populations, particularly in lower-income regions, limiting market penetration.
Forces Driving Proliferative Diabetic Retinopathy Industry Growth
Several forces are propelling the growth of the Proliferative Diabetic Retinopathy (PDR) industry. The increasing global prevalence of diabetes mellitus is the most significant demographic driver, directly increasing the at-risk population. Technological advancements in drug delivery systems and therapeutic agents, such as longer-acting Anti-VEGF formulations and investigational gene therapies, are improving treatment efficacy and patient convenience. Growing awareness and early detection initiatives for diabetic eye disease are leading to earlier diagnosis and intervention. Favorable reimbursement policies and increased healthcare expenditure in key markets are further facilitating access to advanced PDR treatments.
Challenges in the Proliferative Diabetic Retinopathy Industry Market
Long-term growth catalysts in the Proliferative Diabetic Retinopathy (PDR) industry are intrinsically linked to continued innovation in therapeutic modalities. The exploration of novel biological targets beyond VEGF, coupled with advancements in regenerative medicine and gene therapy, holds immense potential to revolutionize PDR treatment. Strategic partnerships and collaborations between pharmaceutical giants and innovative biotechnology firms will accelerate the development and commercialization of these cutting-edge therapies. Furthermore, market expansion into emerging economies with a rising diabetes burden, supported by improved healthcare infrastructure and increasing disposable incomes, will unlock significant untapped growth potential.
Emerging Opportunities in Proliferative Diabetic Retinopathy Industry
Emerging opportunities in the Proliferative Diabetic Retinopathy (PDR) industry lie in the development of ultra-long-acting drug delivery systems that could potentially reduce the need for injections to once or twice a year. The investigation of novel therapeutic targets beyond VEGF, such as anti-inflammatory agents or anti-angiogenic pathways, presents a significant avenue for differentiated therapies. The increasing adoption of artificial intelligence (AI) and machine learning (ML) in diagnostic imaging and treatment response prediction offers opportunities for personalized medicine and improved patient management. Furthermore, the untapped potential of emerging markets with a high and growing diabetic population represents a substantial area for future growth and market penetration.
Leading Players in the Proliferative Diabetic Retinopathy Industry Sector
- Hoffmann-La Roche (Genentech)
- Regeneron Pharmaceuticals Inc
- Kowa Group
- Novartis AG
- Glycadia Pharmaceuticals
- Oxurion NV
- Alimera Sciences
- Allergan Plc
- BCN Peptides
Key Milestones in Proliferative Diabetic Retinopathy Industry Industry
- 2019: Approval of sustained-release dexamethasone implants for diabetic macular edema, impacting PDR management.
- 2020: Significant advancements in clinical trials for novel Anti-VEGF agents with extended half-lives.
- 2021: Increased focus on combination therapies and exploring genetic predispositions to PDR.
- 2022: Regulatory approvals for new formulations of established Anti-VEGF drugs, offering improved patient convenience.
- 2023: Growing interest and early-stage research into gene therapy for PDR.
- 2024: Strategic partnerships formed to accelerate the development of next-generation PDR treatments.
Strategic Outlook for Proliferative Diabetic Retinopathy Industry Market
The strategic outlook for the Proliferative Diabetic Retinopathy (PDR) Industry is exceptionally strong, driven by the relentless increase in diabetes prevalence and continuous innovation. Growth accelerators include the development and adoption of extended-duration therapies, significantly reducing treatment burden and improving patient adherence. Strategic opportunities also lie in geographic expansion into under-served markets and the development of targeted therapies that address specific patient subgroups with higher precision. The industry is expected to witness further consolidation and partnerships as companies vie for leadership in delivering superior vision preservation outcomes for millions affected by this debilitating condition.
Proliferative Diabetic Retinopathy Industry Segmentation
-
1. Treatment Type
- 1.1. Anti-VEGF Agents
- 1.2. Corticosteroids
- 1.3. Laser Surgery
- 1.4. Others
Proliferative Diabetic Retinopathy Industry Segmentation By Geography
-
1. North America
- 1.1. United States
- 1.2. Canada
- 1.3. Mexico
-
2. Europe
- 2.1. Germany
- 2.2. United Kingdom
- 2.3. France
- 2.4. Italy
- 2.5. Spain
- 2.6. Rest of Europe
-
3. Asia Pacific
- 3.1. China
- 3.2. Japan
- 3.3. India
- 3.4. Australia
- 3.5. South Korea
- 3.6. Rest of Asia Pacific
-
4. Middle East and Africa
- 4.1. GCC
- 4.2. South Africa
- 4.3. Rest of Middle East and Africa
-
5. South America
- 5.1. Brazil
- 5.2. Argentina
- 5.3. Rest of South America
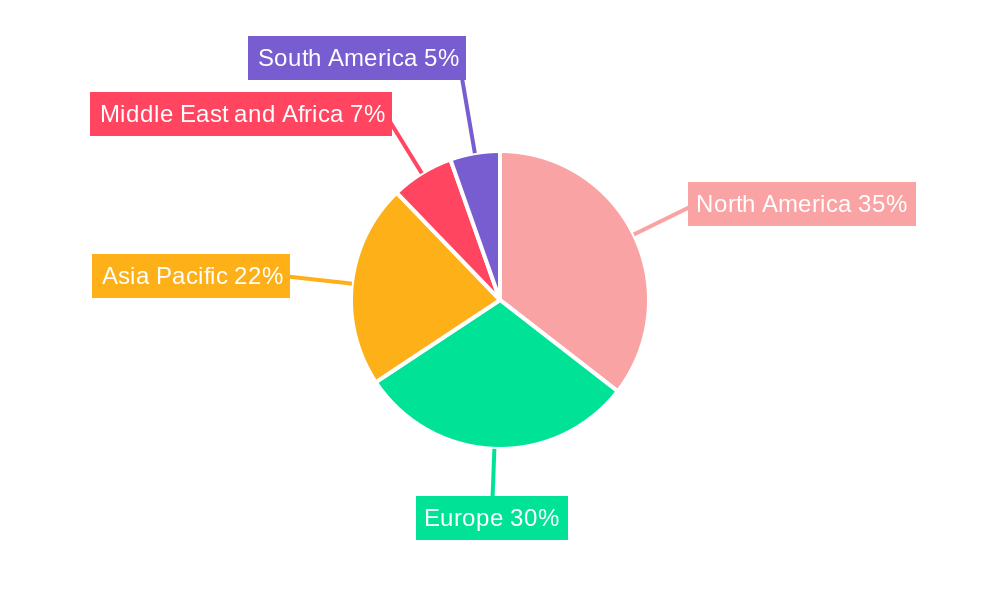
Proliferative Diabetic Retinopathy Industry Regional Market Share
Geographic Coverage of Proliferative Diabetic Retinopathy Industry
Proliferative Diabetic Retinopathy Industry REPORT HIGHLIGHTS
| Aspects | Details |
|---|---|
| Study Period | 2020-2034 |
| Base Year | 2025 |
| Estimated Year | 2026 |
| Forecast Period | 2026-2034 |
| Historical Period | 2020-2025 |
| Growth Rate | CAGR of 6.4% from 2020-2034 |
| Segmentation |
|
Table of Contents
- 1. Introduction
- 1.1. Research Scope
- 1.2. Market Segmentation
- 1.3. Research Methodology
- 1.4. Definitions and Assumptions
- 2. Executive Summary
- 2.1. Introduction
- 3. Market Dynamics
- 3.1. Introduction
- 3.2. Market Drivers
- 3.2.1. ; Rising Prevalence of Diabetes Increases Risk of Diabetic Retinopathy; Availability of Advanced Technology and Minimally Invasive Laser Technique
- 3.3. Market Restrains
- 3.3.1. ; Extended Approval Time for Drugs
- 3.4. Market Trends
- 3.4.1. Anti-VEGF Agents Segment is Expected to Witness a Healthy CAGR
- 4. Market Factor Analysis
- 4.1. Porters Five Forces
- 4.2. Supply/Value Chain
- 4.3. PESTEL analysis
- 4.4. Market Entropy
- 4.5. Patent/Trademark Analysis
- 5. Global Proliferative Diabetic Retinopathy Industry Analysis, Insights and Forecast, 2020-2032
- 5.1. Market Analysis, Insights and Forecast - by Treatment Type
- 5.1.1. Anti-VEGF Agents
- 5.1.2. Corticosteroids
- 5.1.3. Laser Surgery
- 5.1.4. Others
- 5.2. Market Analysis, Insights and Forecast - by Region
- 5.2.1. North America
- 5.2.2. Europe
- 5.2.3. Asia Pacific
- 5.2.4. Middle East and Africa
- 5.2.5. South America
- 5.1. Market Analysis, Insights and Forecast - by Treatment Type
- 6. North America Proliferative Diabetic Retinopathy Industry Analysis, Insights and Forecast, 2020-2032
- 6.1. Market Analysis, Insights and Forecast - by Treatment Type
- 6.1.1. Anti-VEGF Agents
- 6.1.2. Corticosteroids
- 6.1.3. Laser Surgery
- 6.1.4. Others
- 6.1. Market Analysis, Insights and Forecast - by Treatment Type
- 7. Europe Proliferative Diabetic Retinopathy Industry Analysis, Insights and Forecast, 2020-2032
- 7.1. Market Analysis, Insights and Forecast - by Treatment Type
- 7.1.1. Anti-VEGF Agents
- 7.1.2. Corticosteroids
- 7.1.3. Laser Surgery
- 7.1.4. Others
- 7.1. Market Analysis, Insights and Forecast - by Treatment Type
- 8. Asia Pacific Proliferative Diabetic Retinopathy Industry Analysis, Insights and Forecast, 2020-2032
- 8.1. Market Analysis, Insights and Forecast - by Treatment Type
- 8.1.1. Anti-VEGF Agents
- 8.1.2. Corticosteroids
- 8.1.3. Laser Surgery
- 8.1.4. Others
- 8.1. Market Analysis, Insights and Forecast - by Treatment Type
- 9. Middle East and Africa Proliferative Diabetic Retinopathy Industry Analysis, Insights and Forecast, 2020-2032
- 9.1. Market Analysis, Insights and Forecast - by Treatment Type
- 9.1.1. Anti-VEGF Agents
- 9.1.2. Corticosteroids
- 9.1.3. Laser Surgery
- 9.1.4. Others
- 9.1. Market Analysis, Insights and Forecast - by Treatment Type
- 10. South America Proliferative Diabetic Retinopathy Industry Analysis, Insights and Forecast, 2020-2032
- 10.1. Market Analysis, Insights and Forecast - by Treatment Type
- 10.1.1. Anti-VEGF Agents
- 10.1.2. Corticosteroids
- 10.1.3. Laser Surgery
- 10.1.4. Others
- 10.1. Market Analysis, Insights and Forecast - by Treatment Type
- 11. Competitive Analysis
- 11.1. Global Market Share Analysis 2025
- 11.2. Company Profiles
- 11.2.1 Hoffmann-La Roche (Genentech)
- 11.2.1.1. Overview
- 11.2.1.2. Products
- 11.2.1.3. SWOT Analysis
- 11.2.1.4. Recent Developments
- 11.2.1.5. Financials (Based on Availability)
- 11.2.2 Regeneron Pharmaceuticals Inc
- 11.2.2.1. Overview
- 11.2.2.2. Products
- 11.2.2.3. SWOT Analysis
- 11.2.2.4. Recent Developments
- 11.2.2.5. Financials (Based on Availability)
- 11.2.3 Kowa Group
- 11.2.3.1. Overview
- 11.2.3.2. Products
- 11.2.3.3. SWOT Analysis
- 11.2.3.4. Recent Developments
- 11.2.3.5. Financials (Based on Availability)
- 11.2.4 Novartis AG
- 11.2.4.1. Overview
- 11.2.4.2. Products
- 11.2.4.3. SWOT Analysis
- 11.2.4.4. Recent Developments
- 11.2.4.5. Financials (Based on Availability)
- 11.2.5 Glycadia Pharmaceuticals
- 11.2.5.1. Overview
- 11.2.5.2. Products
- 11.2.5.3. SWOT Analysis
- 11.2.5.4. Recent Developments
- 11.2.5.5. Financials (Based on Availability)
- 11.2.6 Oxurion NV
- 11.2.6.1. Overview
- 11.2.6.2. Products
- 11.2.6.3. SWOT Analysis
- 11.2.6.4. Recent Developments
- 11.2.6.5. Financials (Based on Availability)
- 11.2.7 Alimera Sciences
- 11.2.7.1. Overview
- 11.2.7.2. Products
- 11.2.7.3. SWOT Analysis
- 11.2.7.4. Recent Developments
- 11.2.7.5. Financials (Based on Availability)
- 11.2.8 Allergan Plc
- 11.2.8.1. Overview
- 11.2.8.2. Products
- 11.2.8.3. SWOT Analysis
- 11.2.8.4. Recent Developments
- 11.2.8.5. Financials (Based on Availability)
- 11.2.9 BCN Peptides
- 11.2.9.1. Overview
- 11.2.9.2. Products
- 11.2.9.3. SWOT Analysis
- 11.2.9.4. Recent Developments
- 11.2.9.5. Financials (Based on Availability)
- 11.2.1 Hoffmann-La Roche (Genentech)
List of Figures
- Figure 1: Global Proliferative Diabetic Retinopathy Industry Revenue Breakdown (undefined, %) by Region 2025 & 2033
- Figure 2: Global Proliferative Diabetic Retinopathy Industry Volume Breakdown (K Unit, %) by Region 2025 & 2033
- Figure 3: North America Proliferative Diabetic Retinopathy Industry Revenue (undefined), by Treatment Type 2025 & 2033
- Figure 4: North America Proliferative Diabetic Retinopathy Industry Volume (K Unit), by Treatment Type 2025 & 2033
- Figure 5: North America Proliferative Diabetic Retinopathy Industry Revenue Share (%), by Treatment Type 2025 & 2033
- Figure 6: North America Proliferative Diabetic Retinopathy Industry Volume Share (%), by Treatment Type 2025 & 2033
- Figure 7: North America Proliferative Diabetic Retinopathy Industry Revenue (undefined), by Country 2025 & 2033
- Figure 8: North America Proliferative Diabetic Retinopathy Industry Volume (K Unit), by Country 2025 & 2033
- Figure 9: North America Proliferative Diabetic Retinopathy Industry Revenue Share (%), by Country 2025 & 2033
- Figure 10: North America Proliferative Diabetic Retinopathy Industry Volume Share (%), by Country 2025 & 2033
- Figure 11: Europe Proliferative Diabetic Retinopathy Industry Revenue (undefined), by Treatment Type 2025 & 2033
- Figure 12: Europe Proliferative Diabetic Retinopathy Industry Volume (K Unit), by Treatment Type 2025 & 2033
- Figure 13: Europe Proliferative Diabetic Retinopathy Industry Revenue Share (%), by Treatment Type 2025 & 2033
- Figure 14: Europe Proliferative Diabetic Retinopathy Industry Volume Share (%), by Treatment Type 2025 & 2033
- Figure 15: Europe Proliferative Diabetic Retinopathy Industry Revenue (undefined), by Country 2025 & 2033
- Figure 16: Europe Proliferative Diabetic Retinopathy Industry Volume (K Unit), by Country 2025 & 2033
- Figure 17: Europe Proliferative Diabetic Retinopathy Industry Revenue Share (%), by Country 2025 & 2033
- Figure 18: Europe Proliferative Diabetic Retinopathy Industry Volume Share (%), by Country 2025 & 2033
- Figure 19: Asia Pacific Proliferative Diabetic Retinopathy Industry Revenue (undefined), by Treatment Type 2025 & 2033
- Figure 20: Asia Pacific Proliferative Diabetic Retinopathy Industry Volume (K Unit), by Treatment Type 2025 & 2033
- Figure 21: Asia Pacific Proliferative Diabetic Retinopathy Industry Revenue Share (%), by Treatment Type 2025 & 2033
- Figure 22: Asia Pacific Proliferative Diabetic Retinopathy Industry Volume Share (%), by Treatment Type 2025 & 2033
- Figure 23: Asia Pacific Proliferative Diabetic Retinopathy Industry Revenue (undefined), by Country 2025 & 2033
- Figure 24: Asia Pacific Proliferative Diabetic Retinopathy Industry Volume (K Unit), by Country 2025 & 2033
- Figure 25: Asia Pacific Proliferative Diabetic Retinopathy Industry Revenue Share (%), by Country 2025 & 2033
- Figure 26: Asia Pacific Proliferative Diabetic Retinopathy Industry Volume Share (%), by Country 2025 & 2033
- Figure 27: Middle East and Africa Proliferative Diabetic Retinopathy Industry Revenue (undefined), by Treatment Type 2025 & 2033
- Figure 28: Middle East and Africa Proliferative Diabetic Retinopathy Industry Volume (K Unit), by Treatment Type 2025 & 2033
- Figure 29: Middle East and Africa Proliferative Diabetic Retinopathy Industry Revenue Share (%), by Treatment Type 2025 & 2033
- Figure 30: Middle East and Africa Proliferative Diabetic Retinopathy Industry Volume Share (%), by Treatment Type 2025 & 2033
- Figure 31: Middle East and Africa Proliferative Diabetic Retinopathy Industry Revenue (undefined), by Country 2025 & 2033
- Figure 32: Middle East and Africa Proliferative Diabetic Retinopathy Industry Volume (K Unit), by Country 2025 & 2033
- Figure 33: Middle East and Africa Proliferative Diabetic Retinopathy Industry Revenue Share (%), by Country 2025 & 2033
- Figure 34: Middle East and Africa Proliferative Diabetic Retinopathy Industry Volume Share (%), by Country 2025 & 2033
- Figure 35: South America Proliferative Diabetic Retinopathy Industry Revenue (undefined), by Treatment Type 2025 & 2033
- Figure 36: South America Proliferative Diabetic Retinopathy Industry Volume (K Unit), by Treatment Type 2025 & 2033
- Figure 37: South America Proliferative Diabetic Retinopathy Industry Revenue Share (%), by Treatment Type 2025 & 2033
- Figure 38: South America Proliferative Diabetic Retinopathy Industry Volume Share (%), by Treatment Type 2025 & 2033
- Figure 39: South America Proliferative Diabetic Retinopathy Industry Revenue (undefined), by Country 2025 & 2033
- Figure 40: South America Proliferative Diabetic Retinopathy Industry Volume (K Unit), by Country 2025 & 2033
- Figure 41: South America Proliferative Diabetic Retinopathy Industry Revenue Share (%), by Country 2025 & 2033
- Figure 42: South America Proliferative Diabetic Retinopathy Industry Volume Share (%), by Country 2025 & 2033
List of Tables
- Table 1: Global Proliferative Diabetic Retinopathy Industry Revenue undefined Forecast, by Treatment Type 2020 & 2033
- Table 2: Global Proliferative Diabetic Retinopathy Industry Volume K Unit Forecast, by Treatment Type 2020 & 2033
- Table 3: Global Proliferative Diabetic Retinopathy Industry Revenue undefined Forecast, by Region 2020 & 2033
- Table 4: Global Proliferative Diabetic Retinopathy Industry Volume K Unit Forecast, by Region 2020 & 2033
- Table 5: Global Proliferative Diabetic Retinopathy Industry Revenue undefined Forecast, by Treatment Type 2020 & 2033
- Table 6: Global Proliferative Diabetic Retinopathy Industry Volume K Unit Forecast, by Treatment Type 2020 & 2033
- Table 7: Global Proliferative Diabetic Retinopathy Industry Revenue undefined Forecast, by Country 2020 & 2033
- Table 8: Global Proliferative Diabetic Retinopathy Industry Volume K Unit Forecast, by Country 2020 & 2033
- Table 9: United States Proliferative Diabetic Retinopathy Industry Revenue (undefined) Forecast, by Application 2020 & 2033
- Table 10: United States Proliferative Diabetic Retinopathy Industry Volume (K Unit) Forecast, by Application 2020 & 2033
- Table 11: Canada Proliferative Diabetic Retinopathy Industry Revenue (undefined) Forecast, by Application 2020 & 2033
- Table 12: Canada Proliferative Diabetic Retinopathy Industry Volume (K Unit) Forecast, by Application 2020 & 2033
- Table 13: Mexico Proliferative Diabetic Retinopathy Industry Revenue (undefined) Forecast, by Application 2020 & 2033
- Table 14: Mexico Proliferative Diabetic Retinopathy Industry Volume (K Unit) Forecast, by Application 2020 & 2033
- Table 15: Global Proliferative Diabetic Retinopathy Industry Revenue undefined Forecast, by Treatment Type 2020 & 2033
- Table 16: Global Proliferative Diabetic Retinopathy Industry Volume K Unit Forecast, by Treatment Type 2020 & 2033
- Table 17: Global Proliferative Diabetic Retinopathy Industry Revenue undefined Forecast, by Country 2020 & 2033
- Table 18: Global Proliferative Diabetic Retinopathy Industry Volume K Unit Forecast, by Country 2020 & 2033
- Table 19: Germany Proliferative Diabetic Retinopathy Industry Revenue (undefined) Forecast, by Application 2020 & 2033
- Table 20: Germany Proliferative Diabetic Retinopathy Industry Volume (K Unit) Forecast, by Application 2020 & 2033
- Table 21: United Kingdom Proliferative Diabetic Retinopathy Industry Revenue (undefined) Forecast, by Application 2020 & 2033
- Table 22: United Kingdom Proliferative Diabetic Retinopathy Industry Volume (K Unit) Forecast, by Application 2020 & 2033
- Table 23: France Proliferative Diabetic Retinopathy Industry Revenue (undefined) Forecast, by Application 2020 & 2033
- Table 24: France Proliferative Diabetic Retinopathy Industry Volume (K Unit) Forecast, by Application 2020 & 2033
- Table 25: Italy Proliferative Diabetic Retinopathy Industry Revenue (undefined) Forecast, by Application 2020 & 2033
- Table 26: Italy Proliferative Diabetic Retinopathy Industry Volume (K Unit) Forecast, by Application 2020 & 2033
- Table 27: Spain Proliferative Diabetic Retinopathy Industry Revenue (undefined) Forecast, by Application 2020 & 2033
- Table 28: Spain Proliferative Diabetic Retinopathy Industry Volume (K Unit) Forecast, by Application 2020 & 2033
- Table 29: Rest of Europe Proliferative Diabetic Retinopathy Industry Revenue (undefined) Forecast, by Application 2020 & 2033
- Table 30: Rest of Europe Proliferative Diabetic Retinopathy Industry Volume (K Unit) Forecast, by Application 2020 & 2033
- Table 31: Global Proliferative Diabetic Retinopathy Industry Revenue undefined Forecast, by Treatment Type 2020 & 2033
- Table 32: Global Proliferative Diabetic Retinopathy Industry Volume K Unit Forecast, by Treatment Type 2020 & 2033
- Table 33: Global Proliferative Diabetic Retinopathy Industry Revenue undefined Forecast, by Country 2020 & 2033
- Table 34: Global Proliferative Diabetic Retinopathy Industry Volume K Unit Forecast, by Country 2020 & 2033
- Table 35: China Proliferative Diabetic Retinopathy Industry Revenue (undefined) Forecast, by Application 2020 & 2033
- Table 36: China Proliferative Diabetic Retinopathy Industry Volume (K Unit) Forecast, by Application 2020 & 2033
- Table 37: Japan Proliferative Diabetic Retinopathy Industry Revenue (undefined) Forecast, by Application 2020 & 2033
- Table 38: Japan Proliferative Diabetic Retinopathy Industry Volume (K Unit) Forecast, by Application 2020 & 2033
- Table 39: India Proliferative Diabetic Retinopathy Industry Revenue (undefined) Forecast, by Application 2020 & 2033
- Table 40: India Proliferative Diabetic Retinopathy Industry Volume (K Unit) Forecast, by Application 2020 & 2033
- Table 41: Australia Proliferative Diabetic Retinopathy Industry Revenue (undefined) Forecast, by Application 2020 & 2033
- Table 42: Australia Proliferative Diabetic Retinopathy Industry Volume (K Unit) Forecast, by Application 2020 & 2033
- Table 43: South Korea Proliferative Diabetic Retinopathy Industry Revenue (undefined) Forecast, by Application 2020 & 2033
- Table 44: South Korea Proliferative Diabetic Retinopathy Industry Volume (K Unit) Forecast, by Application 2020 & 2033
- Table 45: Rest of Asia Pacific Proliferative Diabetic Retinopathy Industry Revenue (undefined) Forecast, by Application 2020 & 2033
- Table 46: Rest of Asia Pacific Proliferative Diabetic Retinopathy Industry Volume (K Unit) Forecast, by Application 2020 & 2033
- Table 47: Global Proliferative Diabetic Retinopathy Industry Revenue undefined Forecast, by Treatment Type 2020 & 2033
- Table 48: Global Proliferative Diabetic Retinopathy Industry Volume K Unit Forecast, by Treatment Type 2020 & 2033
- Table 49: Global Proliferative Diabetic Retinopathy Industry Revenue undefined Forecast, by Country 2020 & 2033
- Table 50: Global Proliferative Diabetic Retinopathy Industry Volume K Unit Forecast, by Country 2020 & 2033
- Table 51: GCC Proliferative Diabetic Retinopathy Industry Revenue (undefined) Forecast, by Application 2020 & 2033
- Table 52: GCC Proliferative Diabetic Retinopathy Industry Volume (K Unit) Forecast, by Application 2020 & 2033
- Table 53: South Africa Proliferative Diabetic Retinopathy Industry Revenue (undefined) Forecast, by Application 2020 & 2033
- Table 54: South Africa Proliferative Diabetic Retinopathy Industry Volume (K Unit) Forecast, by Application 2020 & 2033
- Table 55: Rest of Middle East and Africa Proliferative Diabetic Retinopathy Industry Revenue (undefined) Forecast, by Application 2020 & 2033
- Table 56: Rest of Middle East and Africa Proliferative Diabetic Retinopathy Industry Volume (K Unit) Forecast, by Application 2020 & 2033
- Table 57: Global Proliferative Diabetic Retinopathy Industry Revenue undefined Forecast, by Treatment Type 2020 & 2033
- Table 58: Global Proliferative Diabetic Retinopathy Industry Volume K Unit Forecast, by Treatment Type 2020 & 2033
- Table 59: Global Proliferative Diabetic Retinopathy Industry Revenue undefined Forecast, by Country 2020 & 2033
- Table 60: Global Proliferative Diabetic Retinopathy Industry Volume K Unit Forecast, by Country 2020 & 2033
- Table 61: Brazil Proliferative Diabetic Retinopathy Industry Revenue (undefined) Forecast, by Application 2020 & 2033
- Table 62: Brazil Proliferative Diabetic Retinopathy Industry Volume (K Unit) Forecast, by Application 2020 & 2033
- Table 63: Argentina Proliferative Diabetic Retinopathy Industry Revenue (undefined) Forecast, by Application 2020 & 2033
- Table 64: Argentina Proliferative Diabetic Retinopathy Industry Volume (K Unit) Forecast, by Application 2020 & 2033
- Table 65: Rest of South America Proliferative Diabetic Retinopathy Industry Revenue (undefined) Forecast, by Application 2020 & 2033
- Table 66: Rest of South America Proliferative Diabetic Retinopathy Industry Volume (K Unit) Forecast, by Application 2020 & 2033
Frequently Asked Questions
1. What is the projected Compound Annual Growth Rate (CAGR) of the Proliferative Diabetic Retinopathy Industry?
The projected CAGR is approximately 6.4%.
2. Which companies are prominent players in the Proliferative Diabetic Retinopathy Industry?
Key companies in the market include Hoffmann-La Roche (Genentech), Regeneron Pharmaceuticals Inc, Kowa Group, Novartis AG, Glycadia Pharmaceuticals, Oxurion NV, Alimera Sciences, Allergan Plc, BCN Peptides.
3. What are the main segments of the Proliferative Diabetic Retinopathy Industry?
The market segments include Treatment Type.
4. Can you provide details about the market size?
The market size is estimated to be USD XXX N/A as of 2022.
5. What are some drivers contributing to market growth?
; Rising Prevalence of Diabetes Increases Risk of Diabetic Retinopathy; Availability of Advanced Technology and Minimally Invasive Laser Technique.
6. What are the notable trends driving market growth?
Anti-VEGF Agents Segment is Expected to Witness a Healthy CAGR.
7. Are there any restraints impacting market growth?
; Extended Approval Time for Drugs.
8. Can you provide examples of recent developments in the market?
N/A
9. What pricing options are available for accessing the report?
Pricing options include single-user, multi-user, and enterprise licenses priced at USD 4750, USD 5250, and USD 8750 respectively.
10. Is the market size provided in terms of value or volume?
The market size is provided in terms of value, measured in N/A and volume, measured in K Unit.
11. Are there any specific market keywords associated with the report?
Yes, the market keyword associated with the report is "Proliferative Diabetic Retinopathy Industry," which aids in identifying and referencing the specific market segment covered.
12. How do I determine which pricing option suits my needs best?
The pricing options vary based on user requirements and access needs. Individual users may opt for single-user licenses, while businesses requiring broader access may choose multi-user or enterprise licenses for cost-effective access to the report.
13. Are there any additional resources or data provided in the Proliferative Diabetic Retinopathy Industry report?
While the report offers comprehensive insights, it's advisable to review the specific contents or supplementary materials provided to ascertain if additional resources or data are available.
14. How can I stay updated on further developments or reports in the Proliferative Diabetic Retinopathy Industry?
To stay informed about further developments, trends, and reports in the Proliferative Diabetic Retinopathy Industry, consider subscribing to industry newsletters, following relevant companies and organizations, or regularly checking reputable industry news sources and publications.
Methodology
Step 1 - Identification of Relevant Samples Size from Population Database


Step 2 - Approaches for Defining Global Market Size (Value, Volume* & Price*)

Note*: In applicable scenarios
Step 3 - Data Sources
Primary Research
- Web Analytics
- Survey Reports
- Research Institute
- Latest Research Reports
- Opinion Leaders
Secondary Research
- Annual Reports
- White Paper
- Latest Press Release
- Industry Association
- Paid Database
- Investor Presentations

Step 4 - Data Triangulation
Involves using different sources of information in order to increase the validity of a study
These sources are likely to be stakeholders in a program - participants, other researchers, program staff, other community members, and so on.
Then we put all data in single framework & apply various statistical tools to find out the dynamic on the market.
During the analysis stage, feedback from the stakeholder groups would be compared to determine areas of agreement as well as areas of divergence