

Key Insights
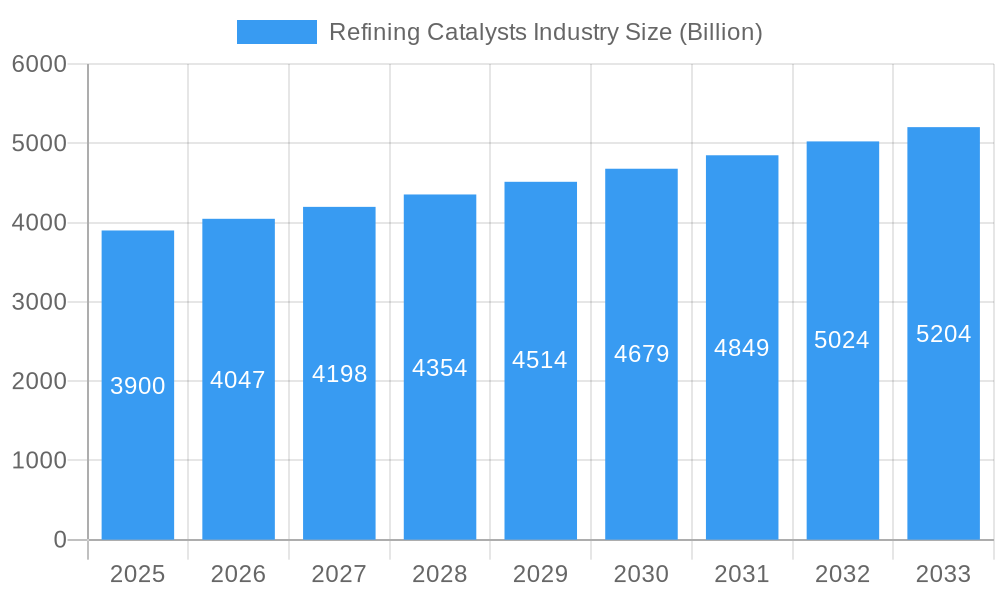
The refining catalysts market, valued at $3.9 billion in 2025, is projected to experience robust growth, driven by increasing demand for cleaner fuels and stricter environmental regulations globally. A compound annual growth rate (CAGR) of 3.69% from 2025 to 2033 indicates a steady expansion, primarily fueled by the rising adoption of advanced hydroprocessing technologies like hydrotreating and hydrocracking. The market's segmentation reveals significant opportunities across various catalyst types, including CoMo, NiMo, alumina-based noble metals, NiW, and zeolites, each catering to specific refining processes and feedstock requirements. The growth is further spurred by the expansion of refineries in developing economies, particularly in the Asia-Pacific region, coupled with ongoing technological advancements leading to the development of more efficient and environmentally friendly catalysts. Major players like Axens, Topsoe, and ExxonMobil are actively investing in R&D and strategic partnerships to maintain their market share and capitalize on emerging trends.
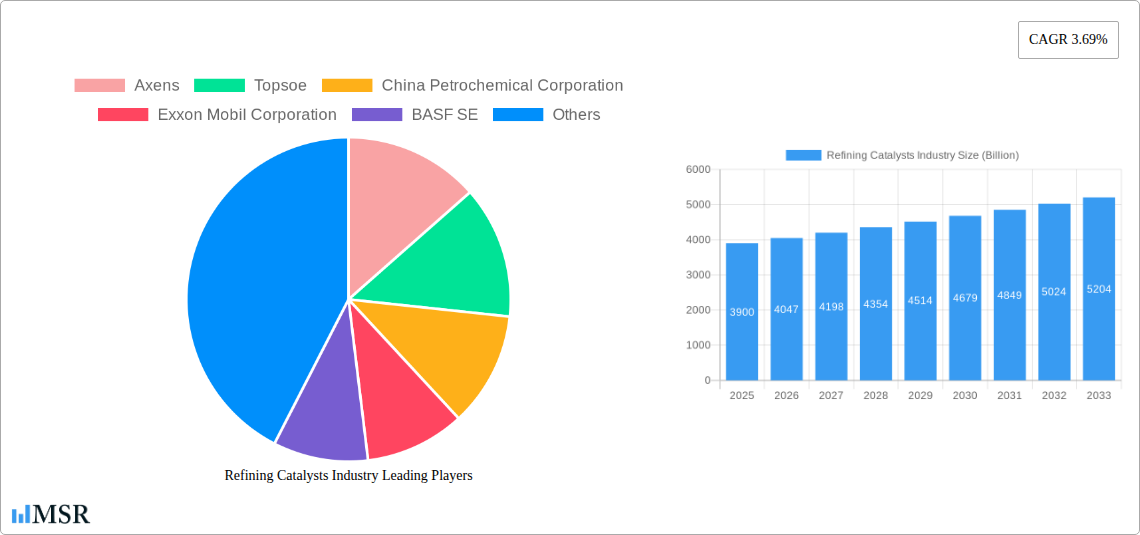
Refining Catalysts Industry Market Size (In Billion)
The substantial growth in the refining catalysts market is also influenced by the increasing complexity of crude oil, necessitating more efficient and versatile catalysts for optimal processing. The shift towards heavier and more sulfur-rich feedstocks further accelerates demand for high-performance catalysts. While factors like fluctuating crude oil prices and economic downturns can act as restraints, the long-term outlook remains positive due to the irreversible trend towards cleaner fuels and enhanced refining efficiency. The market's regional distribution indicates a significant presence in North America and Europe, but the Asia-Pacific region is expected to show the most substantial growth due to its rapidly expanding refining capacity and increasing energy consumption. Competitive intensity remains high, with companies focused on innovation, cost optimization, and strategic acquisitions to gain a competitive edge.
Refining Catalysts Industry Company Market Share
Refining Catalysts Market Report: A Comprehensive Analysis (2019-2033)
This comprehensive report provides an in-depth analysis of the global refining catalysts market, offering invaluable insights for industry stakeholders, investors, and strategic decision-makers. With a study period spanning 2019-2033, a base year of 2025, and a forecast period of 2025-2033, this report leverages rigorous research methodologies to present a detailed overview of market dynamics, segment performance, and future growth prospects. The global market size is projected to reach approximately $XX Billion by 2033.
Refining Catalysts Industry Market Concentration & Dynamics
The refining catalysts market is characterized by a moderately concentrated landscape, with several key players holding significant market share. Axens, Topsoe, and China Petrochemical Corporation are among the leading companies, collectively accounting for an estimated xx% of the global market share in 2024. The market exhibits a dynamic ecosystem, influenced by ongoing technological innovations, stringent environmental regulations, and evolving end-user demands.
- Market Share: Top 5 players hold approximately xx% of the global market.
- M&A Activity: The historical period (2019-2024) witnessed xx major mergers and acquisitions, primarily driven by strategic expansion and technological integration. This activity is projected to continue, with an estimated xx deals expected during the forecast period.
- Innovation Ecosystem: Significant investments in R&D are fostering the development of advanced catalysts with enhanced efficiency and sustainability features. The focus is shifting towards catalysts optimized for processing heavier feedstocks and producing cleaner fuels.
- Regulatory Frameworks: Stringent environmental regulations, particularly concerning sulfur content in fuels, are driving the demand for high-performance hydroprocessing catalysts. This is further incentivized by growing emphasis on reducing greenhouse gas emissions.
- Substitute Products: While limited direct substitutes exist, the industry faces pressure from alternative refining technologies and biofuel production methods.
- End-User Trends: The increasing demand for cleaner fuels and the shift towards processing heavier crude oil are major drivers of market growth.
Refining Catalysts Industry Industry Insights & Trends
The global refining catalysts market is experiencing substantial growth, driven by several key factors. The market size was valued at approximately $XX Billion in 2024, and it is projected to register a CAGR of xx% during the forecast period (2025-2033). This growth is fueled by increasing global oil consumption, the expansion of refining capacities in developing economies, and the ongoing transition to cleaner fuels. Technological advancements, particularly in the development of more efficient and environmentally friendly catalysts, are playing a significant role in shaping market dynamics. Consumer behavior, characterized by a growing preference for cleaner and more sustainable energy sources, is further driving demand for advanced refining catalysts. The ongoing shift towards processing heavier crude oils also presents significant growth opportunities for the industry. The industry is also adapting to the challenges of fluctuating crude oil prices and the increasing complexity of feedstocks.
Key Markets & Segments Leading Refining Catalysts Industry
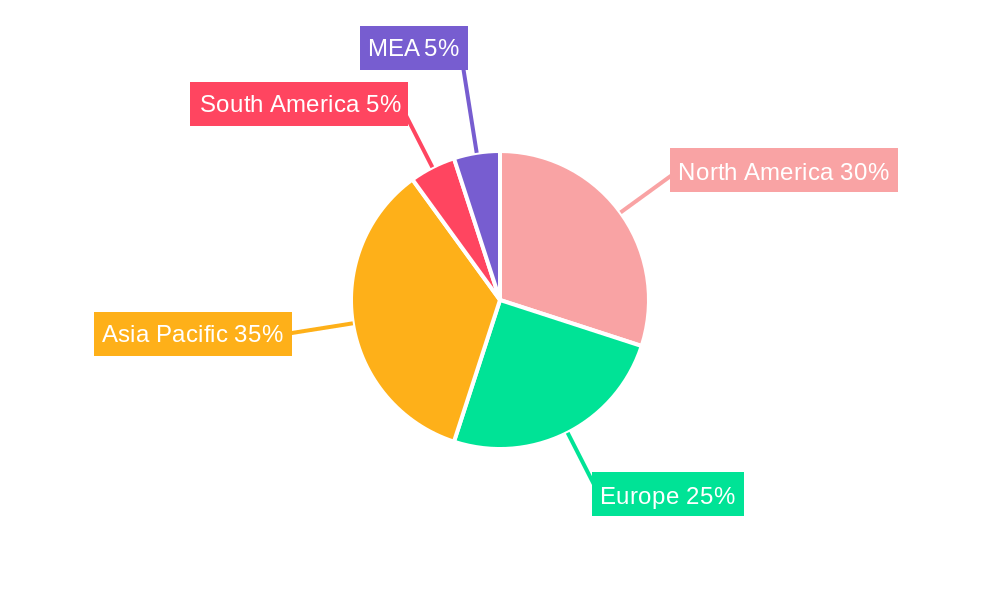
The Asia-Pacific region currently holds the largest market share, followed by North America and Europe. This dominance is driven by factors such as rapid economic growth, expanding refining capacity, and stringent environmental regulations.
Product Segments:
- Hydrotreating Catalysts (CoMo, NiMo, NiW): This segment commands a significant market share, driven by the widespread adoption of hydrotreating processes in refineries worldwide. Growth is fueled by the increasing demand for low-sulfur fuels.
- Fluid Catalytic Cracking (FCC) Catalysts (Alumina-based Noble Metal, Zeolites): The FCC catalyst segment is also experiencing robust growth, propelled by the need for efficient conversion of heavy oil fractions into valuable products.
- Other Products: This segment includes catalysts used in other refining processes such as isomerization, alkylation, and reforming. Growth in this segment is driven by the increasing demand for specialized fuels and petrochemicals.
Process Segments:
- Hydrotreating: The dominant process segment due to its crucial role in removing sulfur and other contaminants from petroleum feedstocks.
- Fluid Catalytic Cracking (FCC) & Residue Fluid Catalytic Cracking (RFCC): These processes are essential for converting heavy oil fractions into lighter, more valuable products. Growth is spurred by the shift towards processing heavier crude oil.
- Hydrocracking: This process is becoming increasingly important for upgrading heavy oil and producing high-quality diesel fuels.
Regional Drivers:
- Asia-Pacific: Rapid economic growth, increasing energy consumption, and expanding refining capacity.
- North America: Stringent environmental regulations and investments in upgrading existing refineries.
- Europe: Focus on cleaner fuels and the adoption of advanced refining technologies.
Refining Catalysts Industry Product Developments
Recent years have witnessed significant advancements in refining catalyst technology, focusing on improving efficiency, selectivity, and sustainability. The introduction of new catalyst formulations, such as BASF's Fourtitude FCC catalyst, exemplifies the industry's commitment to innovation. These advancements provide refiners with the tools to process heavier feedstocks, improve product yields, and minimize environmental impact. Companies are also investing in developing catalysts with enhanced resistance to poisoning and deactivation, enhancing their longevity and reducing operational costs.
Challenges in the Refining Catalysts Industry Market
The refining catalysts market faces several challenges, including stringent environmental regulations that necessitate continuous technological innovation, fluctuations in raw material prices impacting production costs, and intense competition among major players. Supply chain disruptions due to geopolitical instability and the COVID-19 pandemic have also impacted market dynamics. Furthermore, refiners are increasingly focusing on optimizing their operations and reducing costs, putting pressure on catalyst suppliers to provide cost-effective solutions. This has led to a more competitive pricing environment.
Forces Driving Refining Catalysts Industry Growth
Several factors are driving growth in the refining catalysts industry, including rising global energy demand, especially in emerging economies. Stringent environmental regulations, such as sulfur content limits in fuels, are creating strong demand for advanced hydroprocessing catalysts. Technological advancements, including the development of more efficient and selective catalysts, are enabling refiners to maximize product yields and improve profitability. The growing trend towards processing heavier, more complex crude oil further stimulates demand for advanced catalysts capable of handling these challenging feedstocks.
Long-Term Growth Catalysts in the Refining Catalysts Industry
Long-term growth in the refining catalysts market hinges on several key factors. Continued technological innovation, leading to more efficient, sustainable, and cost-effective catalysts, will be crucial. Strategic partnerships and collaborations between catalyst manufacturers and refining companies will foster the development and deployment of next-generation technologies. Expansion into new markets, particularly in developing regions, and the development of catalysts tailored to specific regional feedstock characteristics will also drive long-term growth.
Emerging Opportunities in Refining Catalysts Industry
The refining catalysts market presents several exciting opportunities. The growing demand for cleaner fuels, particularly in response to climate change concerns, drives the need for advanced catalysts that enhance the efficiency of processes like hydroprocessing and reduce emissions. The processing of heavier crude oils and unconventional resources requires robust and adaptable catalysts, providing opportunities for companies to develop specialized solutions. Exploring new catalyst materials and innovative catalyst designs can lead to breakthroughs in efficiency and sustainability, further enhancing market potential.
Leading Players in the Refining Catalysts Industry Sector
- Axens
- Topsoe
- China Petrochemical Corporation
- Exxon Mobil Corporation
- BASF SE
- Honeywell International
- Chevron Lummus Global (CLG)
- JGC C & C
- Royal Dutch Shell PLC
- Johnson Matthey
- KNT Group
- W R Grace & Co -Conn
- Albemarle Corporation
Key Milestones in Refining Catalysts Industry Industry
- March 2022: BASF launched Fourtitude, a new Fluid Catalytic Cracking (FCC) catalyst designed to maximize butylenes from resid feedstocks. This launch highlights the industry's focus on developing catalysts tailored for specific applications and maximizing valuable product yields.
Strategic Outlook for Refining Catalysts Industry Market
The future of the refining catalysts market appears promising, driven by continued growth in global energy consumption and the ongoing transition to cleaner fuels. Strategic investments in R&D, coupled with strategic partnerships and collaborations, will be essential for companies to maintain a competitive edge. Focus on developing sustainable and cost-effective catalyst solutions, along with expansion into new markets, presents significant growth opportunities for players in this dynamic industry. The market is expected to continue its upward trajectory, driven by technological advancements and changing regulatory landscapes.
Refining Catalysts Industry Segmentation
-
1. Product
- 1.1. CoMo
- 1.2. NiMo
- 1.3. Alumina-based Noble Metal
- 1.4. NiW
- 1.5. Zeolites
- 1.6. Other Products
-
2. Process
-
2.1. Hydrotreating
- 2.1.1. Gasoline
- 2.1.2. Kerosene
- 2.1.3. Diesel
- 2.1.4. Vacuum Gas Oil
- 2.1.5. Catalytic Cracking Gasoline
- 2.1.6. Residual Feed
- 2.2. Fluid Catalytic Cracking (FCC)
- 2.3. Residue Fluid Catalytic Cracking (RFCC)
- 2.4. Hydrocracking
-
2.1. Hydrotreating
Refining Catalysts Industry Segmentation By Geography
-
1. Asia Pacific
- 1.1. China
- 1.2. India
- 1.3. Japan
- 1.4. South Korea
- 1.5. ASEAN Countries
- 1.6. Rest of Asia Pacific
-
2. North America
- 2.1. United States
- 2.2. Canada
- 2.3. Mexico
-
3. Europe
- 3.1. Germany
- 3.2. United Kingdom
- 3.3. Italy
- 3.4. France
- 3.5. Spain
- 3.6. Russia
- 3.7. Rest of Europe
-
4. South America
- 4.1. Brazil
- 4.2. Argentina
- 4.3. Rest of South America
-
5. Middle East and Africa
- 5.1. Saudi Arabia
- 5.2. South Africa
- 5.3. Rest of Middle East and Africa
Refining Catalysts Industry Regional Market Share
Geographic Coverage of Refining Catalysts Industry
Refining Catalysts Industry REPORT HIGHLIGHTS
| Aspects | Details |
|---|---|
| Study Period | 2020-2034 |
| Base Year | 2025 |
| Estimated Year | 2026 |
| Forecast Period | 2026-2034 |
| Historical Period | 2020-2025 |
| Growth Rate | CAGR of 3.69% from 2020-2034 |
| Segmentation |
|
Table of Contents
- 1. Introduction
- 1.1. Research Scope
- 1.2. Market Segmentation
- 1.3. Research Objective
- 1.4. Definitions and Assumptions
- 2. Executive Summary
- 2.1. Market Snapshot
- 3. Market Dynamics
- 3.1. Market Drivers
- 3.2. Market Restrains
- 3.3. Market Trends
- 3.4. Market Opportunities
- 4. Market Factor Analysis
- 4.1. Porters Five Forces
- 4.1.1. Bargaining Power of Suppliers
- 4.1.2. Bargaining Power of Buyers
- 4.1.3. Threat of New Entrants
- 4.1.4. Threat of Substitutes
- 4.1.5. Competitive Rivalry
- 4.2. PESTEL analysis
- 4.3. BCG Analysis
- 4.3.1. Stars (High Growth, High Market Share)
- 4.3.2. Cash Cows (Low Growth, High Market Share)
- 4.3.3. Question Mark (High Growth, Low Market Share)
- 4.3.4. Dogs (Low Growth, Low Market Share)
- 4.4. Ansoff Matrix Analysis
- 4.5. Supply Chain Analysis
- 4.6. Regulatory Landscape
- 4.7. Current Market Potential and Opportunity Assessment (TAM–SAM–SOM Framework)
- 4.8. MSR Analyst Note
- 4.1. Porters Five Forces
- 5. Market Analysis, Insights and Forecast 2021-2033
- 5.1. Market Analysis, Insights and Forecast - by Product
- 5.1.1. CoMo
- 5.1.2. NiMo
- 5.1.3. Alumina-based Noble Metal
- 5.1.4. NiW
- 5.1.5. Zeolites
- 5.1.6. Other Products
- 5.2. Market Analysis, Insights and Forecast - by Process
- 5.2.1. Hydrotreating
- 5.2.1.1. Gasoline
- 5.2.1.2. Kerosene
- 5.2.1.3. Diesel
- 5.2.1.4. Vacuum Gas Oil
- 5.2.1.5. Catalytic Cracking Gasoline
- 5.2.1.6. Residual Feed
- 5.2.2. Fluid Catalytic Cracking (FCC)
- 5.2.3. Residue Fluid Catalytic Cracking (RFCC)
- 5.2.4. Hydrocracking
- 5.2.1. Hydrotreating
- 5.3. Market Analysis, Insights and Forecast - by Region
- 5.3.1. Asia Pacific
- 5.3.2. North America
- 5.3.3. Europe
- 5.3.4. South America
- 5.3.5. Middle East and Africa
- 5.1. Market Analysis, Insights and Forecast - by Product
- 6. Global Refining Catalysts Industry Analysis, Insights and Forecast, 2021-2033
- 6.1. Market Analysis, Insights and Forecast - by Product
- 6.1.1. CoMo
- 6.1.2. NiMo
- 6.1.3. Alumina-based Noble Metal
- 6.1.4. NiW
- 6.1.5. Zeolites
- 6.1.6. Other Products
- 6.2. Market Analysis, Insights and Forecast - by Process
- 6.2.1. Hydrotreating
- 6.2.1.1. Gasoline
- 6.2.1.2. Kerosene
- 6.2.1.3. Diesel
- 6.2.1.4. Vacuum Gas Oil
- 6.2.1.5. Catalytic Cracking Gasoline
- 6.2.1.6. Residual Feed
- 6.2.2. Fluid Catalytic Cracking (FCC)
- 6.2.3. Residue Fluid Catalytic Cracking (RFCC)
- 6.2.4. Hydrocracking
- 6.2.1. Hydrotreating
- 6.1. Market Analysis, Insights and Forecast - by Product
- 7. Asia Pacific Refining Catalysts Industry Analysis, Insights and Forecast, 2020-2032
- 7.1. Market Analysis, Insights and Forecast - by Product
- 7.1.1. CoMo
- 7.1.2. NiMo
- 7.1.3. Alumina-based Noble Metal
- 7.1.4. NiW
- 7.1.5. Zeolites
- 7.1.6. Other Products
- 7.2. Market Analysis, Insights and Forecast - by Process
- 7.2.1. Hydrotreating
- 7.2.1.1. Gasoline
- 7.2.1.2. Kerosene
- 7.2.1.3. Diesel
- 7.2.1.4. Vacuum Gas Oil
- 7.2.1.5. Catalytic Cracking Gasoline
- 7.2.1.6. Residual Feed
- 7.2.2. Fluid Catalytic Cracking (FCC)
- 7.2.3. Residue Fluid Catalytic Cracking (RFCC)
- 7.2.4. Hydrocracking
- 7.2.1. Hydrotreating
- 7.1. Market Analysis, Insights and Forecast - by Product
- 8. North America Refining Catalysts Industry Analysis, Insights and Forecast, 2020-2032
- 8.1. Market Analysis, Insights and Forecast - by Product
- 8.1.1. CoMo
- 8.1.2. NiMo
- 8.1.3. Alumina-based Noble Metal
- 8.1.4. NiW
- 8.1.5. Zeolites
- 8.1.6. Other Products
- 8.2. Market Analysis, Insights and Forecast - by Process
- 8.2.1. Hydrotreating
- 8.2.1.1. Gasoline
- 8.2.1.2. Kerosene
- 8.2.1.3. Diesel
- 8.2.1.4. Vacuum Gas Oil
- 8.2.1.5. Catalytic Cracking Gasoline
- 8.2.1.6. Residual Feed
- 8.2.2. Fluid Catalytic Cracking (FCC)
- 8.2.3. Residue Fluid Catalytic Cracking (RFCC)
- 8.2.4. Hydrocracking
- 8.2.1. Hydrotreating
- 8.1. Market Analysis, Insights and Forecast - by Product
- 9. Europe Refining Catalysts Industry Analysis, Insights and Forecast, 2020-2032
- 9.1. Market Analysis, Insights and Forecast - by Product
- 9.1.1. CoMo
- 9.1.2. NiMo
- 9.1.3. Alumina-based Noble Metal
- 9.1.4. NiW
- 9.1.5. Zeolites
- 9.1.6. Other Products
- 9.2. Market Analysis, Insights and Forecast - by Process
- 9.2.1. Hydrotreating
- 9.2.1.1. Gasoline
- 9.2.1.2. Kerosene
- 9.2.1.3. Diesel
- 9.2.1.4. Vacuum Gas Oil
- 9.2.1.5. Catalytic Cracking Gasoline
- 9.2.1.6. Residual Feed
- 9.2.2. Fluid Catalytic Cracking (FCC)
- 9.2.3. Residue Fluid Catalytic Cracking (RFCC)
- 9.2.4. Hydrocracking
- 9.2.1. Hydrotreating
- 9.1. Market Analysis, Insights and Forecast - by Product
- 10. South America Refining Catalysts Industry Analysis, Insights and Forecast, 2020-2032
- 10.1. Market Analysis, Insights and Forecast - by Product
- 10.1.1. CoMo
- 10.1.2. NiMo
- 10.1.3. Alumina-based Noble Metal
- 10.1.4. NiW
- 10.1.5. Zeolites
- 10.1.6. Other Products
- 10.2. Market Analysis, Insights and Forecast - by Process
- 10.2.1. Hydrotreating
- 10.2.1.1. Gasoline
- 10.2.1.2. Kerosene
- 10.2.1.3. Diesel
- 10.2.1.4. Vacuum Gas Oil
- 10.2.1.5. Catalytic Cracking Gasoline
- 10.2.1.6. Residual Feed
- 10.2.2. Fluid Catalytic Cracking (FCC)
- 10.2.3. Residue Fluid Catalytic Cracking (RFCC)
- 10.2.4. Hydrocracking
- 10.2.1. Hydrotreating
- 10.1. Market Analysis, Insights and Forecast - by Product
- 11. Middle East and Africa Refining Catalysts Industry Analysis, Insights and Forecast, 2020-2032
- 11.1. Market Analysis, Insights and Forecast - by Product
- 11.1.1. CoMo
- 11.1.2. NiMo
- 11.1.3. Alumina-based Noble Metal
- 11.1.4. NiW
- 11.1.5. Zeolites
- 11.1.6. Other Products
- 11.2. Market Analysis, Insights and Forecast - by Process
- 11.2.1. Hydrotreating
- 11.2.1.1. Gasoline
- 11.2.1.2. Kerosene
- 11.2.1.3. Diesel
- 11.2.1.4. Vacuum Gas Oil
- 11.2.1.5. Catalytic Cracking Gasoline
- 11.2.1.6. Residual Feed
- 11.2.2. Fluid Catalytic Cracking (FCC)
- 11.2.3. Residue Fluid Catalytic Cracking (RFCC)
- 11.2.4. Hydrocracking
- 11.2.1. Hydrotreating
- 11.1. Market Analysis, Insights and Forecast - by Product
- 12. Competitive Analysis
- 12.1. Company Profiles
- 12.1.1 Axens
- 12.1.1.1. Company Overview
- 12.1.1.2. Products
- 12.1.1.3. Company Financials
- 12.1.1.4. SWOT Analysis
- 12.1.2 Topsoe
- 12.1.2.1. Company Overview
- 12.1.2.2. Products
- 12.1.2.3. Company Financials
- 12.1.2.4. SWOT Analysis
- 12.1.3 China Petrochemical Corporation
- 12.1.3.1. Company Overview
- 12.1.3.2. Products
- 12.1.3.3. Company Financials
- 12.1.3.4. SWOT Analysis
- 12.1.4 Exxon Mobil Corporation
- 12.1.4.1. Company Overview
- 12.1.4.2. Products
- 12.1.4.3. Company Financials
- 12.1.4.4. SWOT Analysis
- 12.1.5 BASF SE
- 12.1.5.1. Company Overview
- 12.1.5.2. Products
- 12.1.5.3. Company Financials
- 12.1.5.4. SWOT Analysis
- 12.1.6 Honeywell International
- 12.1.6.1. Company Overview
- 12.1.6.2. Products
- 12.1.6.3. Company Financials
- 12.1.6.4. SWOT Analysis
- 12.1.7 Chevron Lummus Global (CLG)
- 12.1.7.1. Company Overview
- 12.1.7.2. Products
- 12.1.7.3. Company Financials
- 12.1.7.4. SWOT Analysis
- 12.1.8 JGC C & C
- 12.1.8.1. Company Overview
- 12.1.8.2. Products
- 12.1.8.3. Company Financials
- 12.1.8.4. SWOT Analysis
- 12.1.9 Royal Dutch Shell PLC
- 12.1.9.1. Company Overview
- 12.1.9.2. Products
- 12.1.9.3. Company Financials
- 12.1.9.4. SWOT Analysis
- 12.1.10 Johnson Matthey
- 12.1.10.1. Company Overview
- 12.1.10.2. Products
- 12.1.10.3. Company Financials
- 12.1.10.4. SWOT Analysis
- 12.1.11 KNT Group
- 12.1.11.1. Company Overview
- 12.1.11.2. Products
- 12.1.11.3. Company Financials
- 12.1.11.4. SWOT Analysis
- 12.1.12 W R Grace & Co -Conn
- 12.1.12.1. Company Overview
- 12.1.12.2. Products
- 12.1.12.3. Company Financials
- 12.1.12.4. SWOT Analysis
- 12.1.13 Albemarle Corporation
- 12.1.13.1. Company Overview
- 12.1.13.2. Products
- 12.1.13.3. Company Financials
- 12.1.13.4. SWOT Analysis
- 12.1.1 Axens
- 12.2. Market Entropy
- 12.2.1 Company's Key Areas Served
- 12.2.2 Recent Developments
- 12.3. Company Market Share Analysis 2025
- 12.3.1 Top 5 Companies Market Share Analysis
- 12.3.2 Top 3 Companies Market Share Analysis
- 12.4. List of Potential Customers
- 13. Research Methodology
List of Figures
- Figure 1: Global Refining Catalysts Industry Revenue Breakdown (Billion, %) by Region 2025 & 2033
- Figure 2: Global Refining Catalysts Industry Volume Breakdown (K Tons, %) by Region 2025 & 2033
- Figure 3: Asia Pacific Refining Catalysts Industry Revenue (Billion), by Product 2025 & 2033
- Figure 4: Asia Pacific Refining Catalysts Industry Volume (K Tons), by Product 2025 & 2033
- Figure 5: Asia Pacific Refining Catalysts Industry Revenue Share (%), by Product 2025 & 2033
- Figure 6: Asia Pacific Refining Catalysts Industry Volume Share (%), by Product 2025 & 2033
- Figure 7: Asia Pacific Refining Catalysts Industry Revenue (Billion), by Process 2025 & 2033
- Figure 8: Asia Pacific Refining Catalysts Industry Volume (K Tons), by Process 2025 & 2033
- Figure 9: Asia Pacific Refining Catalysts Industry Revenue Share (%), by Process 2025 & 2033
- Figure 10: Asia Pacific Refining Catalysts Industry Volume Share (%), by Process 2025 & 2033
- Figure 11: Asia Pacific Refining Catalysts Industry Revenue (Billion), by Country 2025 & 2033
- Figure 12: Asia Pacific Refining Catalysts Industry Volume (K Tons), by Country 2025 & 2033
- Figure 13: Asia Pacific Refining Catalysts Industry Revenue Share (%), by Country 2025 & 2033
- Figure 14: Asia Pacific Refining Catalysts Industry Volume Share (%), by Country 2025 & 2033
- Figure 15: North America Refining Catalysts Industry Revenue (Billion), by Product 2025 & 2033
- Figure 16: North America Refining Catalysts Industry Volume (K Tons), by Product 2025 & 2033
- Figure 17: North America Refining Catalysts Industry Revenue Share (%), by Product 2025 & 2033
- Figure 18: North America Refining Catalysts Industry Volume Share (%), by Product 2025 & 2033
- Figure 19: North America Refining Catalysts Industry Revenue (Billion), by Process 2025 & 2033
- Figure 20: North America Refining Catalysts Industry Volume (K Tons), by Process 2025 & 2033
- Figure 21: North America Refining Catalysts Industry Revenue Share (%), by Process 2025 & 2033
- Figure 22: North America Refining Catalysts Industry Volume Share (%), by Process 2025 & 2033
- Figure 23: North America Refining Catalysts Industry Revenue (Billion), by Country 2025 & 2033
- Figure 24: North America Refining Catalysts Industry Volume (K Tons), by Country 2025 & 2033
- Figure 25: North America Refining Catalysts Industry Revenue Share (%), by Country 2025 & 2033
- Figure 26: North America Refining Catalysts Industry Volume Share (%), by Country 2025 & 2033
- Figure 27: Europe Refining Catalysts Industry Revenue (Billion), by Product 2025 & 2033
- Figure 28: Europe Refining Catalysts Industry Volume (K Tons), by Product 2025 & 2033
- Figure 29: Europe Refining Catalysts Industry Revenue Share (%), by Product 2025 & 2033
- Figure 30: Europe Refining Catalysts Industry Volume Share (%), by Product 2025 & 2033
- Figure 31: Europe Refining Catalysts Industry Revenue (Billion), by Process 2025 & 2033
- Figure 32: Europe Refining Catalysts Industry Volume (K Tons), by Process 2025 & 2033
- Figure 33: Europe Refining Catalysts Industry Revenue Share (%), by Process 2025 & 2033
- Figure 34: Europe Refining Catalysts Industry Volume Share (%), by Process 2025 & 2033
- Figure 35: Europe Refining Catalysts Industry Revenue (Billion), by Country 2025 & 2033
- Figure 36: Europe Refining Catalysts Industry Volume (K Tons), by Country 2025 & 2033
- Figure 37: Europe Refining Catalysts Industry Revenue Share (%), by Country 2025 & 2033
- Figure 38: Europe Refining Catalysts Industry Volume Share (%), by Country 2025 & 2033
- Figure 39: South America Refining Catalysts Industry Revenue (Billion), by Product 2025 & 2033
- Figure 40: South America Refining Catalysts Industry Volume (K Tons), by Product 2025 & 2033
- Figure 41: South America Refining Catalysts Industry Revenue Share (%), by Product 2025 & 2033
- Figure 42: South America Refining Catalysts Industry Volume Share (%), by Product 2025 & 2033
- Figure 43: South America Refining Catalysts Industry Revenue (Billion), by Process 2025 & 2033
- Figure 44: South America Refining Catalysts Industry Volume (K Tons), by Process 2025 & 2033
- Figure 45: South America Refining Catalysts Industry Revenue Share (%), by Process 2025 & 2033
- Figure 46: South America Refining Catalysts Industry Volume Share (%), by Process 2025 & 2033
- Figure 47: South America Refining Catalysts Industry Revenue (Billion), by Country 2025 & 2033
- Figure 48: South America Refining Catalysts Industry Volume (K Tons), by Country 2025 & 2033
- Figure 49: South America Refining Catalysts Industry Revenue Share (%), by Country 2025 & 2033
- Figure 50: South America Refining Catalysts Industry Volume Share (%), by Country 2025 & 2033
- Figure 51: Middle East and Africa Refining Catalysts Industry Revenue (Billion), by Product 2025 & 2033
- Figure 52: Middle East and Africa Refining Catalysts Industry Volume (K Tons), by Product 2025 & 2033
- Figure 53: Middle East and Africa Refining Catalysts Industry Revenue Share (%), by Product 2025 & 2033
- Figure 54: Middle East and Africa Refining Catalysts Industry Volume Share (%), by Product 2025 & 2033
- Figure 55: Middle East and Africa Refining Catalysts Industry Revenue (Billion), by Process 2025 & 2033
- Figure 56: Middle East and Africa Refining Catalysts Industry Volume (K Tons), by Process 2025 & 2033
- Figure 57: Middle East and Africa Refining Catalysts Industry Revenue Share (%), by Process 2025 & 2033
- Figure 58: Middle East and Africa Refining Catalysts Industry Volume Share (%), by Process 2025 & 2033
- Figure 59: Middle East and Africa Refining Catalysts Industry Revenue (Billion), by Country 2025 & 2033
- Figure 60: Middle East and Africa Refining Catalysts Industry Volume (K Tons), by Country 2025 & 2033
- Figure 61: Middle East and Africa Refining Catalysts Industry Revenue Share (%), by Country 2025 & 2033
- Figure 62: Middle East and Africa Refining Catalysts Industry Volume Share (%), by Country 2025 & 2033
List of Tables
- Table 1: Global Refining Catalysts Industry Revenue Billion Forecast, by Product 2020 & 2033
- Table 2: Global Refining Catalysts Industry Volume K Tons Forecast, by Product 2020 & 2033
- Table 3: Global Refining Catalysts Industry Revenue Billion Forecast, by Process 2020 & 2033
- Table 4: Global Refining Catalysts Industry Volume K Tons Forecast, by Process 2020 & 2033
- Table 5: Global Refining Catalysts Industry Revenue Billion Forecast, by Region 2020 & 2033
- Table 6: Global Refining Catalysts Industry Volume K Tons Forecast, by Region 2020 & 2033
- Table 7: Global Refining Catalysts Industry Revenue Billion Forecast, by Product 2020 & 2033
- Table 8: Global Refining Catalysts Industry Volume K Tons Forecast, by Product 2020 & 2033
- Table 9: Global Refining Catalysts Industry Revenue Billion Forecast, by Process 2020 & 2033
- Table 10: Global Refining Catalysts Industry Volume K Tons Forecast, by Process 2020 & 2033
- Table 11: Global Refining Catalysts Industry Revenue Billion Forecast, by Country 2020 & 2033
- Table 12: Global Refining Catalysts Industry Volume K Tons Forecast, by Country 2020 & 2033
- Table 13: China Refining Catalysts Industry Revenue (Billion) Forecast, by Application 2020 & 2033
- Table 14: China Refining Catalysts Industry Volume (K Tons) Forecast, by Application 2020 & 2033
- Table 15: India Refining Catalysts Industry Revenue (Billion) Forecast, by Application 2020 & 2033
- Table 16: India Refining Catalysts Industry Volume (K Tons) Forecast, by Application 2020 & 2033
- Table 17: Japan Refining Catalysts Industry Revenue (Billion) Forecast, by Application 2020 & 2033
- Table 18: Japan Refining Catalysts Industry Volume (K Tons) Forecast, by Application 2020 & 2033
- Table 19: South Korea Refining Catalysts Industry Revenue (Billion) Forecast, by Application 2020 & 2033
- Table 20: South Korea Refining Catalysts Industry Volume (K Tons) Forecast, by Application 2020 & 2033
- Table 21: ASEAN Countries Refining Catalysts Industry Revenue (Billion) Forecast, by Application 2020 & 2033
- Table 22: ASEAN Countries Refining Catalysts Industry Volume (K Tons) Forecast, by Application 2020 & 2033
- Table 23: Rest of Asia Pacific Refining Catalysts Industry Revenue (Billion) Forecast, by Application 2020 & 2033
- Table 24: Rest of Asia Pacific Refining Catalysts Industry Volume (K Tons) Forecast, by Application 2020 & 2033
- Table 25: Global Refining Catalysts Industry Revenue Billion Forecast, by Product 2020 & 2033
- Table 26: Global Refining Catalysts Industry Volume K Tons Forecast, by Product 2020 & 2033
- Table 27: Global Refining Catalysts Industry Revenue Billion Forecast, by Process 2020 & 2033
- Table 28: Global Refining Catalysts Industry Volume K Tons Forecast, by Process 2020 & 2033
- Table 29: Global Refining Catalysts Industry Revenue Billion Forecast, by Country 2020 & 2033
- Table 30: Global Refining Catalysts Industry Volume K Tons Forecast, by Country 2020 & 2033
- Table 31: United States Refining Catalysts Industry Revenue (Billion) Forecast, by Application 2020 & 2033
- Table 32: United States Refining Catalysts Industry Volume (K Tons) Forecast, by Application 2020 & 2033
- Table 33: Canada Refining Catalysts Industry Revenue (Billion) Forecast, by Application 2020 & 2033
- Table 34: Canada Refining Catalysts Industry Volume (K Tons) Forecast, by Application 2020 & 2033
- Table 35: Mexico Refining Catalysts Industry Revenue (Billion) Forecast, by Application 2020 & 2033
- Table 36: Mexico Refining Catalysts Industry Volume (K Tons) Forecast, by Application 2020 & 2033
- Table 37: Global Refining Catalysts Industry Revenue Billion Forecast, by Product 2020 & 2033
- Table 38: Global Refining Catalysts Industry Volume K Tons Forecast, by Product 2020 & 2033
- Table 39: Global Refining Catalysts Industry Revenue Billion Forecast, by Process 2020 & 2033
- Table 40: Global Refining Catalysts Industry Volume K Tons Forecast, by Process 2020 & 2033
- Table 41: Global Refining Catalysts Industry Revenue Billion Forecast, by Country 2020 & 2033
- Table 42: Global Refining Catalysts Industry Volume K Tons Forecast, by Country 2020 & 2033
- Table 43: Germany Refining Catalysts Industry Revenue (Billion) Forecast, by Application 2020 & 2033
- Table 44: Germany Refining Catalysts Industry Volume (K Tons) Forecast, by Application 2020 & 2033
- Table 45: United Kingdom Refining Catalysts Industry Revenue (Billion) Forecast, by Application 2020 & 2033
- Table 46: United Kingdom Refining Catalysts Industry Volume (K Tons) Forecast, by Application 2020 & 2033
- Table 47: Italy Refining Catalysts Industry Revenue (Billion) Forecast, by Application 2020 & 2033
- Table 48: Italy Refining Catalysts Industry Volume (K Tons) Forecast, by Application 2020 & 2033
- Table 49: France Refining Catalysts Industry Revenue (Billion) Forecast, by Application 2020 & 2033
- Table 50: France Refining Catalysts Industry Volume (K Tons) Forecast, by Application 2020 & 2033
- Table 51: Spain Refining Catalysts Industry Revenue (Billion) Forecast, by Application 2020 & 2033
- Table 52: Spain Refining Catalysts Industry Volume (K Tons) Forecast, by Application 2020 & 2033
- Table 53: Russia Refining Catalysts Industry Revenue (Billion) Forecast, by Application 2020 & 2033
- Table 54: Russia Refining Catalysts Industry Volume (K Tons) Forecast, by Application 2020 & 2033
- Table 55: Rest of Europe Refining Catalysts Industry Revenue (Billion) Forecast, by Application 2020 & 2033
- Table 56: Rest of Europe Refining Catalysts Industry Volume (K Tons) Forecast, by Application 2020 & 2033
- Table 57: Global Refining Catalysts Industry Revenue Billion Forecast, by Product 2020 & 2033
- Table 58: Global Refining Catalysts Industry Volume K Tons Forecast, by Product 2020 & 2033
- Table 59: Global Refining Catalysts Industry Revenue Billion Forecast, by Process 2020 & 2033
- Table 60: Global Refining Catalysts Industry Volume K Tons Forecast, by Process 2020 & 2033
- Table 61: Global Refining Catalysts Industry Revenue Billion Forecast, by Country 2020 & 2033
- Table 62: Global Refining Catalysts Industry Volume K Tons Forecast, by Country 2020 & 2033
- Table 63: Brazil Refining Catalysts Industry Revenue (Billion) Forecast, by Application 2020 & 2033
- Table 64: Brazil Refining Catalysts Industry Volume (K Tons) Forecast, by Application 2020 & 2033
- Table 65: Argentina Refining Catalysts Industry Revenue (Billion) Forecast, by Application 2020 & 2033
- Table 66: Argentina Refining Catalysts Industry Volume (K Tons) Forecast, by Application 2020 & 2033
- Table 67: Rest of South America Refining Catalysts Industry Revenue (Billion) Forecast, by Application 2020 & 2033
- Table 68: Rest of South America Refining Catalysts Industry Volume (K Tons) Forecast, by Application 2020 & 2033
- Table 69: Global Refining Catalysts Industry Revenue Billion Forecast, by Product 2020 & 2033
- Table 70: Global Refining Catalysts Industry Volume K Tons Forecast, by Product 2020 & 2033
- Table 71: Global Refining Catalysts Industry Revenue Billion Forecast, by Process 2020 & 2033
- Table 72: Global Refining Catalysts Industry Volume K Tons Forecast, by Process 2020 & 2033
- Table 73: Global Refining Catalysts Industry Revenue Billion Forecast, by Country 2020 & 2033
- Table 74: Global Refining Catalysts Industry Volume K Tons Forecast, by Country 2020 & 2033
- Table 75: Saudi Arabia Refining Catalysts Industry Revenue (Billion) Forecast, by Application 2020 & 2033
- Table 76: Saudi Arabia Refining Catalysts Industry Volume (K Tons) Forecast, by Application 2020 & 2033
- Table 77: South Africa Refining Catalysts Industry Revenue (Billion) Forecast, by Application 2020 & 2033
- Table 78: South Africa Refining Catalysts Industry Volume (K Tons) Forecast, by Application 2020 & 2033
- Table 79: Rest of Middle East and Africa Refining Catalysts Industry Revenue (Billion) Forecast, by Application 2020 & 2033
- Table 80: Rest of Middle East and Africa Refining Catalysts Industry Volume (K Tons) Forecast, by Application 2020 & 2033
Frequently Asked Questions
1. What is the projected Compound Annual Growth Rate (CAGR) of the Refining Catalysts Industry?
The projected CAGR is approximately 3.69%.
2. Which companies are prominent players in the Refining Catalysts Industry?
Key companies in the market include Axens, Topsoe, China Petrochemical Corporation, Exxon Mobil Corporation, BASF SE, Honeywell International, Chevron Lummus Global (CLG), JGC C & C, Royal Dutch Shell PLC, Johnson Matthey, KNT Group, W R Grace & Co -Conn, Albemarle Corporation.
3. What are the main segments of the Refining Catalysts Industry?
The market segments include Product, Process.
4. Can you provide details about the market size?
The market size is estimated to be USD 3.9 Billion as of 2022.
5. What are some drivers contributing to market growth?
Accelerating Demand for Higher-Octane Fuel; Expansion of Oil and Gas Activities; Other Drivers.
6. What are the notable trends driving market growth?
Fluid Catalytic Cracking (FCC) Catalysts to Dominate the Market.
7. Are there any restraints impacting market growth?
Volatility in Precious Metal Prices; Other Restraints.
8. Can you provide examples of recent developments in the market?
March 2022: BASF launched Fourtitude, a new Fluid Catalytic Cracking (FCC) catalyst designed to maximize butylenes from resid feedstocks.
9. What pricing options are available for accessing the report?
Pricing options include single-user, multi-user, and enterprise licenses priced at USD 3,950, USD 4,950, and USD 6,950 respectively.
10. Is the market size provided in terms of value or volume?
The market size is provided in terms of value, measured in Billion and volume, measured in K Tons.
11. Are there any specific market keywords associated with the report?
Yes, the market keyword associated with the report is "Refining Catalysts Industry," which aids in identifying and referencing the specific market segment covered.
12. How do I determine which pricing option suits my needs best?
The pricing options vary based on user requirements and access needs. Individual users may opt for single-user licenses, while businesses requiring broader access may choose multi-user or enterprise licenses for cost-effective access to the report.
13. Are there any additional resources or data provided in the Refining Catalysts Industry report?
While the report offers comprehensive insights, it's advisable to review the specific contents or supplementary materials provided to ascertain if additional resources or data are available.
14. How can I stay updated on further developments or reports in the Refining Catalysts Industry?
To stay informed about further developments, trends, and reports in the Refining Catalysts Industry, consider subscribing to industry newsletters, following relevant companies and organizations, or regularly checking reputable industry news sources and publications.
Methodology
Step 1 - Identification of Relevant Samples Size from Population Database


Step 2 - Approaches for Defining Global Market Size (Value, Volume* & Price*)

Note*: In applicable scenarios
Step 3 - Data Sources
Primary Research
- Web Analytics
- Survey Reports
- Research Institute
- Latest Research Reports
- Opinion Leaders
Secondary Research
- Annual Reports
- White Paper
- Latest Press Release
- Industry Association
- Paid Database
- Investor Presentations

Step 4 - Data Triangulation
Involves using different sources of information in order to increase the validity of a study
These sources are likely to be stakeholders in a program - participants, other researchers, program staff, other community members, and so on.
Then we put all data in single framework & apply various statistical tools to find out the dynamic on the market.
During the analysis stage, feedback from the stakeholder groups would be compared to determine areas of agreement as well as areas of divergence