

Key Insights
The global rubber carbon black market is experiencing robust growth, driven by the increasing demand for tires, hoses, belts, and other rubber products across diverse industries. A compound annual growth rate (CAGR) exceeding 3% indicates a consistently expanding market, projected to reach significant value by 2033. Key growth drivers include the burgeoning automotive sector, particularly in developing economies like China and India, where vehicle ownership is rapidly increasing. Furthermore, the construction industry's reliance on rubber components for waterproofing and vibration damping contributes significantly to market expansion. Advances in carbon black technology, leading to improved performance characteristics like enhanced tensile strength and abrasion resistance, further stimulate demand. While fluctuating raw material prices and environmental regulations pose potential restraints, the overall market outlook remains positive, fueled by continuous innovation and expanding application areas in diverse sectors including footwear and industrial components. Major players like Tokai Carbon, Cabot Corporation, and Birla Carbon are strategically investing in capacity expansion and technological advancements to maintain their market share and capitalize on emerging opportunities. Regional variations exist, with the Asia-Pacific region, specifically China and India, holding a dominant market share due to their large manufacturing base and rapidly growing economies. North America and Europe also contribute significantly, maintaining substantial demand driven by established automotive and industrial sectors.
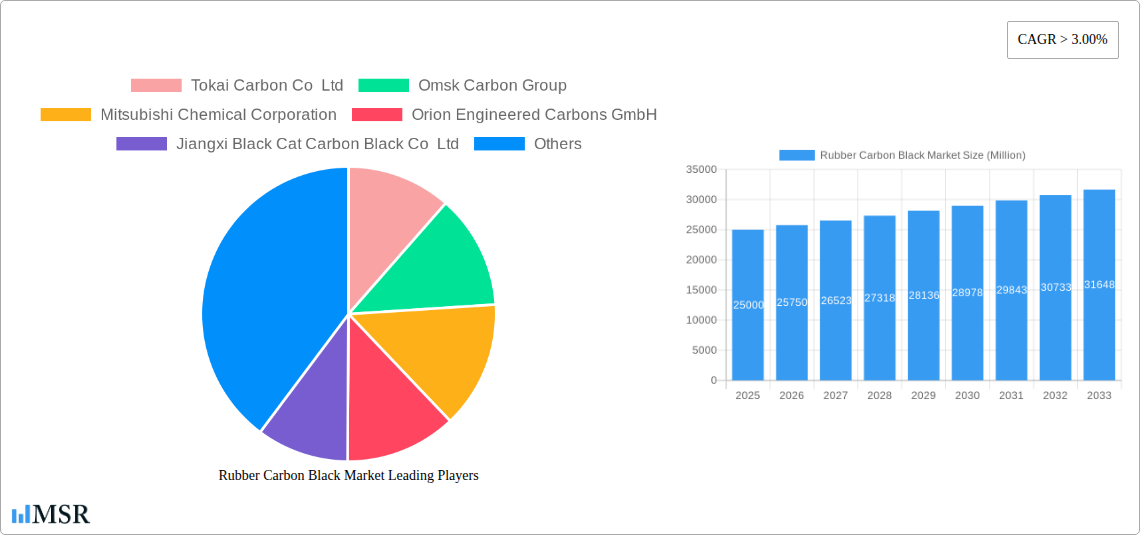
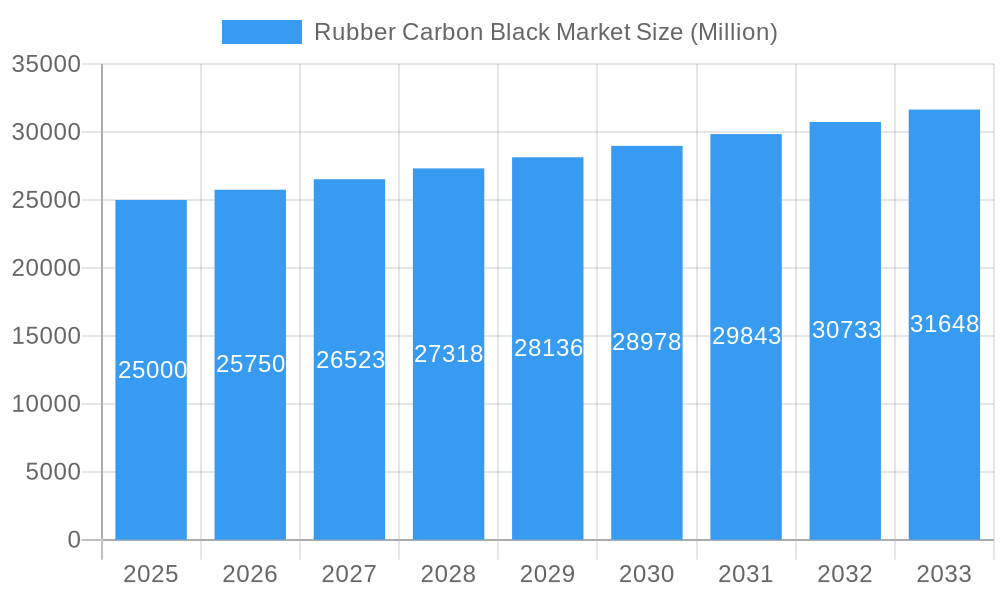
Rubber Carbon Black Market Market Size (In Billion)
The competitive landscape is marked by both large multinational corporations and regional players. Successful companies are focusing on diversification across product offerings and geographical markets, alongside strategic mergers and acquisitions to bolster their market position. The market is also witnessing a growing emphasis on sustainable manufacturing practices, with companies investing in technologies to reduce their environmental footprint and meet stringent regulatory requirements. Future market growth is anticipated to be influenced by trends such as the increasing adoption of electric vehicles, which require specialized rubber components, and the rising demand for high-performance tires and industrial rubber products that require superior carbon black formulations. Sustained investment in research and development aimed at improving the quality and sustainability of carbon black will remain crucial for market participants to gain a competitive edge.
Rubber Carbon Black Market Company Market Share
Rubber Carbon Black Market Report: 2019-2033
This comprehensive report provides an in-depth analysis of the Rubber Carbon Black Market, offering invaluable insights for industry stakeholders, investors, and businesses seeking to navigate this dynamic sector. Covering the period from 2019 to 2033, with a focus on 2025, this report delivers a data-driven perspective on market dynamics, trends, and future opportunities. The study period (2019-2024) provides historical context, while the forecast period (2025-2033) projects future growth based on rigorous analysis. The base year is 2025 and the estimated year is 2025.
Rubber Carbon Black Market Market Concentration & Dynamics
The Rubber Carbon Black market exhibits a moderately concentrated landscape, with several key players commanding significant market share. The competitive dynamics are shaped by factors including innovation in production processes, stringent regulatory frameworks concerning environmental impact, and the emergence of substitute materials. Market share data for 2025 (estimated) suggests that the top five players hold approximately xx% of the global market, highlighting the importance of strategic partnerships and M&A activities. The innovation ecosystem is characterized by ongoing research and development efforts focusing on sustainable and high-performance carbon blacks. Regulatory pressures, especially concerning environmental compliance, are driving companies to adopt cleaner production methods. The substitution of carbon black with alternative materials in specific applications is a noteworthy trend, although the superior properties of carbon black in many applications remain a key factor limiting substitution.
- Market Concentration: Top 5 players hold approximately xx% of the market (Estimated 2025).
- M&A Activity: A total of xx M&A deals were recorded between 2019 and 2024, indicating a moderate level of consolidation.
- Innovation Ecosystem: Focus on sustainable production methods and high-performance carbon blacks.
- Regulatory Frameworks: Stringent environmental regulations drive adoption of cleaner technologies.
- Substitute Products: Limited substitution due to the superior properties of carbon black in many applications.
- End-user Trends: Growing demand from the automotive and tire industries.
Rubber Carbon Black Market Industry Insights & Trends
The global Rubber Carbon Black market is experiencing substantial growth, driven by the burgeoning automotive industry and increasing demand for high-performance tires. The market size in 2025 is estimated at xx Million USD, reflecting a Compound Annual Growth Rate (CAGR) of xx% during the historical period (2019-2024). Technological advancements, such as the development of specialized carbon blacks for enhanced tire performance and fuel efficiency, are fueling market expansion. Furthermore, evolving consumer preferences towards eco-friendly products are pushing manufacturers to develop sustainable carbon black production processes. The global market size is projected to reach xx Million USD by 2033. This growth is fueled by technological advancements, rising demand from end-use sectors, and strategic partnerships within the industry.
Key Markets & Segments Leading Rubber Carbon Black Market
The tire industry remains the dominant segment, consuming the largest share of rubber carbon black, followed by hoses and belts. Growth in the Asia-Pacific region is notably strong, driven by substantial economic growth and rapid infrastructure development, particularly in countries like China and India.
- Dominant Region: Asia-Pacific, driven by robust economic growth and automotive industry expansion.
- Dominant Segment: Tires, accounting for approximately xx% of total consumption.
- Growth Drivers:
- Tires: Rising vehicle sales and demand for high-performance tires.
- Hoses & Belts: Expansion of industrial automation and infrastructure projects.
- Gaskets: Growth in construction and manufacturing sectors.
- Vibration Control: Increasing demand for advanced damping solutions in automotive and industrial applications.
- Footwear: Growing popularity of athletic and performance footwear.
Rubber Carbon Black Market Product Developments
Recent product innovations include the development of ECORAX Nature by Orion Engineered Carbon, a plant-based carbon black for rubber applications, showcasing a move towards sustainable materials. Other advancements focus on enhancing the properties of carbon black to improve tire performance, fuel efficiency, and durability. These innovations provide companies with a significant competitive edge in the market, enabling them to meet increasing demand for sustainable and high-performance products.
Challenges in the Rubber Carbon Black Market Market
The Rubber Carbon Black market faces challenges including fluctuating raw material prices, stringent environmental regulations leading to increased production costs, and intense competition among established players. Supply chain disruptions and volatility in global energy markets further impact production and pricing. These factors can restrict market growth and reduce profit margins for industry participants.
Forces Driving Rubber Carbon Black Market Growth
Key drivers include increasing demand from the automotive industry, expansion of infrastructure projects, and the ongoing development of high-performance carbon black grades with enhanced properties. Government initiatives promoting sustainable manufacturing practices also positively impact market growth.
Challenges in the Rubber Carbon Black Market Market
Long-term growth is driven by technological innovations, strategic collaborations to ensure sustainable sourcing of raw materials, and market expansion into emerging economies.
Emerging Opportunities in Rubber Carbon Black Market
Opportunities lie in developing sustainable and high-performance carbon blacks meeting growing environmental concerns. Expanding into new applications, such as advanced materials and specialized industrial components, presents additional growth potential. Focus on sustainable manufacturing practices and exploring new markets offers significant opportunities for future growth.
Leading Players in the Rubber Carbon Black Market Sector
- Tokai Carbon Co Ltd
- Omsk Carbon Group
- Mitsubishi Chemical Corporation
- Orion Engineered Carbons GmbH
- Jiangxi Black Cat Carbon Black Co Ltd
- NNPC
- ASAHI CARBON Co Ltd
- Cabot Corporation
- Himadri Speciality Chemical Ltd
- Longxing Chemical Stock Co Ltd
- International CSRC Investment Holdings Co Ltd
- PCBL
- OCI Company Ltd
- Birla Carbon (Aditya Birla Group)
Key Milestones in Rubber Carbon Black Market Industry
- June 2021: Orion Engineered Carbon commercially launched ECORAX Nature, a plant-based carbon black for rubber applications.
- August 2021: Phillips Carbon Black Ltd (PCBL) announced plans for significant capacity expansion.
- September 2021: Orion Engineered Carbon began constructing a new plant in Huaibei, China.
- March 2022: Orion Engineered Carbon started commercial sales from its new Ravenna, Italy production site.
Strategic Outlook for Rubber Carbon Black Market Market
The Rubber Carbon Black market holds substantial growth potential, driven by technological advancements and increasing demand from various sectors. Strategic partnerships, investments in R&D, and the development of sustainable solutions will be crucial for companies to maintain a competitive edge in this dynamic market.
Rubber Carbon Black Market Segmentation
-
1. Application
- 1.1. Tires
- 1.2. Hoses
- 1.3. Belts
- 1.4. Gaskets
- 1.5. Vibration Control
- 1.6. Footwear
Rubber Carbon Black Market Segmentation By Geography
-
1. Asia Pacific
- 1.1. China
- 1.2. India
- 1.3. Japan
- 1.4. South Korea
- 1.5. Rest of Asia Pacific
-
2. North America
- 2.1. United States
- 2.2. Canada
- 2.3. Mexico
-
3. Europe
- 3.1. Germany
- 3.2. United Kingdom
- 3.3. Italy
- 3.4. Russia
- 3.5. France
- 3.6. Spain
- 3.7. Turkey
- 3.8. Rest of Europe
-
4. South America
- 4.1. Brazil
- 4.2. Argentina
- 4.3. Rest of South America
-
5. Middle East and Africa
- 5.1. Saudi Arabia
- 5.2. South Africa
- 5.3. Rest of Middle East and Africa
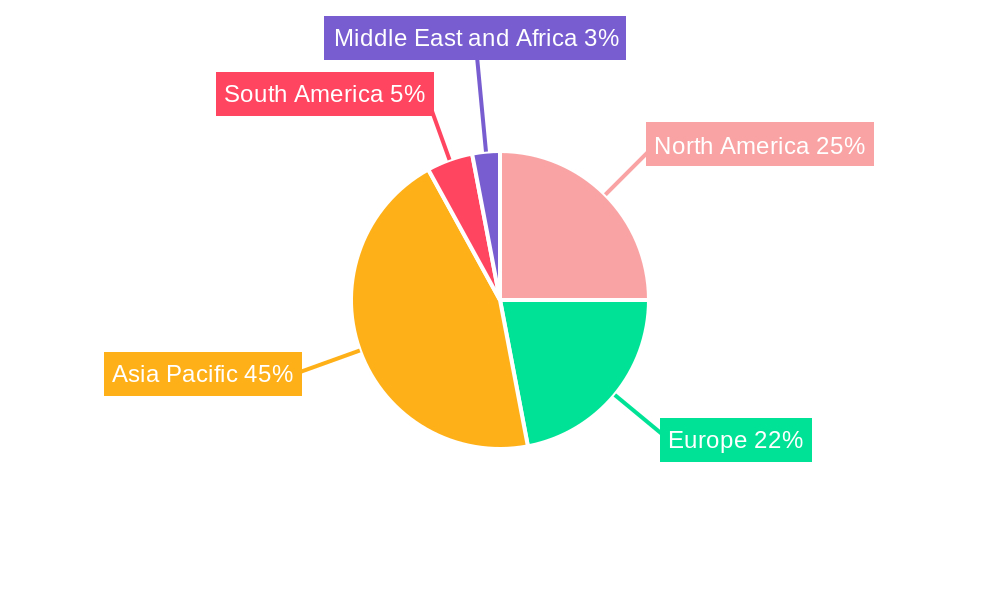
Rubber Carbon Black Market Regional Market Share
Geographic Coverage of Rubber Carbon Black Market
Rubber Carbon Black Market REPORT HIGHLIGHTS
| Aspects | Details |
|---|---|
| Study Period | 2020-2034 |
| Base Year | 2025 |
| Estimated Year | 2026 |
| Forecast Period | 2026-2034 |
| Historical Period | 2020-2025 |
| Growth Rate | CAGR of 5% from 2020-2034 |
| Segmentation |
|
Table of Contents
- 1. Introduction
- 1.1. Research Scope
- 1.2. Market Segmentation
- 1.3. Research Objective
- 1.4. Definitions and Assumptions
- 2. Executive Summary
- 2.1. Market Snapshot
- 3. Market Dynamics
- 3.1. Market Drivers
- 3.2. Market Restrains
- 3.3. Market Trends
- 3.4. Market Opportunities
- 4. Market Factor Analysis
- 4.1. Porters Five Forces
- 4.1.1. Bargaining Power of Suppliers
- 4.1.2. Bargaining Power of Buyers
- 4.1.3. Threat of New Entrants
- 4.1.4. Threat of Substitutes
- 4.1.5. Competitive Rivalry
- 4.2. PESTEL analysis
- 4.3. BCG Analysis
- 4.3.1. Stars (High Growth, High Market Share)
- 4.3.2. Cash Cows (Low Growth, High Market Share)
- 4.3.3. Question Mark (High Growth, Low Market Share)
- 4.3.4. Dogs (Low Growth, Low Market Share)
- 4.4. Ansoff Matrix Analysis
- 4.5. Supply Chain Analysis
- 4.6. Regulatory Landscape
- 4.7. Current Market Potential and Opportunity Assessment (TAM–SAM–SOM Framework)
- 4.8. MSR Analyst Note
- 4.1. Porters Five Forces
- 5. Market Analysis, Insights and Forecast 2021-2033
- 5.1. Market Analysis, Insights and Forecast - by Application
- 5.1.1. Tires
- 5.1.2. Hoses
- 5.1.3. Belts
- 5.1.4. Gaskets
- 5.1.5. Vibration Control
- 5.1.6. Footwear
- 5.2. Market Analysis, Insights and Forecast - by Region
- 5.2.1. Asia Pacific
- 5.2.2. North America
- 5.2.3. Europe
- 5.2.4. South America
- 5.2.5. Middle East and Africa
- 5.1. Market Analysis, Insights and Forecast - by Application
- 6. Global Rubber Carbon Black Market Analysis, Insights and Forecast, 2021-2033
- 6.1. Market Analysis, Insights and Forecast - by Application
- 6.1.1. Tires
- 6.1.2. Hoses
- 6.1.3. Belts
- 6.1.4. Gaskets
- 6.1.5. Vibration Control
- 6.1.6. Footwear
- 6.1. Market Analysis, Insights and Forecast - by Application
- 7. Asia Pacific Rubber Carbon Black Market Analysis, Insights and Forecast, 2020-2032
- 7.1. Market Analysis, Insights and Forecast - by Application
- 7.1.1. Tires
- 7.1.2. Hoses
- 7.1.3. Belts
- 7.1.4. Gaskets
- 7.1.5. Vibration Control
- 7.1.6. Footwear
- 7.1. Market Analysis, Insights and Forecast - by Application
- 8. North America Rubber Carbon Black Market Analysis, Insights and Forecast, 2020-2032
- 8.1. Market Analysis, Insights and Forecast - by Application
- 8.1.1. Tires
- 8.1.2. Hoses
- 8.1.3. Belts
- 8.1.4. Gaskets
- 8.1.5. Vibration Control
- 8.1.6. Footwear
- 8.1. Market Analysis, Insights and Forecast - by Application
- 9. Europe Rubber Carbon Black Market Analysis, Insights and Forecast, 2020-2032
- 9.1. Market Analysis, Insights and Forecast - by Application
- 9.1.1. Tires
- 9.1.2. Hoses
- 9.1.3. Belts
- 9.1.4. Gaskets
- 9.1.5. Vibration Control
- 9.1.6. Footwear
- 9.1. Market Analysis, Insights and Forecast - by Application
- 10. South America Rubber Carbon Black Market Analysis, Insights and Forecast, 2020-2032
- 10.1. Market Analysis, Insights and Forecast - by Application
- 10.1.1. Tires
- 10.1.2. Hoses
- 10.1.3. Belts
- 10.1.4. Gaskets
- 10.1.5. Vibration Control
- 10.1.6. Footwear
- 10.1. Market Analysis, Insights and Forecast - by Application
- 11. Middle East and Africa Rubber Carbon Black Market Analysis, Insights and Forecast, 2020-2032
- 11.1. Market Analysis, Insights and Forecast - by Application
- 11.1.1. Tires
- 11.1.2. Hoses
- 11.1.3. Belts
- 11.1.4. Gaskets
- 11.1.5. Vibration Control
- 11.1.6. Footwear
- 11.1. Market Analysis, Insights and Forecast - by Application
- 12. Competitive Analysis
- 12.1. Company Profiles
- 12.1.1 Tokai Carbon Co Ltd
- 12.1.1.1. Company Overview
- 12.1.1.2. Products
- 12.1.1.3. Company Financials
- 12.1.1.4. SWOT Analysis
- 12.1.2 Omsk Carbon Group
- 12.1.2.1. Company Overview
- 12.1.2.2. Products
- 12.1.2.3. Company Financials
- 12.1.2.4. SWOT Analysis
- 12.1.3 Mitsubishi Chemical Corporation
- 12.1.3.1. Company Overview
- 12.1.3.2. Products
- 12.1.3.3. Company Financials
- 12.1.3.4. SWOT Analysis
- 12.1.4 Orion Engineered Carbons GmbH
- 12.1.4.1. Company Overview
- 12.1.4.2. Products
- 12.1.4.3. Company Financials
- 12.1.4.4. SWOT Analysis
- 12.1.5 Jiangxi Black Cat Carbon Black Co Ltd
- 12.1.5.1. Company Overview
- 12.1.5.2. Products
- 12.1.5.3. Company Financials
- 12.1.5.4. SWOT Analysis
- 12.1.6 NNPC
- 12.1.6.1. Company Overview
- 12.1.6.2. Products
- 12.1.6.3. Company Financials
- 12.1.6.4. SWOT Analysis
- 12.1.7 ASAHI CARBON Co Ltd
- 12.1.7.1. Company Overview
- 12.1.7.2. Products
- 12.1.7.3. Company Financials
- 12.1.7.4. SWOT Analysis
- 12.1.8 Cabot Corporation
- 12.1.8.1. Company Overview
- 12.1.8.2. Products
- 12.1.8.3. Company Financials
- 12.1.8.4. SWOT Analysis
- 12.1.9 Himadri Speciality Chemical Ltd
- 12.1.9.1. Company Overview
- 12.1.9.2. Products
- 12.1.9.3. Company Financials
- 12.1.9.4. SWOT Analysis
- 12.1.10 Longxing Chemical Stock Co Ltd
- 12.1.10.1. Company Overview
- 12.1.10.2. Products
- 12.1.10.3. Company Financials
- 12.1.10.4. SWOT Analysis
- 12.1.11 International CSRC Investment Holdings Co Ltd
- 12.1.11.1. Company Overview
- 12.1.11.2. Products
- 12.1.11.3. Company Financials
- 12.1.11.4. SWOT Analysis
- 12.1.12 PCBL*List Not Exhaustive
- 12.1.12.1. Company Overview
- 12.1.12.2. Products
- 12.1.12.3. Company Financials
- 12.1.12.4. SWOT Analysis
- 12.1.13 OCI Company Ltd
- 12.1.13.1. Company Overview
- 12.1.13.2. Products
- 12.1.13.3. Company Financials
- 12.1.13.4. SWOT Analysis
- 12.1.14 Birla Carbon (Aditya Birla Group)
- 12.1.14.1. Company Overview
- 12.1.14.2. Products
- 12.1.14.3. Company Financials
- 12.1.14.4. SWOT Analysis
- 12.1.1 Tokai Carbon Co Ltd
- 12.2. Market Entropy
- 12.2.1 Company's Key Areas Served
- 12.2.2 Recent Developments
- 12.3. Company Market Share Analysis 2025
- 12.3.1 Top 5 Companies Market Share Analysis
- 12.3.2 Top 3 Companies Market Share Analysis
- 12.4. List of Potential Customers
- 13. Research Methodology
List of Figures
- Figure 1: Global Rubber Carbon Black Market Revenue Breakdown (billion, %) by Region 2025 & 2033
- Figure 2: Asia Pacific Rubber Carbon Black Market Revenue (billion), by Application 2025 & 2033
- Figure 3: Asia Pacific Rubber Carbon Black Market Revenue Share (%), by Application 2025 & 2033
- Figure 4: Asia Pacific Rubber Carbon Black Market Revenue (billion), by Country 2025 & 2033
- Figure 5: Asia Pacific Rubber Carbon Black Market Revenue Share (%), by Country 2025 & 2033
- Figure 6: North America Rubber Carbon Black Market Revenue (billion), by Application 2025 & 2033
- Figure 7: North America Rubber Carbon Black Market Revenue Share (%), by Application 2025 & 2033
- Figure 8: North America Rubber Carbon Black Market Revenue (billion), by Country 2025 & 2033
- Figure 9: North America Rubber Carbon Black Market Revenue Share (%), by Country 2025 & 2033
- Figure 10: Europe Rubber Carbon Black Market Revenue (billion), by Application 2025 & 2033
- Figure 11: Europe Rubber Carbon Black Market Revenue Share (%), by Application 2025 & 2033
- Figure 12: Europe Rubber Carbon Black Market Revenue (billion), by Country 2025 & 2033
- Figure 13: Europe Rubber Carbon Black Market Revenue Share (%), by Country 2025 & 2033
- Figure 14: South America Rubber Carbon Black Market Revenue (billion), by Application 2025 & 2033
- Figure 15: South America Rubber Carbon Black Market Revenue Share (%), by Application 2025 & 2033
- Figure 16: South America Rubber Carbon Black Market Revenue (billion), by Country 2025 & 2033
- Figure 17: South America Rubber Carbon Black Market Revenue Share (%), by Country 2025 & 2033
- Figure 18: Middle East and Africa Rubber Carbon Black Market Revenue (billion), by Application 2025 & 2033
- Figure 19: Middle East and Africa Rubber Carbon Black Market Revenue Share (%), by Application 2025 & 2033
- Figure 20: Middle East and Africa Rubber Carbon Black Market Revenue (billion), by Country 2025 & 2033
- Figure 21: Middle East and Africa Rubber Carbon Black Market Revenue Share (%), by Country 2025 & 2033
List of Tables
- Table 1: Global Rubber Carbon Black Market Revenue billion Forecast, by Application 2020 & 2033
- Table 2: Global Rubber Carbon Black Market Revenue billion Forecast, by Region 2020 & 2033
- Table 3: Global Rubber Carbon Black Market Revenue billion Forecast, by Application 2020 & 2033
- Table 4: Global Rubber Carbon Black Market Revenue billion Forecast, by Country 2020 & 2033
- Table 5: China Rubber Carbon Black Market Revenue (billion) Forecast, by Application 2020 & 2033
- Table 6: India Rubber Carbon Black Market Revenue (billion) Forecast, by Application 2020 & 2033
- Table 7: Japan Rubber Carbon Black Market Revenue (billion) Forecast, by Application 2020 & 2033
- Table 8: South Korea Rubber Carbon Black Market Revenue (billion) Forecast, by Application 2020 & 2033
- Table 9: Rest of Asia Pacific Rubber Carbon Black Market Revenue (billion) Forecast, by Application 2020 & 2033
- Table 10: Global Rubber Carbon Black Market Revenue billion Forecast, by Application 2020 & 2033
- Table 11: Global Rubber Carbon Black Market Revenue billion Forecast, by Country 2020 & 2033
- Table 12: United States Rubber Carbon Black Market Revenue (billion) Forecast, by Application 2020 & 2033
- Table 13: Canada Rubber Carbon Black Market Revenue (billion) Forecast, by Application 2020 & 2033
- Table 14: Mexico Rubber Carbon Black Market Revenue (billion) Forecast, by Application 2020 & 2033
- Table 15: Global Rubber Carbon Black Market Revenue billion Forecast, by Application 2020 & 2033
- Table 16: Global Rubber Carbon Black Market Revenue billion Forecast, by Country 2020 & 2033
- Table 17: Germany Rubber Carbon Black Market Revenue (billion) Forecast, by Application 2020 & 2033
- Table 18: United Kingdom Rubber Carbon Black Market Revenue (billion) Forecast, by Application 2020 & 2033
- Table 19: Italy Rubber Carbon Black Market Revenue (billion) Forecast, by Application 2020 & 2033
- Table 20: Russia Rubber Carbon Black Market Revenue (billion) Forecast, by Application 2020 & 2033
- Table 21: France Rubber Carbon Black Market Revenue (billion) Forecast, by Application 2020 & 2033
- Table 22: Spain Rubber Carbon Black Market Revenue (billion) Forecast, by Application 2020 & 2033
- Table 23: Turkey Rubber Carbon Black Market Revenue (billion) Forecast, by Application 2020 & 2033
- Table 24: Rest of Europe Rubber Carbon Black Market Revenue (billion) Forecast, by Application 2020 & 2033
- Table 25: Global Rubber Carbon Black Market Revenue billion Forecast, by Application 2020 & 2033
- Table 26: Global Rubber Carbon Black Market Revenue billion Forecast, by Country 2020 & 2033
- Table 27: Brazil Rubber Carbon Black Market Revenue (billion) Forecast, by Application 2020 & 2033
- Table 28: Argentina Rubber Carbon Black Market Revenue (billion) Forecast, by Application 2020 & 2033
- Table 29: Rest of South America Rubber Carbon Black Market Revenue (billion) Forecast, by Application 2020 & 2033
- Table 30: Global Rubber Carbon Black Market Revenue billion Forecast, by Application 2020 & 2033
- Table 31: Global Rubber Carbon Black Market Revenue billion Forecast, by Country 2020 & 2033
- Table 32: Saudi Arabia Rubber Carbon Black Market Revenue (billion) Forecast, by Application 2020 & 2033
- Table 33: South Africa Rubber Carbon Black Market Revenue (billion) Forecast, by Application 2020 & 2033
- Table 34: Rest of Middle East and Africa Rubber Carbon Black Market Revenue (billion) Forecast, by Application 2020 & 2033
Frequently Asked Questions
1. What is the projected Compound Annual Growth Rate (CAGR) of the Rubber Carbon Black Market?
The projected CAGR is approximately 5%.
2. Which companies are prominent players in the Rubber Carbon Black Market?
Key companies in the market include Tokai Carbon Co Ltd, Omsk Carbon Group, Mitsubishi Chemical Corporation, Orion Engineered Carbons GmbH, Jiangxi Black Cat Carbon Black Co Ltd, NNPC, ASAHI CARBON Co Ltd, Cabot Corporation, Himadri Speciality Chemical Ltd, Longxing Chemical Stock Co Ltd, International CSRC Investment Holdings Co Ltd, PCBL*List Not Exhaustive, OCI Company Ltd, Birla Carbon (Aditya Birla Group).
3. What are the main segments of the Rubber Carbon Black Market?
The market segments include Application.
4. Can you provide details about the market size?
The market size is estimated to be USD 24.5 billion as of 2022.
5. What are some drivers contributing to market growth?
Increasing Demand for Automotive Tires; Increasing Demand for Carbon Black in Industrial Rubber Applications.
6. What are the notable trends driving market growth?
Increasing Demand for Automotive Tires.
7. Are there any restraints impacting market growth?
Fluctuation In Prices of Oil Derived Feedstocks Used for Carbon Black Manufacturing; Increasing Use of Green Tires; Growing Environmental Concerns Regarding Emissions of Harmful Particulate Matter During The Production Of Carbon Black.
8. Can you provide examples of recent developments in the market?
In March 2022, Orion Engineered Carbon started commercial sales from its new carbon black production site in Ravenna, Italy. The site produces technical rubber carbon blacks for the European market and has a production capacity of 25,000 tons.
9. What pricing options are available for accessing the report?
Pricing options include single-user, multi-user, and enterprise licenses priced at USD 4750, USD 5250, and USD 8750 respectively.
10. Is the market size provided in terms of value or volume?
The market size is provided in terms of value, measured in billion.
11. Are there any specific market keywords associated with the report?
Yes, the market keyword associated with the report is "Rubber Carbon Black Market," which aids in identifying and referencing the specific market segment covered.
12. How do I determine which pricing option suits my needs best?
The pricing options vary based on user requirements and access needs. Individual users may opt for single-user licenses, while businesses requiring broader access may choose multi-user or enterprise licenses for cost-effective access to the report.
13. Are there any additional resources or data provided in the Rubber Carbon Black Market report?
While the report offers comprehensive insights, it's advisable to review the specific contents or supplementary materials provided to ascertain if additional resources or data are available.
14. How can I stay updated on further developments or reports in the Rubber Carbon Black Market?
To stay informed about further developments, trends, and reports in the Rubber Carbon Black Market, consider subscribing to industry newsletters, following relevant companies and organizations, or regularly checking reputable industry news sources and publications.
Methodology
Step 1 - Identification of Relevant Samples Size from Population Database


Step 2 - Approaches for Defining Global Market Size (Value, Volume* & Price*)

Note*: In applicable scenarios
Step 3 - Data Sources
Primary Research
- Web Analytics
- Survey Reports
- Research Institute
- Latest Research Reports
- Opinion Leaders
Secondary Research
- Annual Reports
- White Paper
- Latest Press Release
- Industry Association
- Paid Database
- Investor Presentations

Step 4 - Data Triangulation
Involves using different sources of information in order to increase the validity of a study
These sources are likely to be stakeholders in a program - participants, other researchers, program staff, other community members, and so on.
Then we put all data in single framework & apply various statistical tools to find out the dynamic on the market.
During the analysis stage, feedback from the stakeholder groups would be compared to determine areas of agreement as well as areas of divergence