

Key Insights
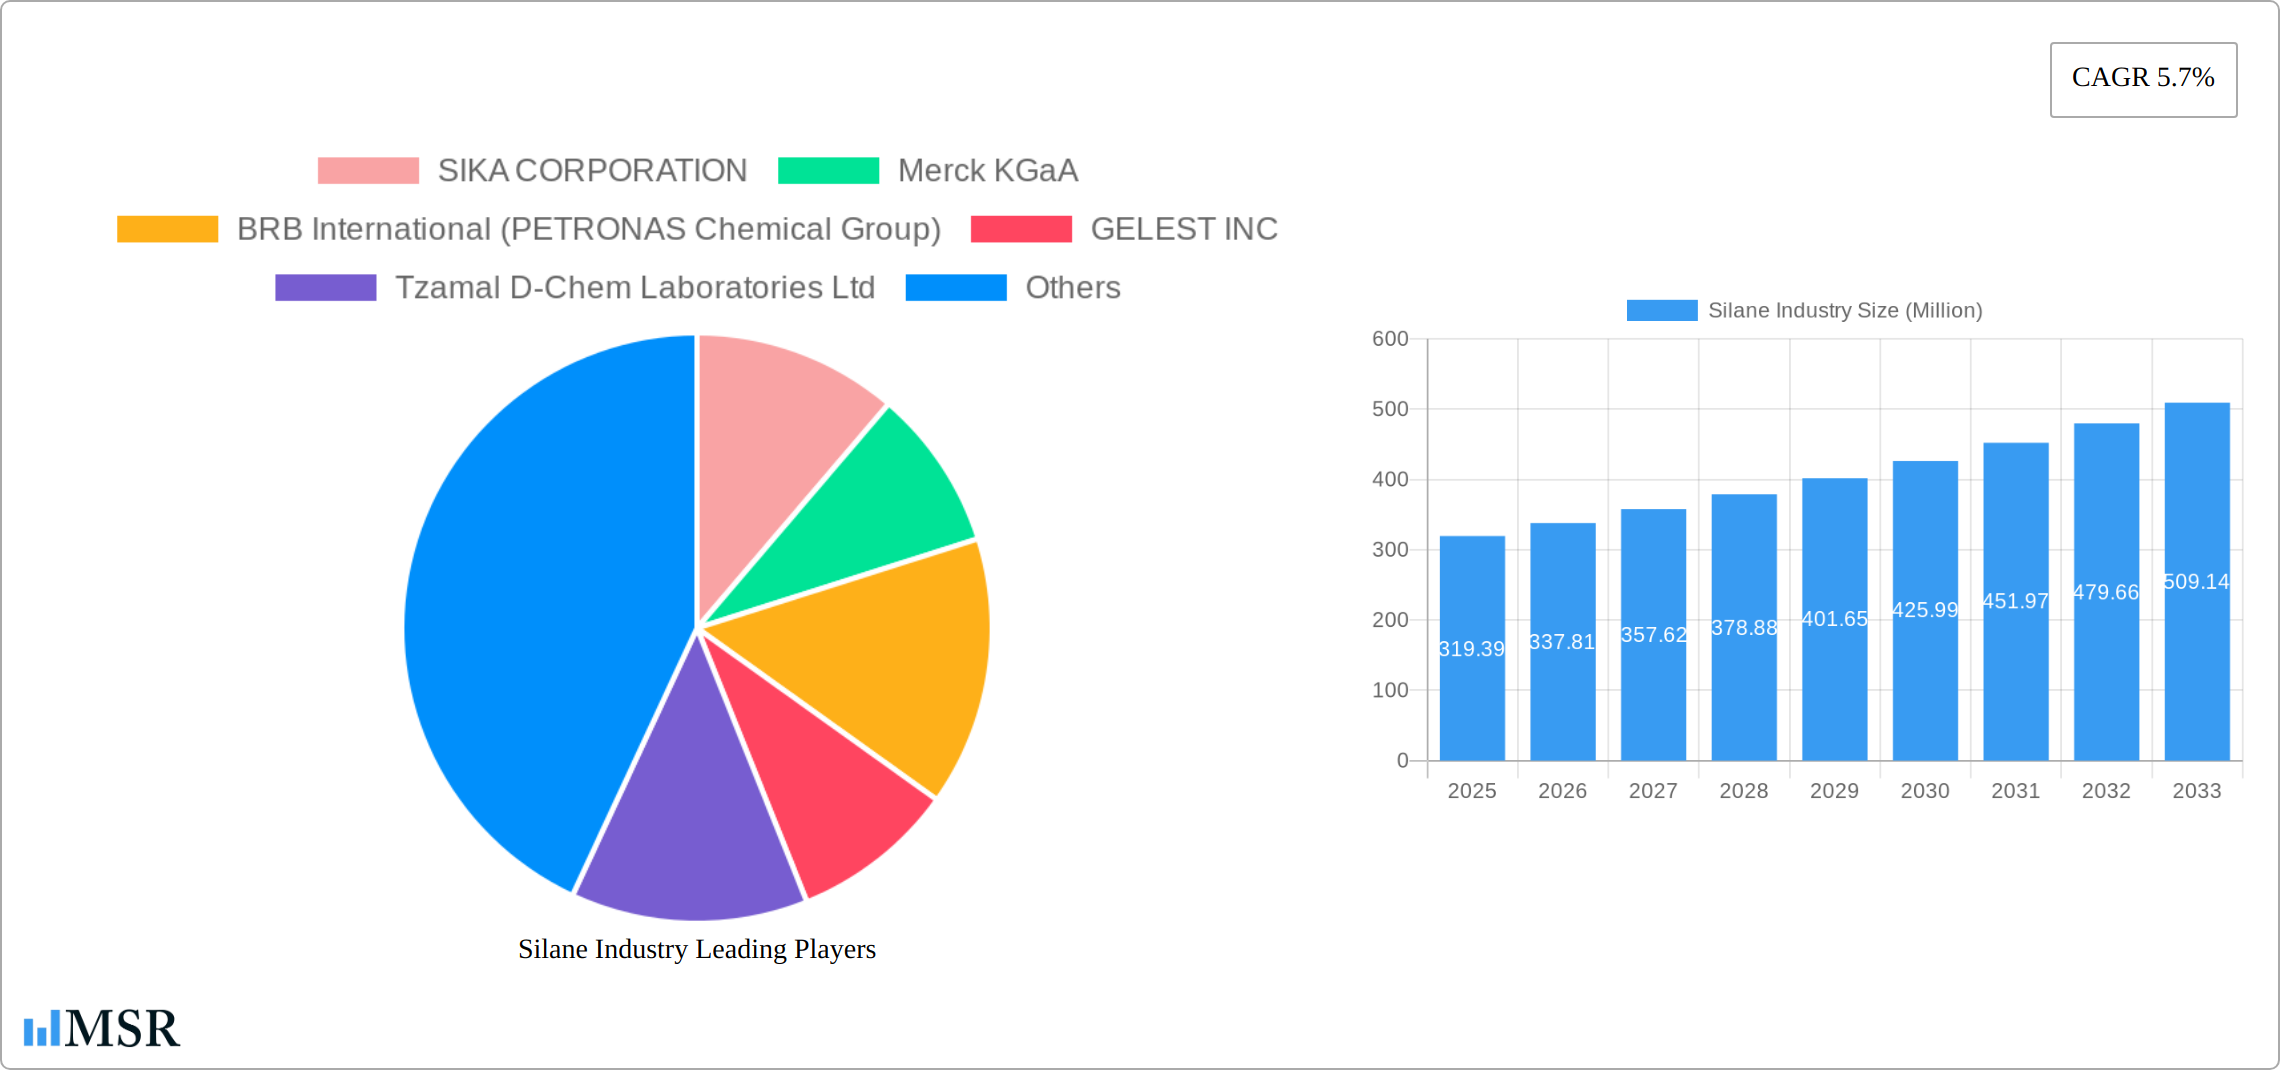
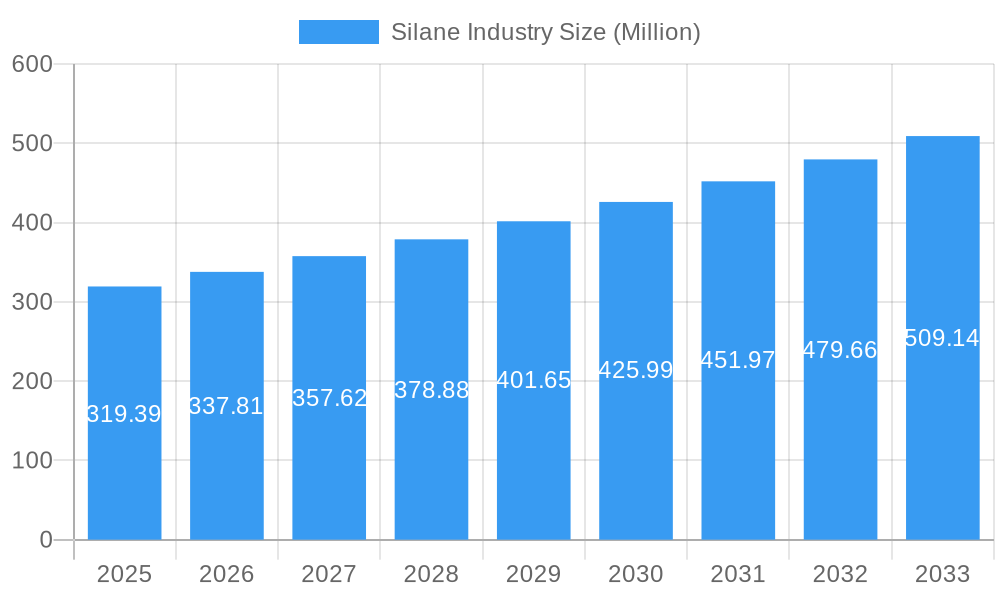
The global silane market, valued at $319.39 million in 2025, is projected to experience robust growth, driven by a compound annual growth rate (CAGR) of 5.7% from 2025 to 2033. This expansion is fueled by several key factors. The increasing demand for silanes in the construction industry, particularly in high-performance building materials and sealants, is a significant driver. The rising adoption of silanes in the automotive and electronics sectors, for applications like tire manufacturing and semiconductor production, further contributes to market growth. Growth in the paints and coatings sector, leveraging silanes' ability to improve adhesion and durability, also plays a crucial role. Furthermore, the expanding global infrastructure projects and the rising need for durable and protective coatings are bolstering demand. The market is segmented by type (alkyl, amino, epoxy, methacryloxy, phenyl, vinyl, others) and application (plastics, rubber & composites, building & construction, paints & coatings, adhesives & sealants, mineral & filler treatment, others including semiconductors and pharmaceuticals). The competitive landscape is characterized by a mix of established players and emerging companies, with continuous innovation in silane chemistry and application techniques fostering further expansion.
Silane Industry Market Size (In Million)
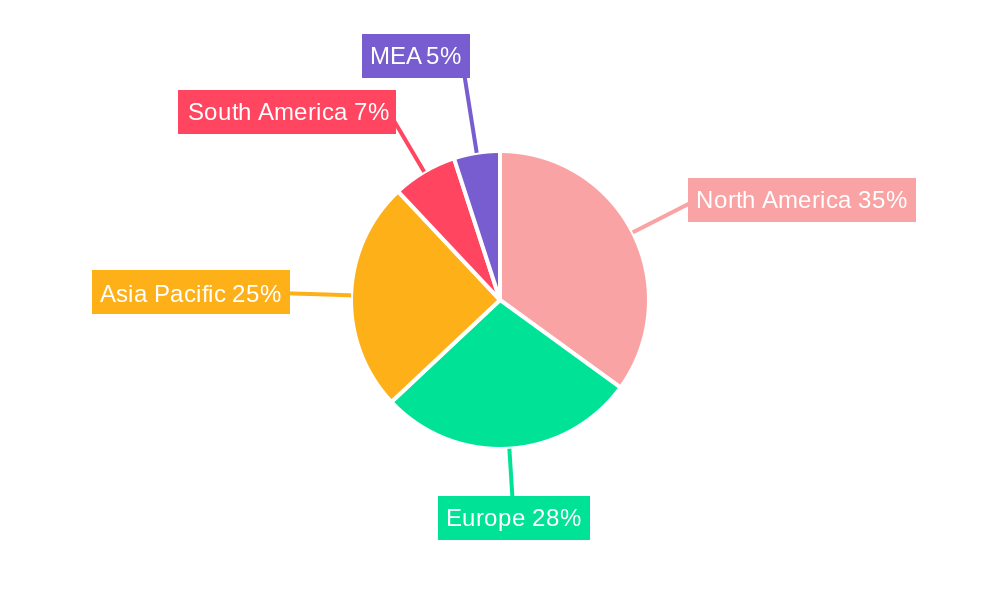
The geographical distribution of the market reveals strong growth potential across various regions. North America currently holds a significant market share, driven by strong industrial activity and technological advancements. However, the Asia-Pacific region, particularly China and India, is expected to witness the fastest growth due to rapid industrialization, increasing infrastructure development, and rising disposable incomes. Europe continues to be a significant market, driven by stringent environmental regulations and the growing preference for high-performance building materials. South America and the Middle East & Africa regions are also expected to contribute to market growth, albeit at a slower pace compared to other regions. The diverse applications of silanes and the continuous research and development efforts focused on enhancing their performance characteristics ensure a promising outlook for the global silane market in the coming years.
Silane Industry Company Market Share
Silane Industry Market Report: 2019-2033 Forecast
This comprehensive report provides an in-depth analysis of the global silane industry, offering valuable insights for stakeholders across the value chain. Covering the period 2019-2033, with a focus on 2025, this report meticulously examines market dynamics, key segments, leading players, and emerging opportunities. The report leverages extensive data analysis and forecasts to present actionable intelligence, helping businesses make informed strategic decisions. The global market size was valued at $XX Million in 2025 and is projected to reach $XX Million by 2033, exhibiting a CAGR of XX% during the forecast period (2025-2033).
Silane Industry Market Concentration & Dynamics
The global silane market presents a moderately concentrated landscape, dominated by key players such as SIKA CORPORATION, Merck KGaA, BRB International (PETRONAS Chemical Group), GELEST INC, Tzamal D-Chem Laboratories Ltd, Momentive, Genesee Polymers Corporation, Dow, Alfa Aesar (Thermo Fisher Scientific), Shin-Etsu Chemical Co Ltd, Prochimia Surfaces, United Chemical Technologies, Wacker Chemie AG, and Evonik. These companies collectively hold a substantial market share, estimated at XX% for the top five players. This concentration, however, is challenged by a diverse range of smaller, specialized players contributing to a dynamic and competitive environment.
Driving innovation within the silane industry is the ongoing development of novel silane chemistries boasting enhanced properties. This includes improvements in adhesion strength, water resistance, UV stability, and overall performance characteristics. The industry is actively responding to stringent environmental regulations concerning volatile organic compounds (VOCs) by developing and adopting more environmentally benign silane-based solutions. While substitute products like epoxy resins and polyurethane exist, silanes frequently maintain a competitive edge due to their superior performance in specific applications, particularly those demanding high durability and specialized functionalities.
End-user trends reveal a significant increase in demand for high-performance materials across various sectors. This trend fuels the need for specialized silanes tailored to meet these demanding applications. While merger and acquisition (M&A) activity has been moderate in recent years (XX deals recorded between 2019 and 2024), these transactions largely focused on strategic expansions of product portfolios and geographic reach, indicating a push towards consolidation and broader market access.
- Market Share (2025): Top 5 players - XX%
- M&A Deals (2019-2024): XX
Silane Industry Industry Insights & Trends
The silane industry is experiencing robust growth driven by increasing demand from diverse end-use sectors, particularly in building & construction, paints & coatings, and adhesives & sealants. Technological advancements, such as the development of novel silane coupling agents and functionalized silanes, are expanding the applications of silanes in high-growth areas like electronics and renewable energy. Evolving consumer preferences for sustainable and high-performance products are further driving market expansion. The global silane market size reached $XX Million in 2024, showcasing a significant increase compared to previous years. This growth is attributed to factors such as increased demand from the construction sector and advancements in silane technology, leading to its expanded usage across various applications. Market projections for 2025 estimate a value of $XX Million.
Key Markets & Segments Leading Silane Industry
The Asia Pacific region currently leads the global silane market, propelled by strong economic growth, extensive infrastructure development, and increasing demand from key sectors such as construction and automotive. Analyzing silane types, Alkyl silanes maintain the largest market share, followed by Amino and Epoxy silanes. The building & construction segment remains the primary consumer of silanes, owing to their widespread use in concrete admixtures, waterproofing agents, and sealants. However, emerging applications in other sectors, driven by innovation and technological advancements, are poised to reshape the market landscape.
- Dominant Region: Asia Pacific
- Dominant Type: Alkyl Silanes
- Dominant Application: Building & Construction
Key Growth Drivers:
- Rapid Infrastructure Development: Significant investments in infrastructure projects across developing and developed economies fuel substantial demand for construction chemicals.
- Expanding Construction Sector: The ongoing global expansion of the construction industry creates a consistent need for high-performance materials, including silanes.
- Rising Disposable Incomes: Increased purchasing power in various regions, especially in emerging markets, translates into greater demand for durable and high-quality products utilizing silanes.
- Technological Advancements: Continuous innovation in silane chemistry leads to the creation of new applications and expanded market penetration across diverse sectors.
Silane Industry Product Developments
Recent innovations in the silane industry include the development of silanes with enhanced properties such as improved adhesion, UV resistance, and thermal stability. These advancements enable the use of silanes in more demanding applications, expanding market opportunities. Companies are focusing on developing eco-friendly silanes to meet growing environmental concerns. The introduction of multifunctional silanes that combine multiple properties in a single molecule is also gaining traction.
Challenges in the Silane Industry Market
The silane industry faces several key challenges, including fluctuations in raw material prices, which directly impact production costs and profitability. Stringent environmental regulations necessitate continuous adaptation and investment in sustainable practices. Intense competition from substitute products, coupled with a diverse competitive landscape ranging from large multinationals to specialized smaller players, creates price pressures and necessitates consistent product differentiation and value-added innovation. Supply chain disruptions, a growing concern globally, can significantly impact production, delivery times, and overall pricing.
Forces Driving Silane Industry Growth
Several factors contribute significantly to the continued growth of the silane industry. The robust and expanding construction sector remains a major driver, with sustained demand for construction chemicals incorporating silanes. Technological advancements continue to lead to the development of novel applications for silanes, pushing market penetration into diverse sectors beyond traditional uses. Government initiatives promoting sustainable construction practices and environmentally friendly building materials further stimulate the demand for silane-based solutions. The development of new silane-based products with superior performance and sustainability features is a critical element driving future market expansion and capturing new market segments.
Long-Term Growth Catalysts in the Silane Industry
Long-term growth in the silane industry will be driven by strategic partnerships, collaborations, and innovations in silane chemistry. Expanding into new and emerging markets will provide new growth opportunities. Continued investments in research and development will be crucial for staying ahead of the competition and developing next-generation silane products.
Emerging Opportunities in Silane Industry
Emerging opportunities lie in the development of highly specialized silanes for niche applications in electronics, renewable energy, and healthcare. Growing demand for sustainable and environmentally friendly materials presents an opportunity for the development of bio-based or recycled silanes.
Leading Players in the Silane Industry Sector
- SIKA CORPORATION
- Merck KGaA
- BRB International (PETRONAS Chemical Group)
- GELEST INC
- Tzamal D-Chem Laboratories Ltd
- Momentive
- Genesee Polymers Corporation
- Dow
- Alfa Aesar (Thermo Fisher Scientific)
- Shin-Etsu Chemical Co Ltd
- Prochimia Surfaces
- United Chemical Technologies
- Wacker Chemie AG
- Evonik
Key Milestones in Silane Industry Industry
- 2020: Introduction of a new generation of environmentally friendly silanes by SIKA CORPORATION.
- 2022: Merck KGaA announces a strategic partnership to expand its silane product portfolio.
- 2023: Acquisition of a smaller silane manufacturer by Dow, expanding its market presence.
Strategic Outlook for Silane Industry Market
The silane industry presents a significant growth potential driven by continued innovation, expansion into new applications, and increasing demand from various end-use sectors. Strategic partnerships and investments in research and development will be key to success in this dynamic and competitive market. The focus on sustainability and environmental compliance will further shape future market trends and opportunities.
Silane Industry Segmentation
-
1. Type
- 1.1. Alkyl
- 1.2. Amino
- 1.3. Epoxy
- 1.4. Methacryloxy
- 1.5. Phenyl
- 1.6. Vinyl
- 1.7. Others
-
2. Application
- 2.1. Plastics, Rubber and Composites
- 2.2. Building & Construction
- 2.3. Paints & Coatings
- 2.4. Adhesives & Sealants
- 2.5. Mineral & Filler Treatment
- 2.6. Others (Semi-Conductors, Pharmaceutical, etc.,)
Silane Industry Segmentation By Geography
-
1. Asia Pacific
- 1.1. China
- 1.2. India
- 1.3. Japan
- 1.4. South Korea
- 1.5. Rest of Asia Pacific
-
2. North America
- 2.1. United States
- 2.2. Canada
- 2.3. Mexico
-
3. Europe
- 3.1. Germany
- 3.2. United Kingdom
- 3.3. Italy
- 3.4. France
- 3.5. Rest of Europe
-
4. South America
- 4.1. Brazil
- 4.2. Argentina
- 4.3. Rest of South America
-
5. Middle East and Africa
- 5.1. Saudi Arabia
- 5.2. South Africa
- 5.3. Rest of Middle East and Africa
Silane Industry Regional Market Share
Geographic Coverage of Silane Industry
Silane Industry REPORT HIGHLIGHTS
| Aspects | Details |
|---|---|
| Study Period | 2020-2034 |
| Base Year | 2025 |
| Estimated Year | 2026 |
| Forecast Period | 2026-2034 |
| Historical Period | 2020-2025 |
| Growth Rate | CAGR of 5.7% from 2020-2034 |
| Segmentation |
|
Table of Contents
- 1. Introduction
- 1.1. Research Scope
- 1.2. Market Segmentation
- 1.3. Research Methodology
- 1.4. Definitions and Assumptions
- 2. Executive Summary
- 2.1. Introduction
- 3. Market Dynamics
- 3.1. Introduction
- 3.2. Market Drivers
- 3.2.1. ; Growing Demand form the Construction Industry; Growing Demand for Light-Weight Composites; Increasing Demand from Automotive Industry
- 3.3. Market Restrains
- 3.3.1. ; Higher Production Costs; Unfavorable Conditions Arising Due to the COVID-19 Outbreak
- 3.4. Market Trends
- 3.4.1. Growing Demand from the Construction Industry
- 4. Market Factor Analysis
- 4.1. Porters Five Forces
- 4.2. Supply/Value Chain
- 4.3. PESTEL analysis
- 4.4. Market Entropy
- 4.5. Patent/Trademark Analysis
- 5. Global Silane Industry Analysis, Insights and Forecast, 2020-2032
- 5.1. Market Analysis, Insights and Forecast - by Type
- 5.1.1. Alkyl
- 5.1.2. Amino
- 5.1.3. Epoxy
- 5.1.4. Methacryloxy
- 5.1.5. Phenyl
- 5.1.6. Vinyl
- 5.1.7. Others
- 5.2. Market Analysis, Insights and Forecast - by Application
- 5.2.1. Plastics, Rubber and Composites
- 5.2.2. Building & Construction
- 5.2.3. Paints & Coatings
- 5.2.4. Adhesives & Sealants
- 5.2.5. Mineral & Filler Treatment
- 5.2.6. Others (Semi-Conductors, Pharmaceutical, etc.,)
- 5.3. Market Analysis, Insights and Forecast - by Region
- 5.3.1. Asia Pacific
- 5.3.2. North America
- 5.3.3. Europe
- 5.3.4. South America
- 5.3.5. Middle East and Africa
- 5.1. Market Analysis, Insights and Forecast - by Type
- 6. Asia Pacific Silane Industry Analysis, Insights and Forecast, 2020-2032
- 6.1. Market Analysis, Insights and Forecast - by Type
- 6.1.1. Alkyl
- 6.1.2. Amino
- 6.1.3. Epoxy
- 6.1.4. Methacryloxy
- 6.1.5. Phenyl
- 6.1.6. Vinyl
- 6.1.7. Others
- 6.2. Market Analysis, Insights and Forecast - by Application
- 6.2.1. Plastics, Rubber and Composites
- 6.2.2. Building & Construction
- 6.2.3. Paints & Coatings
- 6.2.4. Adhesives & Sealants
- 6.2.5. Mineral & Filler Treatment
- 6.2.6. Others (Semi-Conductors, Pharmaceutical, etc.,)
- 6.1. Market Analysis, Insights and Forecast - by Type
- 7. North America Silane Industry Analysis, Insights and Forecast, 2020-2032
- 7.1. Market Analysis, Insights and Forecast - by Type
- 7.1.1. Alkyl
- 7.1.2. Amino
- 7.1.3. Epoxy
- 7.1.4. Methacryloxy
- 7.1.5. Phenyl
- 7.1.6. Vinyl
- 7.1.7. Others
- 7.2. Market Analysis, Insights and Forecast - by Application
- 7.2.1. Plastics, Rubber and Composites
- 7.2.2. Building & Construction
- 7.2.3. Paints & Coatings
- 7.2.4. Adhesives & Sealants
- 7.2.5. Mineral & Filler Treatment
- 7.2.6. Others (Semi-Conductors, Pharmaceutical, etc.,)
- 7.1. Market Analysis, Insights and Forecast - by Type
- 8. Europe Silane Industry Analysis, Insights and Forecast, 2020-2032
- 8.1. Market Analysis, Insights and Forecast - by Type
- 8.1.1. Alkyl
- 8.1.2. Amino
- 8.1.3. Epoxy
- 8.1.4. Methacryloxy
- 8.1.5. Phenyl
- 8.1.6. Vinyl
- 8.1.7. Others
- 8.2. Market Analysis, Insights and Forecast - by Application
- 8.2.1. Plastics, Rubber and Composites
- 8.2.2. Building & Construction
- 8.2.3. Paints & Coatings
- 8.2.4. Adhesives & Sealants
- 8.2.5. Mineral & Filler Treatment
- 8.2.6. Others (Semi-Conductors, Pharmaceutical, etc.,)
- 8.1. Market Analysis, Insights and Forecast - by Type
- 9. South America Silane Industry Analysis, Insights and Forecast, 2020-2032
- 9.1. Market Analysis, Insights and Forecast - by Type
- 9.1.1. Alkyl
- 9.1.2. Amino
- 9.1.3. Epoxy
- 9.1.4. Methacryloxy
- 9.1.5. Phenyl
- 9.1.6. Vinyl
- 9.1.7. Others
- 9.2. Market Analysis, Insights and Forecast - by Application
- 9.2.1. Plastics, Rubber and Composites
- 9.2.2. Building & Construction
- 9.2.3. Paints & Coatings
- 9.2.4. Adhesives & Sealants
- 9.2.5. Mineral & Filler Treatment
- 9.2.6. Others (Semi-Conductors, Pharmaceutical, etc.,)
- 9.1. Market Analysis, Insights and Forecast - by Type
- 10. Middle East and Africa Silane Industry Analysis, Insights and Forecast, 2020-2032
- 10.1. Market Analysis, Insights and Forecast - by Type
- 10.1.1. Alkyl
- 10.1.2. Amino
- 10.1.3. Epoxy
- 10.1.4. Methacryloxy
- 10.1.5. Phenyl
- 10.1.6. Vinyl
- 10.1.7. Others
- 10.2. Market Analysis, Insights and Forecast - by Application
- 10.2.1. Plastics, Rubber and Composites
- 10.2.2. Building & Construction
- 10.2.3. Paints & Coatings
- 10.2.4. Adhesives & Sealants
- 10.2.5. Mineral & Filler Treatment
- 10.2.6. Others (Semi-Conductors, Pharmaceutical, etc.,)
- 10.1. Market Analysis, Insights and Forecast - by Type
- 11. Competitive Analysis
- 11.1. Global Market Share Analysis 2025
- 11.2. Company Profiles
- 11.2.1 SIKA CORPORATION
- 11.2.1.1. Overview
- 11.2.1.2. Products
- 11.2.1.3. SWOT Analysis
- 11.2.1.4. Recent Developments
- 11.2.1.5. Financials (Based on Availability)
- 11.2.2 Merck KGaA
- 11.2.2.1. Overview
- 11.2.2.2. Products
- 11.2.2.3. SWOT Analysis
- 11.2.2.4. Recent Developments
- 11.2.2.5. Financials (Based on Availability)
- 11.2.3 BRB International (PETRONAS Chemical Group)
- 11.2.3.1. Overview
- 11.2.3.2. Products
- 11.2.3.3. SWOT Analysis
- 11.2.3.4. Recent Developments
- 11.2.3.5. Financials (Based on Availability)
- 11.2.4 GELEST INC
- 11.2.4.1. Overview
- 11.2.4.2. Products
- 11.2.4.3. SWOT Analysis
- 11.2.4.4. Recent Developments
- 11.2.4.5. Financials (Based on Availability)
- 11.2.5 Tzamal D-Chem Laboratories Ltd
- 11.2.5.1. Overview
- 11.2.5.2. Products
- 11.2.5.3. SWOT Analysis
- 11.2.5.4. Recent Developments
- 11.2.5.5. Financials (Based on Availability)
- 11.2.6 Momentive
- 11.2.6.1. Overview
- 11.2.6.2. Products
- 11.2.6.3. SWOT Analysis
- 11.2.6.4. Recent Developments
- 11.2.6.5. Financials (Based on Availability)
- 11.2.7 Genesee Polymers Corporation
- 11.2.7.1. Overview
- 11.2.7.2. Products
- 11.2.7.3. SWOT Analysis
- 11.2.7.4. Recent Developments
- 11.2.7.5. Financials (Based on Availability)
- 11.2.8 Dow
- 11.2.8.1. Overview
- 11.2.8.2. Products
- 11.2.8.3. SWOT Analysis
- 11.2.8.4. Recent Developments
- 11.2.8.5. Financials (Based on Availability)
- 11.2.9 Alfa Aesar (Thermo Fisher Scientific)
- 11.2.9.1. Overview
- 11.2.9.2. Products
- 11.2.9.3. SWOT Analysis
- 11.2.9.4. Recent Developments
- 11.2.9.5. Financials (Based on Availability)
- 11.2.10 Shin-Etsu Chemical Co Ltd
- 11.2.10.1. Overview
- 11.2.10.2. Products
- 11.2.10.3. SWOT Analysis
- 11.2.10.4. Recent Developments
- 11.2.10.5. Financials (Based on Availability)
- 11.2.11 Prochimia Surfaces
- 11.2.11.1. Overview
- 11.2.11.2. Products
- 11.2.11.3. SWOT Analysis
- 11.2.11.4. Recent Developments
- 11.2.11.5. Financials (Based on Availability)
- 11.2.12 United Chemical Technologies
- 11.2.12.1. Overview
- 11.2.12.2. Products
- 11.2.12.3. SWOT Analysis
- 11.2.12.4. Recent Developments
- 11.2.12.5. Financials (Based on Availability)
- 11.2.13 Wacker Chemie AG
- 11.2.13.1. Overview
- 11.2.13.2. Products
- 11.2.13.3. SWOT Analysis
- 11.2.13.4. Recent Developments
- 11.2.13.5. Financials (Based on Availability)
- 11.2.14 Evonik
- 11.2.14.1. Overview
- 11.2.14.2. Products
- 11.2.14.3. SWOT Analysis
- 11.2.14.4. Recent Developments
- 11.2.14.5. Financials (Based on Availability)
- 11.2.1 SIKA CORPORATION
List of Figures
- Figure 1: Global Silane Industry Revenue Breakdown (Million, %) by Region 2025 & 2033
- Figure 2: Global Silane Industry Volume Breakdown (K Tons, %) by Region 2025 & 2033
- Figure 3: Asia Pacific Silane Industry Revenue (Million), by Type 2025 & 2033
- Figure 4: Asia Pacific Silane Industry Volume (K Tons), by Type 2025 & 2033
- Figure 5: Asia Pacific Silane Industry Revenue Share (%), by Type 2025 & 2033
- Figure 6: Asia Pacific Silane Industry Volume Share (%), by Type 2025 & 2033
- Figure 7: Asia Pacific Silane Industry Revenue (Million), by Application 2025 & 2033
- Figure 8: Asia Pacific Silane Industry Volume (K Tons), by Application 2025 & 2033
- Figure 9: Asia Pacific Silane Industry Revenue Share (%), by Application 2025 & 2033
- Figure 10: Asia Pacific Silane Industry Volume Share (%), by Application 2025 & 2033
- Figure 11: Asia Pacific Silane Industry Revenue (Million), by Country 2025 & 2033
- Figure 12: Asia Pacific Silane Industry Volume (K Tons), by Country 2025 & 2033
- Figure 13: Asia Pacific Silane Industry Revenue Share (%), by Country 2025 & 2033
- Figure 14: Asia Pacific Silane Industry Volume Share (%), by Country 2025 & 2033
- Figure 15: North America Silane Industry Revenue (Million), by Type 2025 & 2033
- Figure 16: North America Silane Industry Volume (K Tons), by Type 2025 & 2033
- Figure 17: North America Silane Industry Revenue Share (%), by Type 2025 & 2033
- Figure 18: North America Silane Industry Volume Share (%), by Type 2025 & 2033
- Figure 19: North America Silane Industry Revenue (Million), by Application 2025 & 2033
- Figure 20: North America Silane Industry Volume (K Tons), by Application 2025 & 2033
- Figure 21: North America Silane Industry Revenue Share (%), by Application 2025 & 2033
- Figure 22: North America Silane Industry Volume Share (%), by Application 2025 & 2033
- Figure 23: North America Silane Industry Revenue (Million), by Country 2025 & 2033
- Figure 24: North America Silane Industry Volume (K Tons), by Country 2025 & 2033
- Figure 25: North America Silane Industry Revenue Share (%), by Country 2025 & 2033
- Figure 26: North America Silane Industry Volume Share (%), by Country 2025 & 2033
- Figure 27: Europe Silane Industry Revenue (Million), by Type 2025 & 2033
- Figure 28: Europe Silane Industry Volume (K Tons), by Type 2025 & 2033
- Figure 29: Europe Silane Industry Revenue Share (%), by Type 2025 & 2033
- Figure 30: Europe Silane Industry Volume Share (%), by Type 2025 & 2033
- Figure 31: Europe Silane Industry Revenue (Million), by Application 2025 & 2033
- Figure 32: Europe Silane Industry Volume (K Tons), by Application 2025 & 2033
- Figure 33: Europe Silane Industry Revenue Share (%), by Application 2025 & 2033
- Figure 34: Europe Silane Industry Volume Share (%), by Application 2025 & 2033
- Figure 35: Europe Silane Industry Revenue (Million), by Country 2025 & 2033
- Figure 36: Europe Silane Industry Volume (K Tons), by Country 2025 & 2033
- Figure 37: Europe Silane Industry Revenue Share (%), by Country 2025 & 2033
- Figure 38: Europe Silane Industry Volume Share (%), by Country 2025 & 2033
- Figure 39: South America Silane Industry Revenue (Million), by Type 2025 & 2033
- Figure 40: South America Silane Industry Volume (K Tons), by Type 2025 & 2033
- Figure 41: South America Silane Industry Revenue Share (%), by Type 2025 & 2033
- Figure 42: South America Silane Industry Volume Share (%), by Type 2025 & 2033
- Figure 43: South America Silane Industry Revenue (Million), by Application 2025 & 2033
- Figure 44: South America Silane Industry Volume (K Tons), by Application 2025 & 2033
- Figure 45: South America Silane Industry Revenue Share (%), by Application 2025 & 2033
- Figure 46: South America Silane Industry Volume Share (%), by Application 2025 & 2033
- Figure 47: South America Silane Industry Revenue (Million), by Country 2025 & 2033
- Figure 48: South America Silane Industry Volume (K Tons), by Country 2025 & 2033
- Figure 49: South America Silane Industry Revenue Share (%), by Country 2025 & 2033
- Figure 50: South America Silane Industry Volume Share (%), by Country 2025 & 2033
- Figure 51: Middle East and Africa Silane Industry Revenue (Million), by Type 2025 & 2033
- Figure 52: Middle East and Africa Silane Industry Volume (K Tons), by Type 2025 & 2033
- Figure 53: Middle East and Africa Silane Industry Revenue Share (%), by Type 2025 & 2033
- Figure 54: Middle East and Africa Silane Industry Volume Share (%), by Type 2025 & 2033
- Figure 55: Middle East and Africa Silane Industry Revenue (Million), by Application 2025 & 2033
- Figure 56: Middle East and Africa Silane Industry Volume (K Tons), by Application 2025 & 2033
- Figure 57: Middle East and Africa Silane Industry Revenue Share (%), by Application 2025 & 2033
- Figure 58: Middle East and Africa Silane Industry Volume Share (%), by Application 2025 & 2033
- Figure 59: Middle East and Africa Silane Industry Revenue (Million), by Country 2025 & 2033
- Figure 60: Middle East and Africa Silane Industry Volume (K Tons), by Country 2025 & 2033
- Figure 61: Middle East and Africa Silane Industry Revenue Share (%), by Country 2025 & 2033
- Figure 62: Middle East and Africa Silane Industry Volume Share (%), by Country 2025 & 2033
List of Tables
- Table 1: Global Silane Industry Revenue Million Forecast, by Type 2020 & 2033
- Table 2: Global Silane Industry Volume K Tons Forecast, by Type 2020 & 2033
- Table 3: Global Silane Industry Revenue Million Forecast, by Application 2020 & 2033
- Table 4: Global Silane Industry Volume K Tons Forecast, by Application 2020 & 2033
- Table 5: Global Silane Industry Revenue Million Forecast, by Region 2020 & 2033
- Table 6: Global Silane Industry Volume K Tons Forecast, by Region 2020 & 2033
- Table 7: Global Silane Industry Revenue Million Forecast, by Type 2020 & 2033
- Table 8: Global Silane Industry Volume K Tons Forecast, by Type 2020 & 2033
- Table 9: Global Silane Industry Revenue Million Forecast, by Application 2020 & 2033
- Table 10: Global Silane Industry Volume K Tons Forecast, by Application 2020 & 2033
- Table 11: Global Silane Industry Revenue Million Forecast, by Country 2020 & 2033
- Table 12: Global Silane Industry Volume K Tons Forecast, by Country 2020 & 2033
- Table 13: China Silane Industry Revenue (Million) Forecast, by Application 2020 & 2033
- Table 14: China Silane Industry Volume (K Tons) Forecast, by Application 2020 & 2033
- Table 15: India Silane Industry Revenue (Million) Forecast, by Application 2020 & 2033
- Table 16: India Silane Industry Volume (K Tons) Forecast, by Application 2020 & 2033
- Table 17: Japan Silane Industry Revenue (Million) Forecast, by Application 2020 & 2033
- Table 18: Japan Silane Industry Volume (K Tons) Forecast, by Application 2020 & 2033
- Table 19: South Korea Silane Industry Revenue (Million) Forecast, by Application 2020 & 2033
- Table 20: South Korea Silane Industry Volume (K Tons) Forecast, by Application 2020 & 2033
- Table 21: Rest of Asia Pacific Silane Industry Revenue (Million) Forecast, by Application 2020 & 2033
- Table 22: Rest of Asia Pacific Silane Industry Volume (K Tons) Forecast, by Application 2020 & 2033
- Table 23: Global Silane Industry Revenue Million Forecast, by Type 2020 & 2033
- Table 24: Global Silane Industry Volume K Tons Forecast, by Type 2020 & 2033
- Table 25: Global Silane Industry Revenue Million Forecast, by Application 2020 & 2033
- Table 26: Global Silane Industry Volume K Tons Forecast, by Application 2020 & 2033
- Table 27: Global Silane Industry Revenue Million Forecast, by Country 2020 & 2033
- Table 28: Global Silane Industry Volume K Tons Forecast, by Country 2020 & 2033
- Table 29: United States Silane Industry Revenue (Million) Forecast, by Application 2020 & 2033
- Table 30: United States Silane Industry Volume (K Tons) Forecast, by Application 2020 & 2033
- Table 31: Canada Silane Industry Revenue (Million) Forecast, by Application 2020 & 2033
- Table 32: Canada Silane Industry Volume (K Tons) Forecast, by Application 2020 & 2033
- Table 33: Mexico Silane Industry Revenue (Million) Forecast, by Application 2020 & 2033
- Table 34: Mexico Silane Industry Volume (K Tons) Forecast, by Application 2020 & 2033
- Table 35: Global Silane Industry Revenue Million Forecast, by Type 2020 & 2033
- Table 36: Global Silane Industry Volume K Tons Forecast, by Type 2020 & 2033
- Table 37: Global Silane Industry Revenue Million Forecast, by Application 2020 & 2033
- Table 38: Global Silane Industry Volume K Tons Forecast, by Application 2020 & 2033
- Table 39: Global Silane Industry Revenue Million Forecast, by Country 2020 & 2033
- Table 40: Global Silane Industry Volume K Tons Forecast, by Country 2020 & 2033
- Table 41: Germany Silane Industry Revenue (Million) Forecast, by Application 2020 & 2033
- Table 42: Germany Silane Industry Volume (K Tons) Forecast, by Application 2020 & 2033
- Table 43: United Kingdom Silane Industry Revenue (Million) Forecast, by Application 2020 & 2033
- Table 44: United Kingdom Silane Industry Volume (K Tons) Forecast, by Application 2020 & 2033
- Table 45: Italy Silane Industry Revenue (Million) Forecast, by Application 2020 & 2033
- Table 46: Italy Silane Industry Volume (K Tons) Forecast, by Application 2020 & 2033
- Table 47: France Silane Industry Revenue (Million) Forecast, by Application 2020 & 2033
- Table 48: France Silane Industry Volume (K Tons) Forecast, by Application 2020 & 2033
- Table 49: Rest of Europe Silane Industry Revenue (Million) Forecast, by Application 2020 & 2033
- Table 50: Rest of Europe Silane Industry Volume (K Tons) Forecast, by Application 2020 & 2033
- Table 51: Global Silane Industry Revenue Million Forecast, by Type 2020 & 2033
- Table 52: Global Silane Industry Volume K Tons Forecast, by Type 2020 & 2033
- Table 53: Global Silane Industry Revenue Million Forecast, by Application 2020 & 2033
- Table 54: Global Silane Industry Volume K Tons Forecast, by Application 2020 & 2033
- Table 55: Global Silane Industry Revenue Million Forecast, by Country 2020 & 2033
- Table 56: Global Silane Industry Volume K Tons Forecast, by Country 2020 & 2033
- Table 57: Brazil Silane Industry Revenue (Million) Forecast, by Application 2020 & 2033
- Table 58: Brazil Silane Industry Volume (K Tons) Forecast, by Application 2020 & 2033
- Table 59: Argentina Silane Industry Revenue (Million) Forecast, by Application 2020 & 2033
- Table 60: Argentina Silane Industry Volume (K Tons) Forecast, by Application 2020 & 2033
- Table 61: Rest of South America Silane Industry Revenue (Million) Forecast, by Application 2020 & 2033
- Table 62: Rest of South America Silane Industry Volume (K Tons) Forecast, by Application 2020 & 2033
- Table 63: Global Silane Industry Revenue Million Forecast, by Type 2020 & 2033
- Table 64: Global Silane Industry Volume K Tons Forecast, by Type 2020 & 2033
- Table 65: Global Silane Industry Revenue Million Forecast, by Application 2020 & 2033
- Table 66: Global Silane Industry Volume K Tons Forecast, by Application 2020 & 2033
- Table 67: Global Silane Industry Revenue Million Forecast, by Country 2020 & 2033
- Table 68: Global Silane Industry Volume K Tons Forecast, by Country 2020 & 2033
- Table 69: Saudi Arabia Silane Industry Revenue (Million) Forecast, by Application 2020 & 2033
- Table 70: Saudi Arabia Silane Industry Volume (K Tons) Forecast, by Application 2020 & 2033
- Table 71: South Africa Silane Industry Revenue (Million) Forecast, by Application 2020 & 2033
- Table 72: South Africa Silane Industry Volume (K Tons) Forecast, by Application 2020 & 2033
- Table 73: Rest of Middle East and Africa Silane Industry Revenue (Million) Forecast, by Application 2020 & 2033
- Table 74: Rest of Middle East and Africa Silane Industry Volume (K Tons) Forecast, by Application 2020 & 2033
Frequently Asked Questions
1. What is the projected Compound Annual Growth Rate (CAGR) of the Silane Industry?
The projected CAGR is approximately 5.7%.
2. Which companies are prominent players in the Silane Industry?
Key companies in the market include SIKA CORPORATION, Merck KGaA, BRB International (PETRONAS Chemical Group), GELEST INC, Tzamal D-Chem Laboratories Ltd, Momentive, Genesee Polymers Corporation, Dow, Alfa Aesar (Thermo Fisher Scientific), Shin-Etsu Chemical Co Ltd, Prochimia Surfaces, United Chemical Technologies, Wacker Chemie AG, Evonik.
3. What are the main segments of the Silane Industry?
The market segments include Type, Application.
4. Can you provide details about the market size?
The market size is estimated to be USD 319.39 Million as of 2022.
5. What are some drivers contributing to market growth?
; Growing Demand form the Construction Industry; Growing Demand for Light-Weight Composites; Increasing Demand from Automotive Industry.
6. What are the notable trends driving market growth?
Growing Demand from the Construction Industry.
7. Are there any restraints impacting market growth?
; Higher Production Costs; Unfavorable Conditions Arising Due to the COVID-19 Outbreak.
8. Can you provide examples of recent developments in the market?
N/A
9. What pricing options are available for accessing the report?
Pricing options include single-user, multi-user, and enterprise licenses priced at USD 4750, USD 5250, and USD 8750 respectively.
10. Is the market size provided in terms of value or volume?
The market size is provided in terms of value, measured in Million and volume, measured in K Tons.
11. Are there any specific market keywords associated with the report?
Yes, the market keyword associated with the report is "Silane Industry," which aids in identifying and referencing the specific market segment covered.
12. How do I determine which pricing option suits my needs best?
The pricing options vary based on user requirements and access needs. Individual users may opt for single-user licenses, while businesses requiring broader access may choose multi-user or enterprise licenses for cost-effective access to the report.
13. Are there any additional resources or data provided in the Silane Industry report?
While the report offers comprehensive insights, it's advisable to review the specific contents or supplementary materials provided to ascertain if additional resources or data are available.
14. How can I stay updated on further developments or reports in the Silane Industry?
To stay informed about further developments, trends, and reports in the Silane Industry, consider subscribing to industry newsletters, following relevant companies and organizations, or regularly checking reputable industry news sources and publications.
Methodology
Step 1 - Identification of Relevant Samples Size from Population Database


Step 2 - Approaches for Defining Global Market Size (Value, Volume* & Price*)

Note*: In applicable scenarios
Step 3 - Data Sources
Primary Research
- Web Analytics
- Survey Reports
- Research Institute
- Latest Research Reports
- Opinion Leaders
Secondary Research
- Annual Reports
- White Paper
- Latest Press Release
- Industry Association
- Paid Database
- Investor Presentations

Step 4 - Data Triangulation
Involves using different sources of information in order to increase the validity of a study
These sources are likely to be stakeholders in a program - participants, other researchers, program staff, other community members, and so on.
Then we put all data in single framework & apply various statistical tools to find out the dynamic on the market.
During the analysis stage, feedback from the stakeholder groups would be compared to determine areas of agreement as well as areas of divergence