

Key Insights
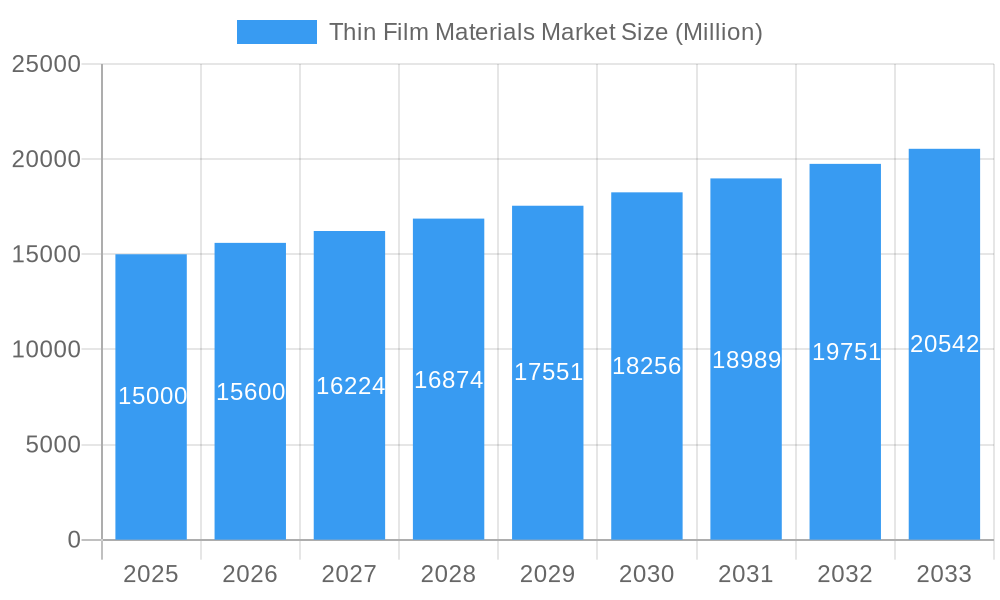
The global thin film materials market is poised for significant expansion, driven by the accelerating demand for renewable energy solutions and advancements in electronic technologies. The market is projected to achieve a Compound Annual Growth Rate (CAGR) of 15.71%, reaching an estimated market size of $7.93 billion by the base year 2025. Key growth catalysts include the rapidly expanding photovoltaic (PV) cell industry, leveraging materials such as Copper Indium Gallium Selenide (CIGS), Cadmium Telluride (CdTe), and Amorphous Silicon (a-Si) for enhanced solar energy conversion. Furthermore, the increasing integration of these materials in semiconductors and Microelectromechanical Systems (MEMS) contributes to market momentum. While challenges such as material costs and efficiency parity with traditional silicon technologies exist, ongoing research and development are actively mitigating these barriers. Market segmentation highlights PV cell applications as the dominant segment, followed by semiconductors and MEMS. Geographically, North America and Asia-Pacific currently lead, fueled by substantial renewable energy infrastructure investments and technological progress. Emerging economies in Asia-Pacific and South America present substantial future growth potential, supported by government initiatives and rising energy demands. Leading companies, including First Solar, Trony Solar Holdings, and Kaneka Corporation, are instrumental in market evolution through innovation and strategic alliances.
Thin Film Materials Market Market Size (In Billion)
The forecast period from 2025 to 2033 indicates substantial opportunities for market growth. With a projected CAGR of 15.71%, the market value is expected to see consistent upward progression. The geographical distribution, initially balanced between North America and Asia-Pacific, is anticipated to see Asia-Pacific emerge as a larger market share holder with developing economies' increasing adoption of renewable energy. Continuous enhancements in the efficiency and cost-effectiveness of thin film materials will be critical for sustained growth and broader application penetration. The competitive landscape, characterized by established and emerging players, points to a dynamic and innovative market ready for continuous evolution and expansion.
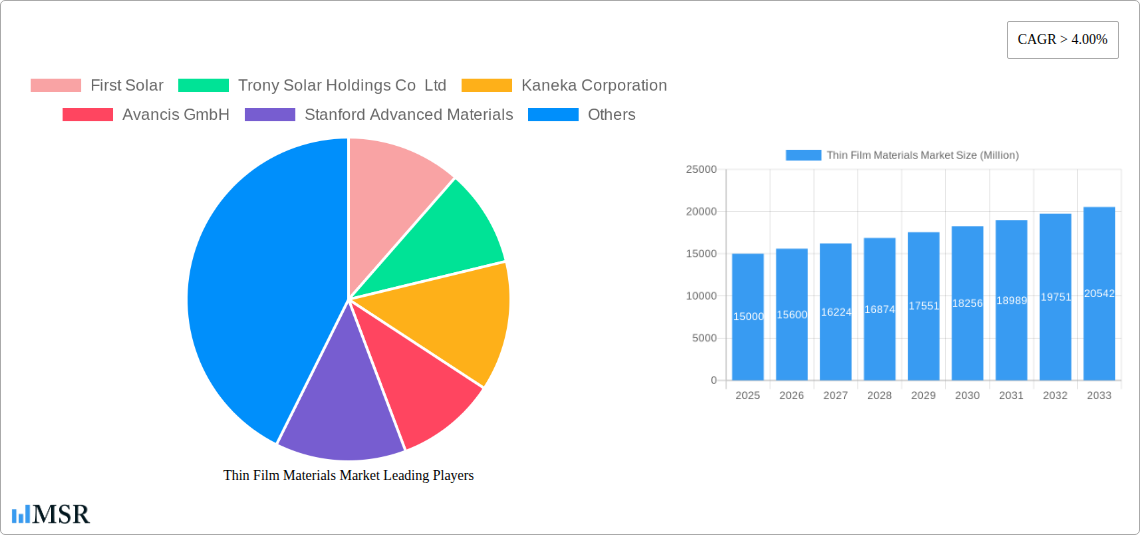
Thin Film Materials Market Company Market Share
Unlock Growth Potential in the Thriving Thin Film Materials Market: A Comprehensive Market Report (2019-2033)
This comprehensive report provides an in-depth analysis of the Thin Film Materials Market, offering invaluable insights for stakeholders across the value chain. Covering the period 2019-2033, with a focus on 2025, this study meticulously examines market dynamics, key segments, leading players, and future growth opportunities. The report is essential for businesses seeking to navigate the complexities of this dynamic market and capitalize on emerging trends.
Thin Film Materials Market Concentration & Dynamics
The Thin Film Materials market exhibits a moderately concentrated landscape, with a handful of major players commanding significant market share. First Solar, First Solar, and Kaneka Corporation hold leading positions, driven by their extensive manufacturing capabilities and technological advancements. However, the market is witnessing increased competition from emerging players and innovative startups, particularly in the CIGS and CdTe segments. The market's innovation ecosystem is robust, fueled by ongoing research and development in material science and thin-film deposition techniques. Stringent environmental regulations, particularly concerning hazardous materials, are shaping the market trajectory, driving the adoption of eco-friendly materials and manufacturing processes. Substitute products, such as crystalline silicon solar cells, pose a competitive challenge, albeit with thin-film technologies gaining traction due to their flexibility and cost-effectiveness in specific applications. End-user trends reveal a growing preference for flexible and lightweight thin-film devices across various applications. The last five years have seen approximately xx M&A deals in the thin-film materials sector, signifying ongoing consolidation and strategic expansion within the industry. Market share fluctuations are influenced by technological breakthroughs, pricing strategies, and shifts in regulatory environments.
Thin Film Materials Market Industry Insights & Trends
The global Thin Film Materials market is projected to reach xx Million by 2025, exhibiting a CAGR of xx% during the forecast period (2025-2033). Growth is primarily fueled by the burgeoning demand for renewable energy solutions, driving significant growth in the photovoltaic (PV) cell segment. Technological advancements in thin-film deposition techniques, enabling higher efficiency and lower production costs, are further accelerating market expansion. The increasing adoption of flexible electronics and the miniaturization of electronic devices are key drivers for growth in segments beyond PV cells. Consumer behavior is shifting towards sustainable and eco-friendly products, boosting demand for thin-film materials in various applications. Disruptions arise from the continuous introduction of novel materials with improved performance characteristics and the development of more efficient manufacturing processes. However, challenges remain in terms of achieving higher efficiency levels compared to crystalline silicon technologies and addressing certain material limitations. Market size fluctuations are influenced by global economic conditions, government policies, and technological breakthroughs.
Key Markets & Segments Leading Thin Film Materials Market
Dominant Regions: The Asia-Pacific region currently dominates the Thin Film Materials market, driven by robust economic growth, substantial government investments in renewable energy, and a rapidly expanding electronics manufacturing sector. North America and Europe also represent significant markets, with strong demand for high-efficiency solar cells and advanced electronic components.
Dominant Types: Cadmium Telluride (CdTe) currently holds the largest market share among thin-film types due to its relatively high efficiency and cost-effectiveness in PV applications. However, Copper Indium Gallium Selenide (CIGS) is gaining traction due to its potential for higher efficiency and flexibility. Amorphous Silicon (a-Si) remains a significant player, particularly in less demanding applications.
Dominant Applications: Photovoltaic (PV) cells constitute the largest application segment, with the increasing demand for renewable energy driving significant growth. The semiconductor industry represents another significant application area, driven by the growing adoption of thin-film transistors in various electronic devices. Microelectromechanical systems (MEMS) also present a promising application segment.
Growth Drivers:
- Renewable Energy Initiatives: Government policies promoting renewable energy sources are significantly boosting the demand for thin-film PV cells.
- Technological Advancements: Continuous improvements in thin-film deposition techniques and material properties are enhancing efficiency and lowering production costs.
- Economic Growth: Strong economic growth in several regions is driving demand for electronic devices and renewable energy infrastructure.
- Infrastructure Development: Investments in new infrastructure projects are creating opportunities for the adoption of thin-film materials in various applications.
Thin Film Materials Market Product Developments
Recent years have witnessed significant advancements in thin-film materials, including the development of new material compositions with improved efficiency and stability, such as enhanced CIGS and perovskite-based thin films. Innovations in deposition techniques, such as roll-to-roll processing, have led to cost reductions and increased production scalability. The emergence of flexible and transparent thin-film materials expands applications into emerging areas like flexible electronics and wearable technology. These technological advancements provide manufacturers with a competitive edge by enabling the production of high-performance, cost-effective products that meet evolving market demands.
Challenges in the Thin Film Materials Market Market
The Thin Film Materials market faces challenges related to material toxicity (e.g., CdTe), supply chain complexities, and price competition from established technologies like crystalline silicon. Regulatory hurdles concerning hazardous materials and environmental regulations impact production costs and market entry. Furthermore, achieving consistent high efficiency levels across large-scale production remains a technical challenge. These constraints result in an estimated xx Million annual loss in potential revenue, highlighting the need for innovation and improved supply chain management.
Forces Driving Thin Film Materials Market Growth
Several factors drive the growth of the Thin Film Materials market, including increasing demand for renewable energy solutions, ongoing technological advancements leading to improved efficiency and cost-reduction, and supportive government policies. The growing adoption of flexible electronics and the miniaturization of electronic devices represent additional drivers. These factors combine to create a favorable environment for market expansion.
Long-Term Growth Catalysts in the Thin Film Materials Market
Long-term growth hinges on continued technological innovation, strategic partnerships between material suppliers and device manufacturers, and expansion into new applications such as flexible displays and wearable technologies. Further research into developing more sustainable and less toxic thin-film materials will be critical.
Emerging Opportunities in Thin Film Materials Market
Emerging opportunities lie in the development of tandem solar cells combining thin-film and other technologies, and the growing integration of thin-film materials in flexible electronics and IoT applications. New markets, particularly in developing economies experiencing rapid urbanization and industrialization, offer significant growth potential.
Leading Players in the Thin Film Materials Market Sector
- First Solar
- Trony Solar Holdings Co Ltd
- Kaneka Corporation
- Avancis GmbH
- Stanford Advanced Materials
- Cicor Management AG
- Solar Frontier Kabushiki Kaisha
- Ascent Solar Technologies Inc
- Hanergy Thin Film Power Group Europe
- Moser Baer India Limited
Key Milestones in Thin Film Materials Market Industry
- 2020: First Solar announces a significant increase in CdTe solar module efficiency.
- 2022: A major breakthrough in CIGS technology improves overall efficiency by xx%.
- 2023: A strategic partnership between two key players results in the development of a novel thin-film deposition technique.
- 2024: Significant government investment in renewable energy research drives innovation.
Strategic Outlook for Thin Film Materials Market Market
The Thin Film Materials market holds substantial long-term growth potential driven by the accelerating adoption of renewable energy, the rising demand for flexible electronics, and the continuous improvement of thin-film technologies. Strategic opportunities exist in developing innovative material compositions, enhancing manufacturing efficiency, and expanding into new applications to capture significant market share.
Thin Film Materials Market Segmentation
-
1. Type
- 1.1. Copper Indium Gallium Selenide (CIGS)
- 1.2. Cadmium Telluride (CdTe)
- 1.3. Amorphous Silicon (a-Si)
- 1.4. Other Types
-
2. Application
- 2.1. Photo voltaic (PV) Cells
- 2.2. Semiconductors
- 2.3. Microelectromechanical systems
- 2.4. Other Applications
Thin Film Materials Market Segmentation By Geography
-
1. Asia Pacific
- 1.1. China
- 1.2. India
- 1.3. Japan
- 1.4. South Korea
- 1.5. Rest of Asia Pacific
-
2. North America
- 2.1. United States
- 2.2. Canada
- 2.3. Mexico
-
3. Europe
- 3.1. Germany
- 3.2. United Kingdom
- 3.3. Italy
- 3.4. France
- 3.5. Spain
- 3.6. Rest of Europe
-
4. South America
- 4.1. Brazil
- 4.2. Aregentina
- 4.3. Rest of South America
-
5. Middle East and Africa
- 5.1. United Arab Emirates
- 5.2. Saudi Arabia
- 5.3. South Africa
- 5.4. Rest of Middle East and Africa
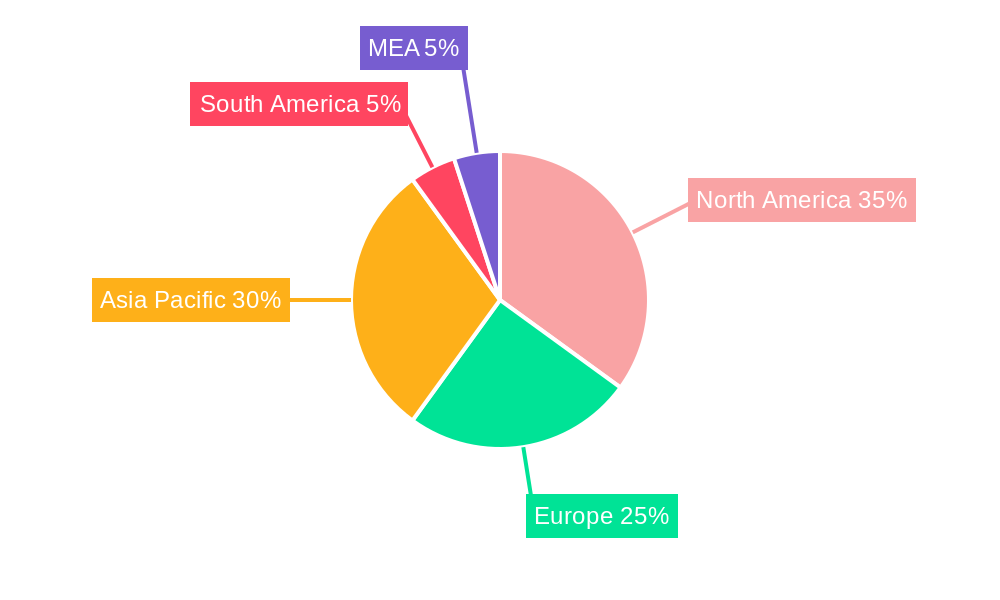
Thin Film Materials Market Regional Market Share
Geographic Coverage of Thin Film Materials Market
Thin Film Materials Market REPORT HIGHLIGHTS
| Aspects | Details |
|---|---|
| Study Period | 2020-2034 |
| Base Year | 2025 |
| Estimated Year | 2026 |
| Forecast Period | 2026-2034 |
| Historical Period | 2020-2025 |
| Growth Rate | CAGR of 4.33% from 2020-2034 |
| Segmentation |
|
Table of Contents
- 1. Introduction
- 1.1. Research Scope
- 1.2. Market Segmentation
- 1.3. Research Objective
- 1.4. Definitions and Assumptions
- 2. Executive Summary
- 2.1. Market Snapshot
- 3. Market Dynamics
- 3.1. Market Drivers
- 3.2. Market Restrains
- 3.3. Market Trends
- 3.4. Market Opportunities
- 4. Market Factor Analysis
- 4.1. Porters Five Forces
- 4.1.1. Bargaining Power of Suppliers
- 4.1.2. Bargaining Power of Buyers
- 4.1.3. Threat of New Entrants
- 4.1.4. Threat of Substitutes
- 4.1.5. Competitive Rivalry
- 4.2. PESTEL analysis
- 4.3. BCG Analysis
- 4.3.1. Stars (High Growth, High Market Share)
- 4.3.2. Cash Cows (Low Growth, High Market Share)
- 4.3.3. Question Mark (High Growth, Low Market Share)
- 4.3.4. Dogs (Low Growth, Low Market Share)
- 4.4. Ansoff Matrix Analysis
- 4.5. Supply Chain Analysis
- 4.6. Regulatory Landscape
- 4.7. Current Market Potential and Opportunity Assessment (TAM–SAM–SOM Framework)
- 4.8. MSR Analyst Note
- 4.1. Porters Five Forces
- 5. Market Analysis, Insights and Forecast 2021-2033
- 5.1. Market Analysis, Insights and Forecast - by Type
- 5.1.1. Copper Indium Gallium Selenide (CIGS)
- 5.1.2. Cadmium Telluride (CdTe)
- 5.1.3. Amorphous Silicon (a-Si)
- 5.1.4. Other Types
- 5.2. Market Analysis, Insights and Forecast - by Application
- 5.2.1. Photo voltaic (PV) Cells
- 5.2.2. Semiconductors
- 5.2.3. Microelectromechanical systems
- 5.2.4. Other Applications
- 5.3. Market Analysis, Insights and Forecast - by Region
- 5.3.1. Asia Pacific
- 5.3.2. North America
- 5.3.3. Europe
- 5.3.4. South America
- 5.3.5. Middle East and Africa
- 5.1. Market Analysis, Insights and Forecast - by Type
- 6. Global Thin Film Materials Market Analysis, Insights and Forecast, 2021-2033
- 6.1. Market Analysis, Insights and Forecast - by Type
- 6.1.1. Copper Indium Gallium Selenide (CIGS)
- 6.1.2. Cadmium Telluride (CdTe)
- 6.1.3. Amorphous Silicon (a-Si)
- 6.1.4. Other Types
- 6.2. Market Analysis, Insights and Forecast - by Application
- 6.2.1. Photo voltaic (PV) Cells
- 6.2.2. Semiconductors
- 6.2.3. Microelectromechanical systems
- 6.2.4. Other Applications
- 6.1. Market Analysis, Insights and Forecast - by Type
- 7. Asia Pacific Thin Film Materials Market Analysis, Insights and Forecast, 2020-2032
- 7.1. Market Analysis, Insights and Forecast - by Type
- 7.1.1. Copper Indium Gallium Selenide (CIGS)
- 7.1.2. Cadmium Telluride (CdTe)
- 7.1.3. Amorphous Silicon (a-Si)
- 7.1.4. Other Types
- 7.2. Market Analysis, Insights and Forecast - by Application
- 7.2.1. Photo voltaic (PV) Cells
- 7.2.2. Semiconductors
- 7.2.3. Microelectromechanical systems
- 7.2.4. Other Applications
- 7.1. Market Analysis, Insights and Forecast - by Type
- 8. North America Thin Film Materials Market Analysis, Insights and Forecast, 2020-2032
- 8.1. Market Analysis, Insights and Forecast - by Type
- 8.1.1. Copper Indium Gallium Selenide (CIGS)
- 8.1.2. Cadmium Telluride (CdTe)
- 8.1.3. Amorphous Silicon (a-Si)
- 8.1.4. Other Types
- 8.2. Market Analysis, Insights and Forecast - by Application
- 8.2.1. Photo voltaic (PV) Cells
- 8.2.2. Semiconductors
- 8.2.3. Microelectromechanical systems
- 8.2.4. Other Applications
- 8.1. Market Analysis, Insights and Forecast - by Type
- 9. Europe Thin Film Materials Market Analysis, Insights and Forecast, 2020-2032
- 9.1. Market Analysis, Insights and Forecast - by Type
- 9.1.1. Copper Indium Gallium Selenide (CIGS)
- 9.1.2. Cadmium Telluride (CdTe)
- 9.1.3. Amorphous Silicon (a-Si)
- 9.1.4. Other Types
- 9.2. Market Analysis, Insights and Forecast - by Application
- 9.2.1. Photo voltaic (PV) Cells
- 9.2.2. Semiconductors
- 9.2.3. Microelectromechanical systems
- 9.2.4. Other Applications
- 9.1. Market Analysis, Insights and Forecast - by Type
- 10. South America Thin Film Materials Market Analysis, Insights and Forecast, 2020-2032
- 10.1. Market Analysis, Insights and Forecast - by Type
- 10.1.1. Copper Indium Gallium Selenide (CIGS)
- 10.1.2. Cadmium Telluride (CdTe)
- 10.1.3. Amorphous Silicon (a-Si)
- 10.1.4. Other Types
- 10.2. Market Analysis, Insights and Forecast - by Application
- 10.2.1. Photo voltaic (PV) Cells
- 10.2.2. Semiconductors
- 10.2.3. Microelectromechanical systems
- 10.2.4. Other Applications
- 10.1. Market Analysis, Insights and Forecast - by Type
- 11. Middle East and Africa Thin Film Materials Market Analysis, Insights and Forecast, 2020-2032
- 11.1. Market Analysis, Insights and Forecast - by Type
- 11.1.1. Copper Indium Gallium Selenide (CIGS)
- 11.1.2. Cadmium Telluride (CdTe)
- 11.1.3. Amorphous Silicon (a-Si)
- 11.1.4. Other Types
- 11.2. Market Analysis, Insights and Forecast - by Application
- 11.2.1. Photo voltaic (PV) Cells
- 11.2.2. Semiconductors
- 11.2.3. Microelectromechanical systems
- 11.2.4. Other Applications
- 11.1. Market Analysis, Insights and Forecast - by Type
- 12. Competitive Analysis
- 12.1. Company Profiles
- 12.1.1 First Solar
- 12.1.1.1. Company Overview
- 12.1.1.2. Products
- 12.1.1.3. Company Financials
- 12.1.1.4. SWOT Analysis
- 12.1.2 Trony Solar Holdings Co Ltd
- 12.1.2.1. Company Overview
- 12.1.2.2. Products
- 12.1.2.3. Company Financials
- 12.1.2.4. SWOT Analysis
- 12.1.3 Kaneka Corporation
- 12.1.3.1. Company Overview
- 12.1.3.2. Products
- 12.1.3.3. Company Financials
- 12.1.3.4. SWOT Analysis
- 12.1.4 Avancis GmbH
- 12.1.4.1. Company Overview
- 12.1.4.2. Products
- 12.1.4.3. Company Financials
- 12.1.4.4. SWOT Analysis
- 12.1.5 Stanford Advanced Materials
- 12.1.5.1. Company Overview
- 12.1.5.2. Products
- 12.1.5.3. Company Financials
- 12.1.5.4. SWOT Analysis
- 12.1.6 Cicor Management AG
- 12.1.6.1. Company Overview
- 12.1.6.2. Products
- 12.1.6.3. Company Financials
- 12.1.6.4. SWOT Analysis
- 12.1.7 Solar Frontier Kabushiki Kaisha
- 12.1.7.1. Company Overview
- 12.1.7.2. Products
- 12.1.7.3. Company Financials
- 12.1.7.4. SWOT Analysis
- 12.1.8 Ascent Solar Technologies Inc
- 12.1.8.1. Company Overview
- 12.1.8.2. Products
- 12.1.8.3. Company Financials
- 12.1.8.4. SWOT Analysis
- 12.1.9 Hanergy Thin Film Power Group Europe
- 12.1.9.1. Company Overview
- 12.1.9.2. Products
- 12.1.9.3. Company Financials
- 12.1.9.4. SWOT Analysis
- 12.1.10 Moser Baer India Limited
- 12.1.10.1. Company Overview
- 12.1.10.2. Products
- 12.1.10.3. Company Financials
- 12.1.10.4. SWOT Analysis
- 12.1.1 First Solar
- 12.2. Market Entropy
- 12.2.1 Company's Key Areas Served
- 12.2.2 Recent Developments
- 12.3. Company Market Share Analysis 2025
- 12.3.1 Top 5 Companies Market Share Analysis
- 12.3.2 Top 3 Companies Market Share Analysis
- 12.4. List of Potential Customers
- 13. Research Methodology
List of Figures
- Figure 1: Global Thin Film Materials Market Revenue Breakdown (billion, %) by Region 2025 & 2033
- Figure 2: Global Thin Film Materials Market Volume Breakdown (K Tons, %) by Region 2025 & 2033
- Figure 3: Asia Pacific Thin Film Materials Market Revenue (billion), by Type 2025 & 2033
- Figure 4: Asia Pacific Thin Film Materials Market Volume (K Tons), by Type 2025 & 2033
- Figure 5: Asia Pacific Thin Film Materials Market Revenue Share (%), by Type 2025 & 2033
- Figure 6: Asia Pacific Thin Film Materials Market Volume Share (%), by Type 2025 & 2033
- Figure 7: Asia Pacific Thin Film Materials Market Revenue (billion), by Application 2025 & 2033
- Figure 8: Asia Pacific Thin Film Materials Market Volume (K Tons), by Application 2025 & 2033
- Figure 9: Asia Pacific Thin Film Materials Market Revenue Share (%), by Application 2025 & 2033
- Figure 10: Asia Pacific Thin Film Materials Market Volume Share (%), by Application 2025 & 2033
- Figure 11: Asia Pacific Thin Film Materials Market Revenue (billion), by Country 2025 & 2033
- Figure 12: Asia Pacific Thin Film Materials Market Volume (K Tons), by Country 2025 & 2033
- Figure 13: Asia Pacific Thin Film Materials Market Revenue Share (%), by Country 2025 & 2033
- Figure 14: Asia Pacific Thin Film Materials Market Volume Share (%), by Country 2025 & 2033
- Figure 15: North America Thin Film Materials Market Revenue (billion), by Type 2025 & 2033
- Figure 16: North America Thin Film Materials Market Volume (K Tons), by Type 2025 & 2033
- Figure 17: North America Thin Film Materials Market Revenue Share (%), by Type 2025 & 2033
- Figure 18: North America Thin Film Materials Market Volume Share (%), by Type 2025 & 2033
- Figure 19: North America Thin Film Materials Market Revenue (billion), by Application 2025 & 2033
- Figure 20: North America Thin Film Materials Market Volume (K Tons), by Application 2025 & 2033
- Figure 21: North America Thin Film Materials Market Revenue Share (%), by Application 2025 & 2033
- Figure 22: North America Thin Film Materials Market Volume Share (%), by Application 2025 & 2033
- Figure 23: North America Thin Film Materials Market Revenue (billion), by Country 2025 & 2033
- Figure 24: North America Thin Film Materials Market Volume (K Tons), by Country 2025 & 2033
- Figure 25: North America Thin Film Materials Market Revenue Share (%), by Country 2025 & 2033
- Figure 26: North America Thin Film Materials Market Volume Share (%), by Country 2025 & 2033
- Figure 27: Europe Thin Film Materials Market Revenue (billion), by Type 2025 & 2033
- Figure 28: Europe Thin Film Materials Market Volume (K Tons), by Type 2025 & 2033
- Figure 29: Europe Thin Film Materials Market Revenue Share (%), by Type 2025 & 2033
- Figure 30: Europe Thin Film Materials Market Volume Share (%), by Type 2025 & 2033
- Figure 31: Europe Thin Film Materials Market Revenue (billion), by Application 2025 & 2033
- Figure 32: Europe Thin Film Materials Market Volume (K Tons), by Application 2025 & 2033
- Figure 33: Europe Thin Film Materials Market Revenue Share (%), by Application 2025 & 2033
- Figure 34: Europe Thin Film Materials Market Volume Share (%), by Application 2025 & 2033
- Figure 35: Europe Thin Film Materials Market Revenue (billion), by Country 2025 & 2033
- Figure 36: Europe Thin Film Materials Market Volume (K Tons), by Country 2025 & 2033
- Figure 37: Europe Thin Film Materials Market Revenue Share (%), by Country 2025 & 2033
- Figure 38: Europe Thin Film Materials Market Volume Share (%), by Country 2025 & 2033
- Figure 39: South America Thin Film Materials Market Revenue (billion), by Type 2025 & 2033
- Figure 40: South America Thin Film Materials Market Volume (K Tons), by Type 2025 & 2033
- Figure 41: South America Thin Film Materials Market Revenue Share (%), by Type 2025 & 2033
- Figure 42: South America Thin Film Materials Market Volume Share (%), by Type 2025 & 2033
- Figure 43: South America Thin Film Materials Market Revenue (billion), by Application 2025 & 2033
- Figure 44: South America Thin Film Materials Market Volume (K Tons), by Application 2025 & 2033
- Figure 45: South America Thin Film Materials Market Revenue Share (%), by Application 2025 & 2033
- Figure 46: South America Thin Film Materials Market Volume Share (%), by Application 2025 & 2033
- Figure 47: South America Thin Film Materials Market Revenue (billion), by Country 2025 & 2033
- Figure 48: South America Thin Film Materials Market Volume (K Tons), by Country 2025 & 2033
- Figure 49: South America Thin Film Materials Market Revenue Share (%), by Country 2025 & 2033
- Figure 50: South America Thin Film Materials Market Volume Share (%), by Country 2025 & 2033
- Figure 51: Middle East and Africa Thin Film Materials Market Revenue (billion), by Type 2025 & 2033
- Figure 52: Middle East and Africa Thin Film Materials Market Volume (K Tons), by Type 2025 & 2033
- Figure 53: Middle East and Africa Thin Film Materials Market Revenue Share (%), by Type 2025 & 2033
- Figure 54: Middle East and Africa Thin Film Materials Market Volume Share (%), by Type 2025 & 2033
- Figure 55: Middle East and Africa Thin Film Materials Market Revenue (billion), by Application 2025 & 2033
- Figure 56: Middle East and Africa Thin Film Materials Market Volume (K Tons), by Application 2025 & 2033
- Figure 57: Middle East and Africa Thin Film Materials Market Revenue Share (%), by Application 2025 & 2033
- Figure 58: Middle East and Africa Thin Film Materials Market Volume Share (%), by Application 2025 & 2033
- Figure 59: Middle East and Africa Thin Film Materials Market Revenue (billion), by Country 2025 & 2033
- Figure 60: Middle East and Africa Thin Film Materials Market Volume (K Tons), by Country 2025 & 2033
- Figure 61: Middle East and Africa Thin Film Materials Market Revenue Share (%), by Country 2025 & 2033
- Figure 62: Middle East and Africa Thin Film Materials Market Volume Share (%), by Country 2025 & 2033
List of Tables
- Table 1: Global Thin Film Materials Market Revenue billion Forecast, by Type 2020 & 2033
- Table 2: Global Thin Film Materials Market Volume K Tons Forecast, by Type 2020 & 2033
- Table 3: Global Thin Film Materials Market Revenue billion Forecast, by Application 2020 & 2033
- Table 4: Global Thin Film Materials Market Volume K Tons Forecast, by Application 2020 & 2033
- Table 5: Global Thin Film Materials Market Revenue billion Forecast, by Region 2020 & 2033
- Table 6: Global Thin Film Materials Market Volume K Tons Forecast, by Region 2020 & 2033
- Table 7: Global Thin Film Materials Market Revenue billion Forecast, by Type 2020 & 2033
- Table 8: Global Thin Film Materials Market Volume K Tons Forecast, by Type 2020 & 2033
- Table 9: Global Thin Film Materials Market Revenue billion Forecast, by Application 2020 & 2033
- Table 10: Global Thin Film Materials Market Volume K Tons Forecast, by Application 2020 & 2033
- Table 11: Global Thin Film Materials Market Revenue billion Forecast, by Country 2020 & 2033
- Table 12: Global Thin Film Materials Market Volume K Tons Forecast, by Country 2020 & 2033
- Table 13: China Thin Film Materials Market Revenue (billion) Forecast, by Application 2020 & 2033
- Table 14: China Thin Film Materials Market Volume (K Tons) Forecast, by Application 2020 & 2033
- Table 15: India Thin Film Materials Market Revenue (billion) Forecast, by Application 2020 & 2033
- Table 16: India Thin Film Materials Market Volume (K Tons) Forecast, by Application 2020 & 2033
- Table 17: Japan Thin Film Materials Market Revenue (billion) Forecast, by Application 2020 & 2033
- Table 18: Japan Thin Film Materials Market Volume (K Tons) Forecast, by Application 2020 & 2033
- Table 19: South Korea Thin Film Materials Market Revenue (billion) Forecast, by Application 2020 & 2033
- Table 20: South Korea Thin Film Materials Market Volume (K Tons) Forecast, by Application 2020 & 2033
- Table 21: Rest of Asia Pacific Thin Film Materials Market Revenue (billion) Forecast, by Application 2020 & 2033
- Table 22: Rest of Asia Pacific Thin Film Materials Market Volume (K Tons) Forecast, by Application 2020 & 2033
- Table 23: Global Thin Film Materials Market Revenue billion Forecast, by Type 2020 & 2033
- Table 24: Global Thin Film Materials Market Volume K Tons Forecast, by Type 2020 & 2033
- Table 25: Global Thin Film Materials Market Revenue billion Forecast, by Application 2020 & 2033
- Table 26: Global Thin Film Materials Market Volume K Tons Forecast, by Application 2020 & 2033
- Table 27: Global Thin Film Materials Market Revenue billion Forecast, by Country 2020 & 2033
- Table 28: Global Thin Film Materials Market Volume K Tons Forecast, by Country 2020 & 2033
- Table 29: United States Thin Film Materials Market Revenue (billion) Forecast, by Application 2020 & 2033
- Table 30: United States Thin Film Materials Market Volume (K Tons) Forecast, by Application 2020 & 2033
- Table 31: Canada Thin Film Materials Market Revenue (billion) Forecast, by Application 2020 & 2033
- Table 32: Canada Thin Film Materials Market Volume (K Tons) Forecast, by Application 2020 & 2033
- Table 33: Mexico Thin Film Materials Market Revenue (billion) Forecast, by Application 2020 & 2033
- Table 34: Mexico Thin Film Materials Market Volume (K Tons) Forecast, by Application 2020 & 2033
- Table 35: Global Thin Film Materials Market Revenue billion Forecast, by Type 2020 & 2033
- Table 36: Global Thin Film Materials Market Volume K Tons Forecast, by Type 2020 & 2033
- Table 37: Global Thin Film Materials Market Revenue billion Forecast, by Application 2020 & 2033
- Table 38: Global Thin Film Materials Market Volume K Tons Forecast, by Application 2020 & 2033
- Table 39: Global Thin Film Materials Market Revenue billion Forecast, by Country 2020 & 2033
- Table 40: Global Thin Film Materials Market Volume K Tons Forecast, by Country 2020 & 2033
- Table 41: Germany Thin Film Materials Market Revenue (billion) Forecast, by Application 2020 & 2033
- Table 42: Germany Thin Film Materials Market Volume (K Tons) Forecast, by Application 2020 & 2033
- Table 43: United Kingdom Thin Film Materials Market Revenue (billion) Forecast, by Application 2020 & 2033
- Table 44: United Kingdom Thin Film Materials Market Volume (K Tons) Forecast, by Application 2020 & 2033
- Table 45: Italy Thin Film Materials Market Revenue (billion) Forecast, by Application 2020 & 2033
- Table 46: Italy Thin Film Materials Market Volume (K Tons) Forecast, by Application 2020 & 2033
- Table 47: France Thin Film Materials Market Revenue (billion) Forecast, by Application 2020 & 2033
- Table 48: France Thin Film Materials Market Volume (K Tons) Forecast, by Application 2020 & 2033
- Table 49: Spain Thin Film Materials Market Revenue (billion) Forecast, by Application 2020 & 2033
- Table 50: Spain Thin Film Materials Market Volume (K Tons) Forecast, by Application 2020 & 2033
- Table 51: Rest of Europe Thin Film Materials Market Revenue (billion) Forecast, by Application 2020 & 2033
- Table 52: Rest of Europe Thin Film Materials Market Volume (K Tons) Forecast, by Application 2020 & 2033
- Table 53: Global Thin Film Materials Market Revenue billion Forecast, by Type 2020 & 2033
- Table 54: Global Thin Film Materials Market Volume K Tons Forecast, by Type 2020 & 2033
- Table 55: Global Thin Film Materials Market Revenue billion Forecast, by Application 2020 & 2033
- Table 56: Global Thin Film Materials Market Volume K Tons Forecast, by Application 2020 & 2033
- Table 57: Global Thin Film Materials Market Revenue billion Forecast, by Country 2020 & 2033
- Table 58: Global Thin Film Materials Market Volume K Tons Forecast, by Country 2020 & 2033
- Table 59: Brazil Thin Film Materials Market Revenue (billion) Forecast, by Application 2020 & 2033
- Table 60: Brazil Thin Film Materials Market Volume (K Tons) Forecast, by Application 2020 & 2033
- Table 61: Aregentina Thin Film Materials Market Revenue (billion) Forecast, by Application 2020 & 2033
- Table 62: Aregentina Thin Film Materials Market Volume (K Tons) Forecast, by Application 2020 & 2033
- Table 63: Rest of South America Thin Film Materials Market Revenue (billion) Forecast, by Application 2020 & 2033
- Table 64: Rest of South America Thin Film Materials Market Volume (K Tons) Forecast, by Application 2020 & 2033
- Table 65: Global Thin Film Materials Market Revenue billion Forecast, by Type 2020 & 2033
- Table 66: Global Thin Film Materials Market Volume K Tons Forecast, by Type 2020 & 2033
- Table 67: Global Thin Film Materials Market Revenue billion Forecast, by Application 2020 & 2033
- Table 68: Global Thin Film Materials Market Volume K Tons Forecast, by Application 2020 & 2033
- Table 69: Global Thin Film Materials Market Revenue billion Forecast, by Country 2020 & 2033
- Table 70: Global Thin Film Materials Market Volume K Tons Forecast, by Country 2020 & 2033
- Table 71: United Arab Emirates Thin Film Materials Market Revenue (billion) Forecast, by Application 2020 & 2033
- Table 72: United Arab Emirates Thin Film Materials Market Volume (K Tons) Forecast, by Application 2020 & 2033
- Table 73: Saudi Arabia Thin Film Materials Market Revenue (billion) Forecast, by Application 2020 & 2033
- Table 74: Saudi Arabia Thin Film Materials Market Volume (K Tons) Forecast, by Application 2020 & 2033
- Table 75: South Africa Thin Film Materials Market Revenue (billion) Forecast, by Application 2020 & 2033
- Table 76: South Africa Thin Film Materials Market Volume (K Tons) Forecast, by Application 2020 & 2033
- Table 77: Rest of Middle East and Africa Thin Film Materials Market Revenue (billion) Forecast, by Application 2020 & 2033
- Table 78: Rest of Middle East and Africa Thin Film Materials Market Volume (K Tons) Forecast, by Application 2020 & 2033
Frequently Asked Questions
1. What is the projected Compound Annual Growth Rate (CAGR) of the Thin Film Materials Market?
The projected CAGR is approximately 4.33%.
2. Which companies are prominent players in the Thin Film Materials Market?
Key companies in the market include First Solar, Trony Solar Holdings Co Ltd, Kaneka Corporation, Avancis GmbH, Stanford Advanced Materials, Cicor Management AG, Solar Frontier Kabushiki Kaisha, Ascent Solar Technologies Inc, Hanergy Thin Film Power Group Europe, Moser Baer India Limited.
3. What are the main segments of the Thin Film Materials Market?
The market segments include Type, Application.
4. Can you provide details about the market size?
The market size is estimated to be USD 19.67 billion as of 2022.
5. What are some drivers contributing to market growth?
; Growing Demand for Photo voltaic (PV) Cells; Increasing Application in Electronic Components.
6. What are the notable trends driving market growth?
Growing Demand for Photo voltaic Cells.
7. Are there any restraints impacting market growth?
; Availability of Close Substitutes; Other Restraints.
8. Can you provide examples of recent developments in the market?
N/A
9. What pricing options are available for accessing the report?
Pricing options include single-user, multi-user, and enterprise licenses priced at USD 4750, USD 5250, and USD 8750 respectively.
10. Is the market size provided in terms of value or volume?
The market size is provided in terms of value, measured in billion and volume, measured in K Tons.
11. Are there any specific market keywords associated with the report?
Yes, the market keyword associated with the report is "Thin Film Materials Market," which aids in identifying and referencing the specific market segment covered.
12. How do I determine which pricing option suits my needs best?
The pricing options vary based on user requirements and access needs. Individual users may opt for single-user licenses, while businesses requiring broader access may choose multi-user or enterprise licenses for cost-effective access to the report.
13. Are there any additional resources or data provided in the Thin Film Materials Market report?
While the report offers comprehensive insights, it's advisable to review the specific contents or supplementary materials provided to ascertain if additional resources or data are available.
14. How can I stay updated on further developments or reports in the Thin Film Materials Market?
To stay informed about further developments, trends, and reports in the Thin Film Materials Market, consider subscribing to industry newsletters, following relevant companies and organizations, or regularly checking reputable industry news sources and publications.
Methodology
Step 1 - Identification of Relevant Samples Size from Population Database


Step 2 - Approaches for Defining Global Market Size (Value, Volume* & Price*)

Note*: In applicable scenarios
Step 3 - Data Sources
Primary Research
- Web Analytics
- Survey Reports
- Research Institute
- Latest Research Reports
- Opinion Leaders
Secondary Research
- Annual Reports
- White Paper
- Latest Press Release
- Industry Association
- Paid Database
- Investor Presentations

Step 4 - Data Triangulation
Involves using different sources of information in order to increase the validity of a study
These sources are likely to be stakeholders in a program - participants, other researchers, program staff, other community members, and so on.
Then we put all data in single framework & apply various statistical tools to find out the dynamic on the market.
During the analysis stage, feedback from the stakeholder groups would be compared to determine areas of agreement as well as areas of divergence