

Key Insights
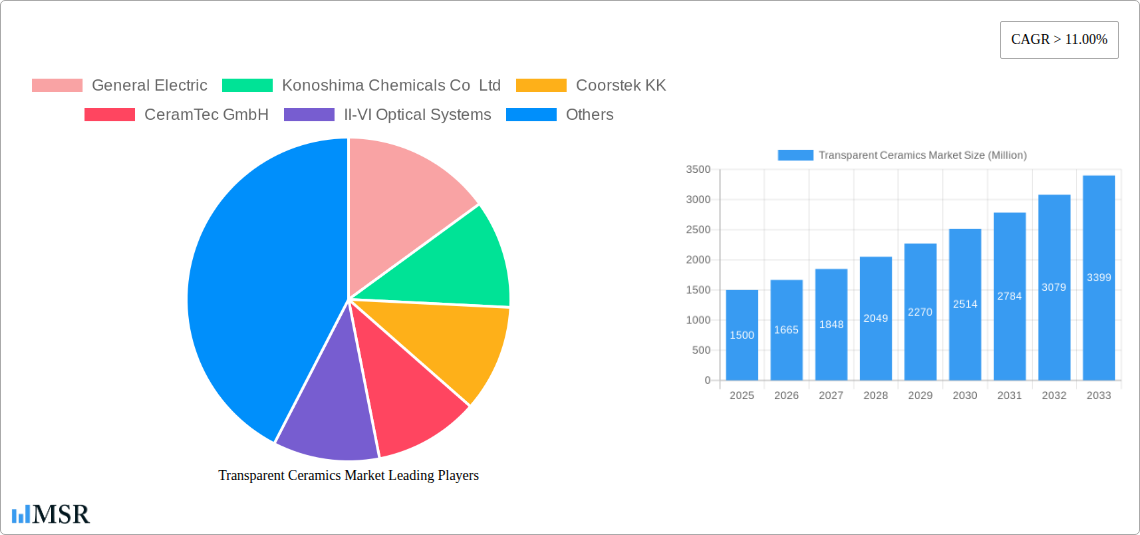
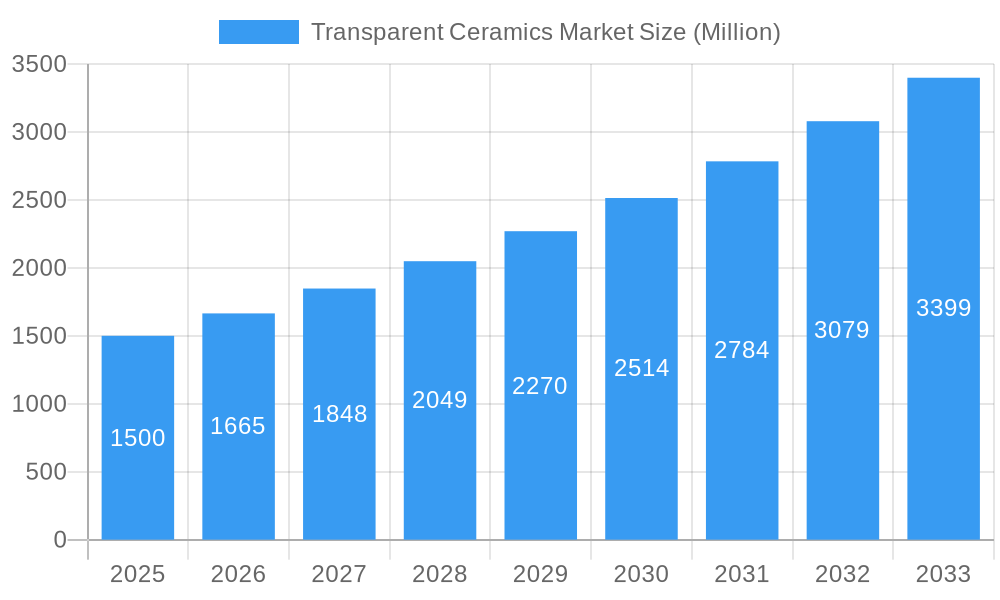
The transparent ceramics market is experiencing robust growth, projected to maintain a Compound Annual Growth Rate (CAGR) exceeding 11% from 2025 to 2033. This expansion is fueled by increasing demand across diverse sectors, primarily driven by advancements in aerospace and defense applications requiring high-performance optical components. The rising adoption of transparent ceramics in high-power lasers, infrared windows, and protective shields contributes significantly to market growth. Furthermore, the healthcare sector's increasing utilization of transparent ceramics in medical imaging and surgical tools further bolsters market expansion. Technological advancements leading to improved material properties, such as enhanced transparency and durability, are key drivers. While the market faces certain restraints, including the relatively high cost of production and the availability of alternative materials, the ongoing research and development efforts focused on cost reduction and performance enhancement are mitigating these challenges. The market is segmented by material type (Sapphire, YAG, Aluminum Oxynitride, YSZ, Spinel, and Others), application (Aerospace & Defense, Mechanical & Chemical, Healthcare, Consumer Goods, Energy, and Others), and structure (Crystalline and Non-crystalline). Major players like General Electric, Coorstek KK, and CeramTec GmbH are driving innovation and shaping market dynamics through strategic partnerships and technological advancements. Geographic analysis reveals strong growth across the Asia-Pacific region, particularly in China and India, driven by burgeoning industrialization and technological progress. North America and Europe maintain significant market shares, fueled by established technological advancements and strong research and development capabilities.
Transparent Ceramics Market Market Size (In Billion)
The competitive landscape is characterized by a mix of established players and emerging companies, leading to both competition and collaboration in the development of new technologies and applications. The future of the transparent ceramics market hinges on continued innovation in material science, cost optimization strategies, and the expansion into new application areas. The market's trajectory suggests significant growth opportunities for companies that effectively navigate these dynamics and leverage the increasing demand for high-performance, transparent ceramic components across a wide range of industries. Successful strategies will involve developing innovative material formulations, expanding production capacity, and establishing strong distribution networks to meet the growing global demand. Investing in research and development, particularly in areas like enhanced durability and cost reduction, will be crucial for maintaining a competitive edge in this rapidly expanding market.
Transparent Ceramics Market Company Market Share
Transparent Ceramics Market: A Comprehensive Report (2019-2033)
This in-depth report provides a comprehensive analysis of the Transparent Ceramics Market, offering invaluable insights for stakeholders across the value chain. The study covers the period 2019-2033, with a focus on the forecast period 2025-2033 and a base year of 2025. The report meticulously examines market dynamics, leading players, key segments (Sapphire, YAG, Aluminum Oxynitride, YSZ, Spinel, and other materials across Aerospace & Defense, Mechanical & Chemical, Healthcare, Consumer Goods, Energy, and other applications; Crystalline and Non-crystalline structures), and future growth opportunities. Expected market value is projected to reach xx Million by 2033.
Transparent Ceramics Market Market Concentration & Dynamics
The Transparent Ceramics Market exhibits a moderately consolidated structure, with key players such as General Electric, Konoshima Chemicals Co Ltd, Coorstek KK, and CeramTec GmbH holding significant market share. However, the market is characterized by ongoing innovation, particularly in material science and manufacturing processes. The regulatory landscape varies across different regions, influencing market access and product approvals. Substitute products, such as polymers and plastics, present competition, although transparent ceramics offer superior properties in specific applications. End-user trends favor high-performance materials with improved durability and thermal stability. The market has witnessed a moderate level of M&A activity in recent years, with approximately xx deals recorded between 2019 and 2024, resulting in increased market consolidation and technological advancement. Market share data for the top 5 players is estimated at xx%.
Transparent Ceramics Market Industry Insights & Trends
The Transparent Ceramics Market is experiencing robust growth, driven by increasing demand from diverse end-use sectors. The market size was valued at xx Million in 2025 and is projected to register a CAGR of xx% during the forecast period (2025-2033). This growth is fueled by several factors, including advancements in material science leading to enhanced performance characteristics (e.g., higher strength and optical clarity), the rising adoption of transparent ceramics in high-technology applications like aerospace and defense, and the increasing investments in research and development across the value chain. Technological disruptions such as the development of novel manufacturing techniques (e.g., additive manufacturing) further contribute to market expansion. Consumer behaviors are shifting towards more sustainable and energy-efficient products, fostering the demand for energy-efficient components that use transparent ceramics. The emergence of new applications in fields such as renewable energy and medical devices also drive market growth.
Key Markets & Segments Leading Transparent Ceramics Market
Dominant Regions/Countries: The North American region currently holds a dominant position in the Transparent Ceramics Market, driven by strong demand from aerospace & defense and healthcare industries. Asia-Pacific is projected to experience rapid growth during the forecast period, fueled by increased industrialization and infrastructure development. Europe represents a significant market with a stable demand pattern.
Dominant Materials: Sapphire currently dominates the market due to its exceptional optical properties and hardness. However, YAG and Aluminum Oxynitride are gaining traction, primarily due to their cost-effectiveness and suitability for specific applications.
Dominant Applications: Aerospace and defense applications account for the largest market share, driven by high demand for high-performance windows and optical components. The healthcare segment is also experiencing substantial growth, fueled by the increasing adoption of transparent ceramic components in medical devices and imaging systems.
Dominant Structures: Crystalline transparent ceramics dominate the market due to their superior optical and mechanical properties. However, the Non-crystalline segment is experiencing gradual growth driven by innovation in material processing techniques.
Drivers:
- Strong economic growth in key regions.
- Increasing investments in R&D.
- Technological advancements in material processing.
- Expanding applications in high-growth industries.
Transparent Ceramics Market Product Developments
Recent product developments have focused on improving the optical clarity, strength, and thermal stability of transparent ceramic materials. Innovations in manufacturing processes, such as additive manufacturing (3D printing) and hot-pressing, are enabling the production of complex shapes and improved material properties. These advancements are leading to the development of new applications for transparent ceramics, widening the market potential and expanding competitive edges among manufacturers.
Challenges in the Transparent Ceramics Market Market
The Transparent Ceramics Market faces challenges including high manufacturing costs, the complexity of producing high-quality materials, and competition from substitute materials. Regulatory hurdles related to material safety and environmental regulations also pose constraints. Supply chain disruptions and geopolitical uncertainties can impact material availability and pricing. These factors collectively reduce market growth by an estimated xx% annually.
Forces Driving Transparent Ceramics Market Growth
Key growth drivers include increasing demand from emerging economies, technological breakthroughs leading to improved material properties, and supportive government policies promoting advanced materials adoption. Investments in R&D and innovations in manufacturing processes also boost growth. Specifically, the increased adoption of transparent ceramics in 5G infrastructure and electric vehicles is a significant growth driver.
Long-Term Growth Catalysts in the Transparent Ceramics Market
Long-term growth will be fueled by continuous advancements in material science and processing, leading to enhanced performance and broader applications. Strategic partnerships between material suppliers, manufacturers, and end-users will accelerate market expansion. The exploration of new markets, particularly in renewable energy and advanced medical devices, promises significant long-term growth opportunities.
Emerging Opportunities in Transparent Ceramics Market
Emerging opportunities include the development of new transparent ceramic materials with enhanced properties, expansion into new applications like augmented and virtual reality devices, and increasing adoption in sustainable energy technologies. The growing demand for lightweight and high-strength components in aerospace and automotive industries offers significant potential. Furthermore, personalized medicine and advanced diagnostics are creating new opportunities in the healthcare sector.
Leading Players in the Transparent Ceramics Market Sector
- General Electric
- Konoshima Chemicals Co Ltd
- Coorstek KK
- CeramTec GmbH
- II-VI Optical Systems
- Koninklijke Philips N V
- Surmet Corporation
- Saint-Gobain Group
- Cilas
- www.optocity.com
- CeraNova
- Deisenroth Engineering GmbH
- AGC Inc
- SCHOTT AG
Key Milestones in Transparent Ceramics Market Industry
- 2020: Introduction of a new high-strength Sapphire ceramic by Coorstek KK.
- 2021: Strategic partnership between General Electric and CeramTec GmbH for joint development of advanced transparent ceramic components.
- 2022: Acquisition of a smaller transparent ceramic manufacturer by Saint-Gobain Group.
- 2023: Launch of a new manufacturing process using additive manufacturing for YAG ceramics.
- 2024: Release of new regulatory guidelines impacting the use of certain transparent ceramics in medical devices.
Strategic Outlook for Transparent Ceramics Market Market
The Transparent Ceramics Market presents significant long-term growth potential, driven by continuous technological advancements, expansion into new applications, and increasing demand from diverse end-use sectors. Strategic opportunities exist for manufacturers focusing on developing high-performance, cost-effective materials and establishing strong partnerships across the value chain. The market is poised for sustained growth, particularly in high-growth regions like Asia-Pacific, driven by increased infrastructure investments and adoption in advanced technologies.
Transparent Ceramics Market Segmentation
-
1. Structure
- 1.1. Crystalline
- 1.2. Non-crystalline
-
2. Material
- 2.1. Sapphire
- 2.2. Yttrium Aluminum Garnet (YAG)
- 2.3. Aluminum Oxynitride
- 2.4. Yttria-stabilized zirconia (YSZ)
- 2.5. Spinel
- 2.6. Other Materials
-
3. Application
- 3.1. Aerospace and Defense
- 3.2. Mechanical and Chemical
- 3.3. Healthcare
- 3.4. Consumer Goods
- 3.5. Energy
- 3.6. Other Applications
Transparent Ceramics Market Segmentation By Geography
-
1. Asia Pacific
- 1.1. China
- 1.2. India
- 1.3. Japan
- 1.4. South Korea
- 1.5. Australia
- 2. Rest of Asia Pacific
-
3. North America
- 3.1. United States
- 3.2. Canada
- 3.3. Mexico
- 3.4. Rest of North America
-
4. Europe
- 4.1. Germany
- 4.2. United Kingdom
- 4.3. Italy
- 4.4. France
- 4.5. Rest of Europe
-
5. South America
- 5.1. Brazil
- 5.2. Argentina
- 5.3. Rest of South America
-
6. Middle East and Africa
- 6.1. Saudi Arabia
- 6.2. South Africa
- 6.3. Rest of Middle East and Africa

Transparent Ceramics Market Regional Market Share
Geographic Coverage of Transparent Ceramics Market
Transparent Ceramics Market REPORT HIGHLIGHTS
| Aspects | Details |
|---|---|
| Study Period | 2020-2034 |
| Base Year | 2025 |
| Estimated Year | 2026 |
| Forecast Period | 2026-2034 |
| Historical Period | 2020-2025 |
| Growth Rate | CAGR of 17.6% from 2020-2034 |
| Segmentation |
|
Table of Contents
- 1. Introduction
- 1.1. Research Scope
- 1.2. Market Segmentation
- 1.3. Research Objective
- 1.4. Definitions and Assumptions
- 2. Executive Summary
- 2.1. Market Snapshot
- 3. Market Dynamics
- 3.1. Market Drivers
- 3.2. Market Restrains
- 3.3. Market Trends
- 3.4. Market Opportunities
- 4. Market Factor Analysis
- 4.1. Porters Five Forces
- 4.1.1. Bargaining Power of Suppliers
- 4.1.2. Bargaining Power of Buyers
- 4.1.3. Threat of New Entrants
- 4.1.4. Threat of Substitutes
- 4.1.5. Competitive Rivalry
- 4.2. PESTEL analysis
- 4.3. BCG Analysis
- 4.3.1. Stars (High Growth, High Market Share)
- 4.3.2. Cash Cows (Low Growth, High Market Share)
- 4.3.3. Question Mark (High Growth, Low Market Share)
- 4.3.4. Dogs (Low Growth, Low Market Share)
- 4.4. Ansoff Matrix Analysis
- 4.5. Supply Chain Analysis
- 4.6. Regulatory Landscape
- 4.7. Current Market Potential and Opportunity Assessment (TAM–SAM–SOM Framework)
- 4.8. MSR Analyst Note
- 4.1. Porters Five Forces
- 5. Market Analysis, Insights and Forecast 2021-2033
- 5.1. Market Analysis, Insights and Forecast - by Structure
- 5.1.1. Crystalline
- 5.1.2. Non-crystalline
- 5.2. Market Analysis, Insights and Forecast - by Material
- 5.2.1. Sapphire
- 5.2.2. Yttrium Aluminum Garnet (YAG)
- 5.2.3. Aluminum Oxynitride
- 5.2.4. Yttria-stabilized zirconia (YSZ)
- 5.2.5. Spinel
- 5.2.6. Other Materials
- 5.3. Market Analysis, Insights and Forecast - by Application
- 5.3.1. Aerospace and Defense
- 5.3.2. Mechanical and Chemical
- 5.3.3. Healthcare
- 5.3.4. Consumer Goods
- 5.3.5. Energy
- 5.3.6. Other Applications
- 5.4. Market Analysis, Insights and Forecast - by Region
- 5.4.1. Asia Pacific
- 5.4.2. Rest of Asia Pacific
- 5.4.3. North America
- 5.4.4. Europe
- 5.4.5. South America
- 5.4.6. Middle East and Africa
- 5.1. Market Analysis, Insights and Forecast - by Structure
- 6. Global Transparent Ceramics Market Analysis, Insights and Forecast, 2021-2033
- 6.1. Market Analysis, Insights and Forecast - by Structure
- 6.1.1. Crystalline
- 6.1.2. Non-crystalline
- 6.2. Market Analysis, Insights and Forecast - by Material
- 6.2.1. Sapphire
- 6.2.2. Yttrium Aluminum Garnet (YAG)
- 6.2.3. Aluminum Oxynitride
- 6.2.4. Yttria-stabilized zirconia (YSZ)
- 6.2.5. Spinel
- 6.2.6. Other Materials
- 6.3. Market Analysis, Insights and Forecast - by Application
- 6.3.1. Aerospace and Defense
- 6.3.2. Mechanical and Chemical
- 6.3.3. Healthcare
- 6.3.4. Consumer Goods
- 6.3.5. Energy
- 6.3.6. Other Applications
- 6.1. Market Analysis, Insights and Forecast - by Structure
- 7. Asia Pacific Transparent Ceramics Market Analysis, Insights and Forecast, 2020-2032
- 7.1. Market Analysis, Insights and Forecast - by Structure
- 7.1.1. Crystalline
- 7.1.2. Non-crystalline
- 7.2. Market Analysis, Insights and Forecast - by Material
- 7.2.1. Sapphire
- 7.2.2. Yttrium Aluminum Garnet (YAG)
- 7.2.3. Aluminum Oxynitride
- 7.2.4. Yttria-stabilized zirconia (YSZ)
- 7.2.5. Spinel
- 7.2.6. Other Materials
- 7.3. Market Analysis, Insights and Forecast - by Application
- 7.3.1. Aerospace and Defense
- 7.3.2. Mechanical and Chemical
- 7.3.3. Healthcare
- 7.3.4. Consumer Goods
- 7.3.5. Energy
- 7.3.6. Other Applications
- 7.1. Market Analysis, Insights and Forecast - by Structure
- 8. Rest of Asia Pacific Transparent Ceramics Market Analysis, Insights and Forecast, 2020-2032
- 8.1. Market Analysis, Insights and Forecast - by Structure
- 8.1.1. Crystalline
- 8.1.2. Non-crystalline
- 8.2. Market Analysis, Insights and Forecast - by Material
- 8.2.1. Sapphire
- 8.2.2. Yttrium Aluminum Garnet (YAG)
- 8.2.3. Aluminum Oxynitride
- 8.2.4. Yttria-stabilized zirconia (YSZ)
- 8.2.5. Spinel
- 8.2.6. Other Materials
- 8.3. Market Analysis, Insights and Forecast - by Application
- 8.3.1. Aerospace and Defense
- 8.3.2. Mechanical and Chemical
- 8.3.3. Healthcare
- 8.3.4. Consumer Goods
- 8.3.5. Energy
- 8.3.6. Other Applications
- 8.1. Market Analysis, Insights and Forecast - by Structure
- 9. North America Transparent Ceramics Market Analysis, Insights and Forecast, 2020-2032
- 9.1. Market Analysis, Insights and Forecast - by Structure
- 9.1.1. Crystalline
- 9.1.2. Non-crystalline
- 9.2. Market Analysis, Insights and Forecast - by Material
- 9.2.1. Sapphire
- 9.2.2. Yttrium Aluminum Garnet (YAG)
- 9.2.3. Aluminum Oxynitride
- 9.2.4. Yttria-stabilized zirconia (YSZ)
- 9.2.5. Spinel
- 9.2.6. Other Materials
- 9.3. Market Analysis, Insights and Forecast - by Application
- 9.3.1. Aerospace and Defense
- 9.3.2. Mechanical and Chemical
- 9.3.3. Healthcare
- 9.3.4. Consumer Goods
- 9.3.5. Energy
- 9.3.6. Other Applications
- 9.1. Market Analysis, Insights and Forecast - by Structure
- 10. Europe Transparent Ceramics Market Analysis, Insights and Forecast, 2020-2032
- 10.1. Market Analysis, Insights and Forecast - by Structure
- 10.1.1. Crystalline
- 10.1.2. Non-crystalline
- 10.2. Market Analysis, Insights and Forecast - by Material
- 10.2.1. Sapphire
- 10.2.2. Yttrium Aluminum Garnet (YAG)
- 10.2.3. Aluminum Oxynitride
- 10.2.4. Yttria-stabilized zirconia (YSZ)
- 10.2.5. Spinel
- 10.2.6. Other Materials
- 10.3. Market Analysis, Insights and Forecast - by Application
- 10.3.1. Aerospace and Defense
- 10.3.2. Mechanical and Chemical
- 10.3.3. Healthcare
- 10.3.4. Consumer Goods
- 10.3.5. Energy
- 10.3.6. Other Applications
- 10.1. Market Analysis, Insights and Forecast - by Structure
- 11. South America Transparent Ceramics Market Analysis, Insights and Forecast, 2020-2032
- 11.1. Market Analysis, Insights and Forecast - by Structure
- 11.1.1. Crystalline
- 11.1.2. Non-crystalline
- 11.2. Market Analysis, Insights and Forecast - by Material
- 11.2.1. Sapphire
- 11.2.2. Yttrium Aluminum Garnet (YAG)
- 11.2.3. Aluminum Oxynitride
- 11.2.4. Yttria-stabilized zirconia (YSZ)
- 11.2.5. Spinel
- 11.2.6. Other Materials
- 11.3. Market Analysis, Insights and Forecast - by Application
- 11.3.1. Aerospace and Defense
- 11.3.2. Mechanical and Chemical
- 11.3.3. Healthcare
- 11.3.4. Consumer Goods
- 11.3.5. Energy
- 11.3.6. Other Applications
- 11.1. Market Analysis, Insights and Forecast - by Structure
- 12. Middle East and Africa Transparent Ceramics Market Analysis, Insights and Forecast, 2020-2032
- 12.1. Market Analysis, Insights and Forecast - by Structure
- 12.1.1. Crystalline
- 12.1.2. Non-crystalline
- 12.2. Market Analysis, Insights and Forecast - by Material
- 12.2.1. Sapphire
- 12.2.2. Yttrium Aluminum Garnet (YAG)
- 12.2.3. Aluminum Oxynitride
- 12.2.4. Yttria-stabilized zirconia (YSZ)
- 12.2.5. Spinel
- 12.2.6. Other Materials
- 12.3. Market Analysis, Insights and Forecast - by Application
- 12.3.1. Aerospace and Defense
- 12.3.2. Mechanical and Chemical
- 12.3.3. Healthcare
- 12.3.4. Consumer Goods
- 12.3.5. Energy
- 12.3.6. Other Applications
- 12.1. Market Analysis, Insights and Forecast - by Structure
- 13. Competitive Analysis
- 13.1. Company Profiles
- 13.1.1 General Electric
- 13.1.1.1. Company Overview
- 13.1.1.2. Products
- 13.1.1.3. Company Financials
- 13.1.1.4. SWOT Analysis
- 13.1.2 Konoshima Chemicals Co Ltd
- 13.1.2.1. Company Overview
- 13.1.2.2. Products
- 13.1.2.3. Company Financials
- 13.1.2.4. SWOT Analysis
- 13.1.3 Coorstek KK
- 13.1.3.1. Company Overview
- 13.1.3.2. Products
- 13.1.3.3. Company Financials
- 13.1.3.4. SWOT Analysis
- 13.1.4 CeramTec GmbH
- 13.1.4.1. Company Overview
- 13.1.4.2. Products
- 13.1.4.3. Company Financials
- 13.1.4.4. SWOT Analysis
- 13.1.5 II-VI Optical Systems
- 13.1.5.1. Company Overview
- 13.1.5.2. Products
- 13.1.5.3. Company Financials
- 13.1.5.4. SWOT Analysis
- 13.1.6 Koninklijke Philips N V
- 13.1.6.1. Company Overview
- 13.1.6.2. Products
- 13.1.6.3. Company Financials
- 13.1.6.4. SWOT Analysis
- 13.1.7 Surmet Corporation*List Not Exhaustive
- 13.1.7.1. Company Overview
- 13.1.7.2. Products
- 13.1.7.3. Company Financials
- 13.1.7.4. SWOT Analysis
- 13.1.8 Saint-Gobain Group
- 13.1.8.1. Company Overview
- 13.1.8.2. Products
- 13.1.8.3. Company Financials
- 13.1.8.4. SWOT Analysis
- 13.1.9 Cilas
- 13.1.9.1. Company Overview
- 13.1.9.2. Products
- 13.1.9.3. Company Financials
- 13.1.9.4. SWOT Analysis
- 13.1.10 www optocity com
- 13.1.10.1. Company Overview
- 13.1.10.2. Products
- 13.1.10.3. Company Financials
- 13.1.10.4. SWOT Analysis
- 13.1.11 CeraNova
- 13.1.11.1. Company Overview
- 13.1.11.2. Products
- 13.1.11.3. Company Financials
- 13.1.11.4. SWOT Analysis
- 13.1.12 Deisenroth Engineering GmbH
- 13.1.12.1. Company Overview
- 13.1.12.2. Products
- 13.1.12.3. Company Financials
- 13.1.12.4. SWOT Analysis
- 13.1.13 AGC Inc
- 13.1.13.1. Company Overview
- 13.1.13.2. Products
- 13.1.13.3. Company Financials
- 13.1.13.4. SWOT Analysis
- 13.1.14 SCHOTT AG
- 13.1.14.1. Company Overview
- 13.1.14.2. Products
- 13.1.14.3. Company Financials
- 13.1.14.4. SWOT Analysis
- 13.1.1 General Electric
- 13.2. Market Entropy
- 13.2.1 Company's Key Areas Served
- 13.2.2 Recent Developments
- 13.3. Company Market Share Analysis 2025
- 13.3.1 Top 5 Companies Market Share Analysis
- 13.3.2 Top 3 Companies Market Share Analysis
- 13.4. List of Potential Customers
- 14. Research Methodology
List of Figures
- Figure 1: Global Transparent Ceramics Market Revenue Breakdown (million, %) by Region 2025 & 2033
- Figure 2: Asia Pacific Transparent Ceramics Market Revenue (million), by Structure 2025 & 2033
- Figure 3: Asia Pacific Transparent Ceramics Market Revenue Share (%), by Structure 2025 & 2033
- Figure 4: Asia Pacific Transparent Ceramics Market Revenue (million), by Material 2025 & 2033
- Figure 5: Asia Pacific Transparent Ceramics Market Revenue Share (%), by Material 2025 & 2033
- Figure 6: Asia Pacific Transparent Ceramics Market Revenue (million), by Application 2025 & 2033
- Figure 7: Asia Pacific Transparent Ceramics Market Revenue Share (%), by Application 2025 & 2033
- Figure 8: Asia Pacific Transparent Ceramics Market Revenue (million), by Country 2025 & 2033
- Figure 9: Asia Pacific Transparent Ceramics Market Revenue Share (%), by Country 2025 & 2033
- Figure 10: Rest of Asia Pacific Transparent Ceramics Market Revenue (million), by Structure 2025 & 2033
- Figure 11: Rest of Asia Pacific Transparent Ceramics Market Revenue Share (%), by Structure 2025 & 2033
- Figure 12: Rest of Asia Pacific Transparent Ceramics Market Revenue (million), by Material 2025 & 2033
- Figure 13: Rest of Asia Pacific Transparent Ceramics Market Revenue Share (%), by Material 2025 & 2033
- Figure 14: Rest of Asia Pacific Transparent Ceramics Market Revenue (million), by Application 2025 & 2033
- Figure 15: Rest of Asia Pacific Transparent Ceramics Market Revenue Share (%), by Application 2025 & 2033
- Figure 16: Rest of Asia Pacific Transparent Ceramics Market Revenue (million), by Country 2025 & 2033
- Figure 17: Rest of Asia Pacific Transparent Ceramics Market Revenue Share (%), by Country 2025 & 2033
- Figure 18: North America Transparent Ceramics Market Revenue (million), by Structure 2025 & 2033
- Figure 19: North America Transparent Ceramics Market Revenue Share (%), by Structure 2025 & 2033
- Figure 20: North America Transparent Ceramics Market Revenue (million), by Material 2025 & 2033
- Figure 21: North America Transparent Ceramics Market Revenue Share (%), by Material 2025 & 2033
- Figure 22: North America Transparent Ceramics Market Revenue (million), by Application 2025 & 2033
- Figure 23: North America Transparent Ceramics Market Revenue Share (%), by Application 2025 & 2033
- Figure 24: North America Transparent Ceramics Market Revenue (million), by Country 2025 & 2033
- Figure 25: North America Transparent Ceramics Market Revenue Share (%), by Country 2025 & 2033
- Figure 26: Europe Transparent Ceramics Market Revenue (million), by Structure 2025 & 2033
- Figure 27: Europe Transparent Ceramics Market Revenue Share (%), by Structure 2025 & 2033
- Figure 28: Europe Transparent Ceramics Market Revenue (million), by Material 2025 & 2033
- Figure 29: Europe Transparent Ceramics Market Revenue Share (%), by Material 2025 & 2033
- Figure 30: Europe Transparent Ceramics Market Revenue (million), by Application 2025 & 2033
- Figure 31: Europe Transparent Ceramics Market Revenue Share (%), by Application 2025 & 2033
- Figure 32: Europe Transparent Ceramics Market Revenue (million), by Country 2025 & 2033
- Figure 33: Europe Transparent Ceramics Market Revenue Share (%), by Country 2025 & 2033
- Figure 34: South America Transparent Ceramics Market Revenue (million), by Structure 2025 & 2033
- Figure 35: South America Transparent Ceramics Market Revenue Share (%), by Structure 2025 & 2033
- Figure 36: South America Transparent Ceramics Market Revenue (million), by Material 2025 & 2033
- Figure 37: South America Transparent Ceramics Market Revenue Share (%), by Material 2025 & 2033
- Figure 38: South America Transparent Ceramics Market Revenue (million), by Application 2025 & 2033
- Figure 39: South America Transparent Ceramics Market Revenue Share (%), by Application 2025 & 2033
- Figure 40: South America Transparent Ceramics Market Revenue (million), by Country 2025 & 2033
- Figure 41: South America Transparent Ceramics Market Revenue Share (%), by Country 2025 & 2033
- Figure 42: Middle East and Africa Transparent Ceramics Market Revenue (million), by Structure 2025 & 2033
- Figure 43: Middle East and Africa Transparent Ceramics Market Revenue Share (%), by Structure 2025 & 2033
- Figure 44: Middle East and Africa Transparent Ceramics Market Revenue (million), by Material 2025 & 2033
- Figure 45: Middle East and Africa Transparent Ceramics Market Revenue Share (%), by Material 2025 & 2033
- Figure 46: Middle East and Africa Transparent Ceramics Market Revenue (million), by Application 2025 & 2033
- Figure 47: Middle East and Africa Transparent Ceramics Market Revenue Share (%), by Application 2025 & 2033
- Figure 48: Middle East and Africa Transparent Ceramics Market Revenue (million), by Country 2025 & 2033
- Figure 49: Middle East and Africa Transparent Ceramics Market Revenue Share (%), by Country 2025 & 2033
List of Tables
- Table 1: Global Transparent Ceramics Market Revenue million Forecast, by Structure 2020 & 2033
- Table 2: Global Transparent Ceramics Market Revenue million Forecast, by Material 2020 & 2033
- Table 3: Global Transparent Ceramics Market Revenue million Forecast, by Application 2020 & 2033
- Table 4: Global Transparent Ceramics Market Revenue million Forecast, by Region 2020 & 2033
- Table 5: Global Transparent Ceramics Market Revenue million Forecast, by Structure 2020 & 2033
- Table 6: Global Transparent Ceramics Market Revenue million Forecast, by Material 2020 & 2033
- Table 7: Global Transparent Ceramics Market Revenue million Forecast, by Application 2020 & 2033
- Table 8: Global Transparent Ceramics Market Revenue million Forecast, by Country 2020 & 2033
- Table 9: China Transparent Ceramics Market Revenue (million) Forecast, by Application 2020 & 2033
- Table 10: India Transparent Ceramics Market Revenue (million) Forecast, by Application 2020 & 2033
- Table 11: Japan Transparent Ceramics Market Revenue (million) Forecast, by Application 2020 & 2033
- Table 12: South Korea Transparent Ceramics Market Revenue (million) Forecast, by Application 2020 & 2033
- Table 13: Australia Transparent Ceramics Market Revenue (million) Forecast, by Application 2020 & 2033
- Table 14: Global Transparent Ceramics Market Revenue million Forecast, by Structure 2020 & 2033
- Table 15: Global Transparent Ceramics Market Revenue million Forecast, by Material 2020 & 2033
- Table 16: Global Transparent Ceramics Market Revenue million Forecast, by Application 2020 & 2033
- Table 17: Global Transparent Ceramics Market Revenue million Forecast, by Country 2020 & 2033
- Table 18: Global Transparent Ceramics Market Revenue million Forecast, by Structure 2020 & 2033
- Table 19: Global Transparent Ceramics Market Revenue million Forecast, by Material 2020 & 2033
- Table 20: Global Transparent Ceramics Market Revenue million Forecast, by Application 2020 & 2033
- Table 21: Global Transparent Ceramics Market Revenue million Forecast, by Country 2020 & 2033
- Table 22: United States Transparent Ceramics Market Revenue (million) Forecast, by Application 2020 & 2033
- Table 23: Canada Transparent Ceramics Market Revenue (million) Forecast, by Application 2020 & 2033
- Table 24: Mexico Transparent Ceramics Market Revenue (million) Forecast, by Application 2020 & 2033
- Table 25: Rest of North America Transparent Ceramics Market Revenue (million) Forecast, by Application 2020 & 2033
- Table 26: Global Transparent Ceramics Market Revenue million Forecast, by Structure 2020 & 2033
- Table 27: Global Transparent Ceramics Market Revenue million Forecast, by Material 2020 & 2033
- Table 28: Global Transparent Ceramics Market Revenue million Forecast, by Application 2020 & 2033
- Table 29: Global Transparent Ceramics Market Revenue million Forecast, by Country 2020 & 2033
- Table 30: Germany Transparent Ceramics Market Revenue (million) Forecast, by Application 2020 & 2033
- Table 31: United Kingdom Transparent Ceramics Market Revenue (million) Forecast, by Application 2020 & 2033
- Table 32: Italy Transparent Ceramics Market Revenue (million) Forecast, by Application 2020 & 2033
- Table 33: France Transparent Ceramics Market Revenue (million) Forecast, by Application 2020 & 2033
- Table 34: Rest of Europe Transparent Ceramics Market Revenue (million) Forecast, by Application 2020 & 2033
- Table 35: Global Transparent Ceramics Market Revenue million Forecast, by Structure 2020 & 2033
- Table 36: Global Transparent Ceramics Market Revenue million Forecast, by Material 2020 & 2033
- Table 37: Global Transparent Ceramics Market Revenue million Forecast, by Application 2020 & 2033
- Table 38: Global Transparent Ceramics Market Revenue million Forecast, by Country 2020 & 2033
- Table 39: Brazil Transparent Ceramics Market Revenue (million) Forecast, by Application 2020 & 2033
- Table 40: Argentina Transparent Ceramics Market Revenue (million) Forecast, by Application 2020 & 2033
- Table 41: Rest of South America Transparent Ceramics Market Revenue (million) Forecast, by Application 2020 & 2033
- Table 42: Global Transparent Ceramics Market Revenue million Forecast, by Structure 2020 & 2033
- Table 43: Global Transparent Ceramics Market Revenue million Forecast, by Material 2020 & 2033
- Table 44: Global Transparent Ceramics Market Revenue million Forecast, by Application 2020 & 2033
- Table 45: Global Transparent Ceramics Market Revenue million Forecast, by Country 2020 & 2033
- Table 46: Saudi Arabia Transparent Ceramics Market Revenue (million) Forecast, by Application 2020 & 2033
- Table 47: South Africa Transparent Ceramics Market Revenue (million) Forecast, by Application 2020 & 2033
- Table 48: Rest of Middle East and Africa Transparent Ceramics Market Revenue (million) Forecast, by Application 2020 & 2033
Frequently Asked Questions
1. What is the projected Compound Annual Growth Rate (CAGR) of the Transparent Ceramics Market?
The projected CAGR is approximately 17.6%.
2. Which companies are prominent players in the Transparent Ceramics Market?
Key companies in the market include General Electric, Konoshima Chemicals Co Ltd, Coorstek KK, CeramTec GmbH, II-VI Optical Systems, Koninklijke Philips N V, Surmet Corporation*List Not Exhaustive, Saint-Gobain Group, Cilas, www optocity com, CeraNova, Deisenroth Engineering GmbH, AGC Inc, SCHOTT AG.
3. What are the main segments of the Transparent Ceramics Market?
The market segments include Structure, Material, Application.
4. Can you provide details about the market size?
The market size is estimated to be USD 782.62 million as of 2022.
5. What are some drivers contributing to market growth?
; Accelerating Usage in Optics and Optoelectronics; Increasing Demand in the Aerospace and Defense Sector; Advanced Ceramics Increasingly Replacing Plastics and Metals.
6. What are the notable trends driving market growth?
Increasing Demand from the Aerospace and Defense Sector.
7. Are there any restraints impacting market growth?
; High Cost; Other Restraints.
8. Can you provide examples of recent developments in the market?
N/A
9. What pricing options are available for accessing the report?
Pricing options include single-user, multi-user, and enterprise licenses priced at USD 4750, USD 5250, and USD 8750 respectively.
10. Is the market size provided in terms of value or volume?
The market size is provided in terms of value, measured in million.
11. Are there any specific market keywords associated with the report?
Yes, the market keyword associated with the report is "Transparent Ceramics Market," which aids in identifying and referencing the specific market segment covered.
12. How do I determine which pricing option suits my needs best?
The pricing options vary based on user requirements and access needs. Individual users may opt for single-user licenses, while businesses requiring broader access may choose multi-user or enterprise licenses for cost-effective access to the report.
13. Are there any additional resources or data provided in the Transparent Ceramics Market report?
While the report offers comprehensive insights, it's advisable to review the specific contents or supplementary materials provided to ascertain if additional resources or data are available.
14. How can I stay updated on further developments or reports in the Transparent Ceramics Market?
To stay informed about further developments, trends, and reports in the Transparent Ceramics Market, consider subscribing to industry newsletters, following relevant companies and organizations, or regularly checking reputable industry news sources and publications.
Methodology
Step 1 - Identification of Relevant Samples Size from Population Database


Step 2 - Approaches for Defining Global Market Size (Value, Volume* & Price*)

Note*: In applicable scenarios
Step 3 - Data Sources
Primary Research
- Web Analytics
- Survey Reports
- Research Institute
- Latest Research Reports
- Opinion Leaders
Secondary Research
- Annual Reports
- White Paper
- Latest Press Release
- Industry Association
- Paid Database
- Investor Presentations

Step 4 - Data Triangulation
Involves using different sources of information in order to increase the validity of a study
These sources are likely to be stakeholders in a program - participants, other researchers, program staff, other community members, and so on.
Then we put all data in single framework & apply various statistical tools to find out the dynamic on the market.
During the analysis stage, feedback from the stakeholder groups would be compared to determine areas of agreement as well as areas of divergence