

Key Insights
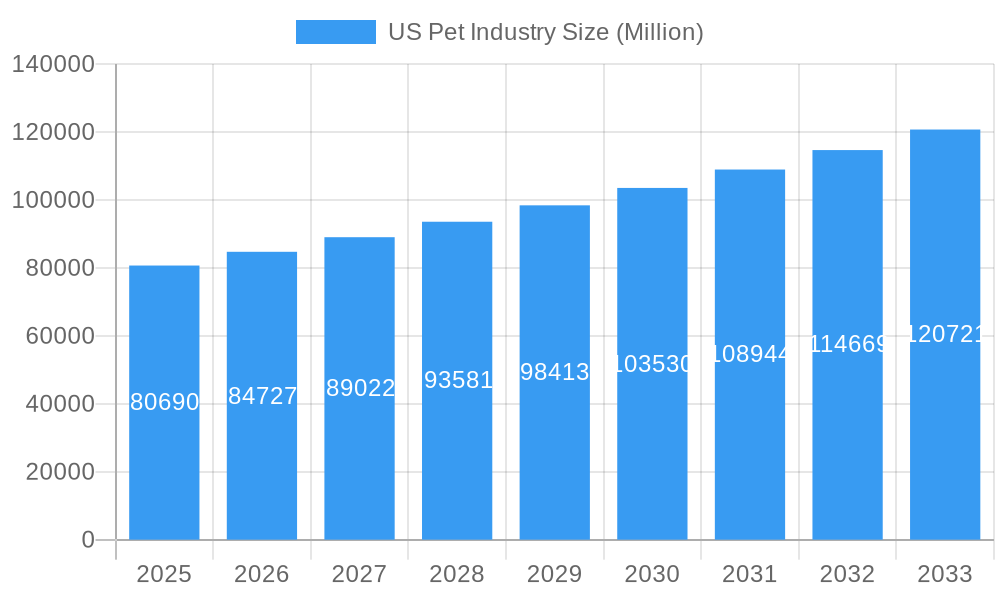
The US pet industry, a significant economic force, is projected to reach a market size of $80.69 billion in 2025, exhibiting a Compound Annual Growth Rate (CAGR) of 5.06% from 2019 to 2033. This robust growth is driven by several key factors. Increasing pet ownership, particularly among millennials and Gen Z, fuels demand for premium pet food, innovative pet supplies, and veterinary services. The humanization of pets, treating them as family members, leads to higher spending on pet care products and services. Furthermore, advancements in pet healthcare, including specialized diets and preventative medicine, contribute to market expansion. The increasing availability of online retail channels provides convenience for pet owners and enhances accessibility to a wider array of products. Regional variations exist within the US market; states with higher household incomes and a greater concentration of pet owners tend to exhibit stronger market performance. The competitive landscape is dominated by major players like Nestlé Purina, Mars Inc., and Colgate-Palmolive (Hill's Pet Nutrition), alongside smaller companies specializing in niche products or regional markets. These companies are engaged in ongoing innovation, focusing on healthier pet food formulations, sustainable packaging, and technologically advanced pet care solutions.
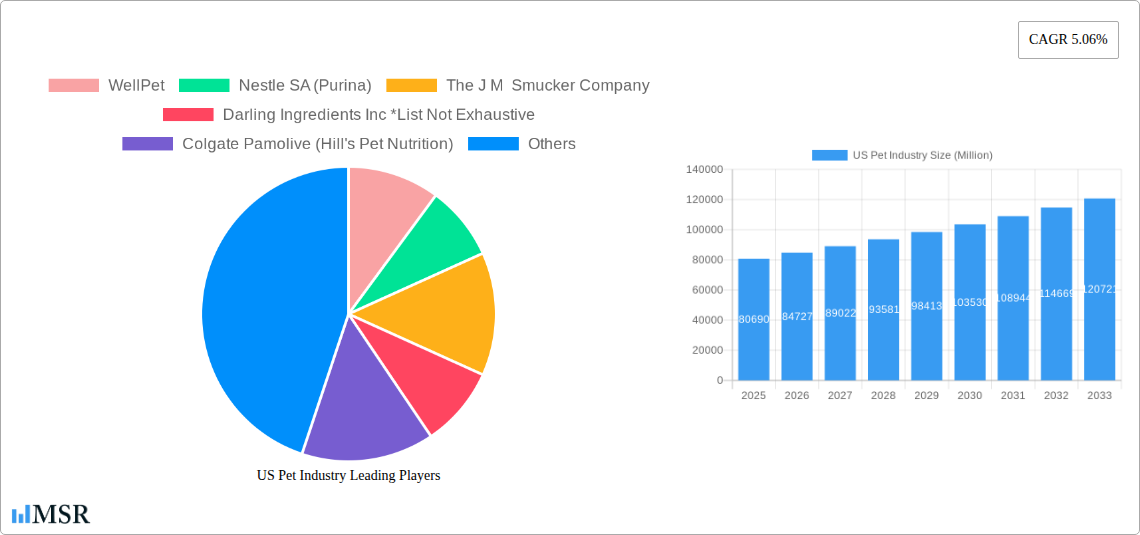
US Pet Industry Market Size (In Billion)
The segmentation of the US pet industry provides valuable insights into its dynamic structure. The "dog" segment consistently holds the largest market share within the pet type category, followed by cats. The "food" segment dominates product type sales, while supermarkets and hypermarkets remain the leading distribution channels. However, the rapid growth of online retail channels presents a compelling opportunity for businesses to expand their reach and tap into the growing preference for online shopping. Future growth will likely be shaped by the increasing demand for premium and specialized pet products, the growing adoption of pet insurance, and the continued development of personalized pet care solutions. Understanding these market trends is crucial for companies aiming to succeed in this competitive yet rapidly expanding industry.
US Pet Industry Company Market Share
US Pet Industry Market Report: 2019-2033 Forecast
This comprehensive report provides an in-depth analysis of the US pet industry, offering invaluable insights for stakeholders, investors, and industry professionals. Covering the period 2019-2033, with a focus on 2025, this report unveils the market's dynamics, growth drivers, and future potential. The US pet market, valued at $XXX Million in 2025, is poised for significant growth, reaching $XXX Million by 2033, exhibiting a CAGR of xx%.
US Pet Industry Market Concentration & Dynamics
The US pet industry is characterized by a moderately concentrated market structure, with key players like Mars Inc., Nestle SA (Purina), The J.M. Smucker Company, and Colgate-Palmolive (Hill's Pet Nutrition) holding significant market share. WellPet, Diamond Pet Foods, Blue Buffalo Co Ltd, and Darling Ingredients Inc also contribute substantially. Market share data for 2025 reveals that Mars Inc holds approximately xx% market share, followed by Nestle SA (Purina) at xx%, and the remaining players sharing the rest. Innovation within the industry is driven by the development of premium pet foods, personalized nutrition solutions, and technologically advanced pet supplies. Stringent regulatory frameworks, governed by the FDA and other agencies, ensure product safety and labeling accuracy. Substitute products, such as homemade pet food, pose a competitive challenge, impacting overall market concentration. Evolving consumer trends, including increased pet humanization and premiumization, further shape market dynamics. The industry also experiences consistent M&A activity, with xx major deals recorded between 2019 and 2024, signifying consolidation and expansion strategies among key players.
- Market Share (2025): Mars Inc - xx%, Nestle SA (Purina) - xx%, Others - xx%
- M&A Deals (2019-2024): xx
- Key Innovation Areas: Premium pet food, personalized nutrition, technologically advanced supplies.
US Pet Industry Industry Insights & Trends
The US pet industry demonstrates robust growth, fueled by several key factors. Rising pet ownership, particularly among millennials and Gen Z, contributes significantly to market expansion. Increased pet humanization, leading to higher spending on premium products and services, is another major driver. Technological advancements, such as personalized nutrition plans based on pet DNA and connected pet devices, are reshaping consumer expectations and creating new market segments. Changing consumer behavior, including a preference for natural and organic pet foods, influences product development and marketing strategies. The market's expansion is evident in the substantial growth in market size, reaching $XXX Million in 2025 from $XXX Million in 2019. This impressive growth reflects the evolving relationship between pet owners and their animals.
Key Markets & Segments Leading US Pet Industry
The US pet industry is segmented by pet type (dog, cat, bird, freshwater fish, other), product type (food, supplies/OTC medicine, other), and distribution channel (supermarket/hypermarket, specialty stores, online retail stores, other). Dogs and cats dominate the market by pet type, accounting for over xx% of total revenue in 2025. Pet food constitutes the largest product segment, followed by supplies and OTC medicine. Online retail stores are experiencing rapid growth, while supermarkets/hypermarkets remain a significant distribution channel.
Dominant Segments (2025):
- Pet Type: Dogs and Cats (xx%)
- Product Type: Pet Food (xx%)
- Distribution Channel: Supermarket/Hypermarket and Online Retail Stores (xx%)
Growth Drivers:
- Economic Growth: Disposable income increase leads to higher pet spending.
- Increased Pet Ownership: Rising adoption rates among younger demographics.
- Evolving Consumer Preferences: Demand for premium, natural, and specialized products.
US Pet Industry Product Developments
The US pet industry showcases continuous product innovation. Notable advancements include the development of novel pet food formulations tailored to specific dietary needs, incorporating functional ingredients for health benefits. Technological integrations, such as smart feeders and activity trackers, enhance pet care and offer convenience. These innovations drive market growth by addressing evolving consumer demands for advanced solutions, improving pet health, and enhancing the overall pet-owner experience. Competitive advantages are gained through unique formulations, patented technologies, and strong brand recognition.
Challenges in the US Pet Industry Market
The US pet industry faces challenges, including regulatory hurdles related to ingredient sourcing and labeling requirements, fluctuating raw material costs impacting supply chain stability, and intense competition driving price wars, particularly in the mass-market segment. These challenges are contributing to margin pressure for some players and requiring strategic adaptation to navigate a complex market environment. Quantifiable impacts include decreased profit margins and increased operational costs.
Forces Driving US Pet Industry Growth
Technological advancements in pet food and care products, strong economic conditions boosting consumer spending, and supportive regulatory frameworks promoting animal welfare are key growth drivers. The growing trend of pet humanization, leading to increased spending on premium products, further propels market growth. These factors create a positive environment for industry expansion and innovation.
Long-Term Growth Catalysts in the US Pet Industry
Long-term growth hinges on continuous innovation, strategic partnerships between pet care brands and technology companies, and expansion into niche market segments catering to specialized pet needs, such as senior pet care or pets with specific health conditions. The successful implementation of these strategies will position the US pet industry for sustained expansion.
Emerging Opportunities in US Pet Industry
Emerging opportunities include the growth of personalized pet nutrition based on genetic testing, the expansion of telehealth services for pets, and increasing consumer demand for sustainable and ethically sourced pet products. These areas offer significant potential for growth and innovation within the industry.
Leading Players in the US Pet Industry Sector
- WellPet
- Nestle SA (Purina)
- The J.M. Smucker Company
- Darling Ingredients Inc
- Colgate-Palmolive (Hill's Pet Nutrition)
- Pure and Natural Pet
- United Pet Group Inc
- Diamond Pet Foods
- Blue Buffalo Co Ltd
- Mars Inc.
Key Milestones in US Pet Industry Industry
- 2020: Increased demand for pet food during the COVID-19 pandemic.
- 2021: Launch of several innovative pet tech products.
- 2022: Significant investment in sustainable pet food production.
- 2023: Several major M&A transactions within the industry.
- 2024: Growth of the online pet supplies market.
Strategic Outlook for US Pet Industry Market
The US pet industry exhibits a promising long-term outlook, driven by continued growth in pet ownership, increasing pet humanization, and the adoption of innovative technologies. Strategic opportunities lie in capitalizing on these trends, focusing on premiumization, personalization, and sustainability. Companies that embrace these strategies will be well-positioned to capture significant market share in the years to come.
US Pet Industry Segmentation
-
1. Pet Type
- 1.1. Dog
- 1.2. Cat
- 1.3. Bird
- 1.4. Fresh Water Fish
- 1.5. Other Pet Types
-
2. Product Type
- 2.1. Food
- 2.2. Supplies/OTC Medicine
- 2.3. Other Product Types
-
3. Distribution Channel
- 3.1. Supermarkets/Hypermarkets
- 3.2. Specialty Stores
- 3.3. Online Retail Stores
- 3.4. Other Distribution Channels
US Pet Industry Segmentation By Geography
-
1. North America
- 1.1. United States
- 1.2. Canada
- 1.3. Mexico
-
2. South America
- 2.1. Brazil
- 2.2. Argentina
- 2.3. Rest of South America
-
3. Europe
- 3.1. United Kingdom
- 3.2. Germany
- 3.3. France
- 3.4. Italy
- 3.5. Spain
- 3.6. Russia
- 3.7. Benelux
- 3.8. Nordics
- 3.9. Rest of Europe
-
4. Middle East & Africa
- 4.1. Turkey
- 4.2. Israel
- 4.3. GCC
- 4.4. North Africa
- 4.5. South Africa
- 4.6. Rest of Middle East & Africa
-
5. Asia Pacific
- 5.1. China
- 5.2. India
- 5.3. Japan
- 5.4. South Korea
- 5.5. ASEAN
- 5.6. Oceania
- 5.7. Rest of Asia Pacific
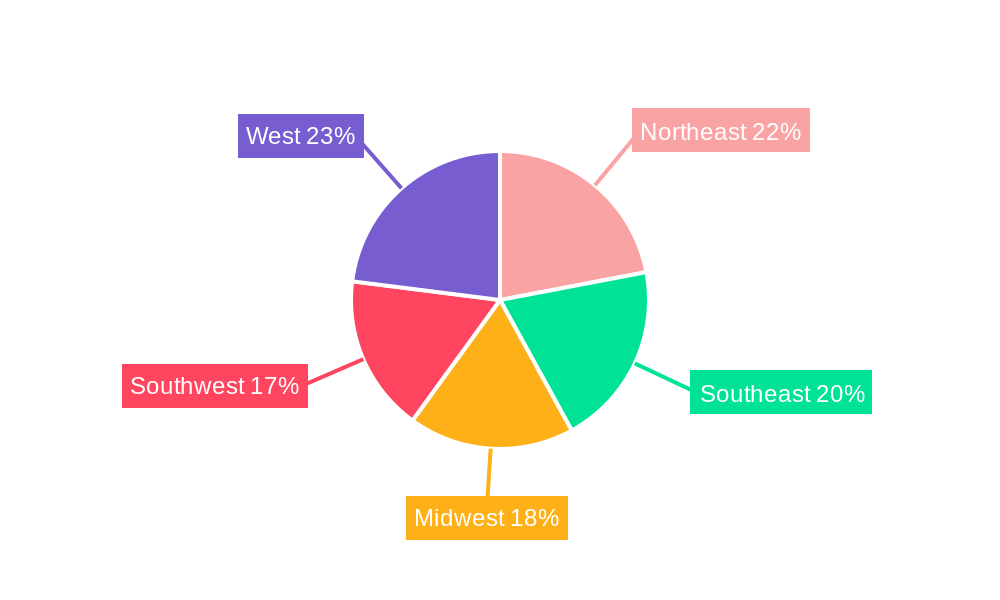
US Pet Industry Regional Market Share
Geographic Coverage of US Pet Industry
US Pet Industry REPORT HIGHLIGHTS
| Aspects | Details |
|---|---|
| Study Period | 2020-2034 |
| Base Year | 2025 |
| Estimated Year | 2026 |
| Forecast Period | 2026-2034 |
| Historical Period | 2020-2025 |
| Growth Rate | CAGR of 5.06% from 2020-2034 |
| Segmentation |
|
Table of Contents
- 1. Introduction
- 1.1. Research Scope
- 1.2. Market Segmentation
- 1.3. Research Objective
- 1.4. Definitions and Assumptions
- 2. Executive Summary
- 2.1. Market Snapshot
- 3. Market Dynamics
- 3.1. Market Drivers
- 3.2. Market Restrains
- 3.3. Market Trends
- 3.4. Market Opportunities
- 4. Market Factor Analysis
- 4.1. Porters Five Forces
- 4.1.1. Bargaining Power of Suppliers
- 4.1.2. Bargaining Power of Buyers
- 4.1.3. Threat of New Entrants
- 4.1.4. Threat of Substitutes
- 4.1.5. Competitive Rivalry
- 4.2. PESTEL analysis
- 4.3. BCG Analysis
- 4.3.1. Stars (High Growth, High Market Share)
- 4.3.2. Cash Cows (Low Growth, High Market Share)
- 4.3.3. Question Mark (High Growth, Low Market Share)
- 4.3.4. Dogs (Low Growth, Low Market Share)
- 4.4. Ansoff Matrix Analysis
- 4.5. Supply Chain Analysis
- 4.6. Regulatory Landscape
- 4.7. Current Market Potential and Opportunity Assessment (TAM–SAM–SOM Framework)
- 4.8. MSR Analyst Note
- 4.1. Porters Five Forces
- 5. Market Analysis, Insights and Forecast 2021-2033
- 5.1. Market Analysis, Insights and Forecast - by Pet Type
- 5.1.1. Dog
- 5.1.2. Cat
- 5.1.3. Bird
- 5.1.4. Fresh Water Fish
- 5.1.5. Other Pet Types
- 5.2. Market Analysis, Insights and Forecast - by Product Type
- 5.2.1. Food
- 5.2.2. Supplies/OTC Medicine
- 5.2.3. Other Product Types
- 5.3. Market Analysis, Insights and Forecast - by Distribution Channel
- 5.3.1. Supermarkets/Hypermarkets
- 5.3.2. Specialty Stores
- 5.3.3. Online Retail Stores
- 5.3.4. Other Distribution Channels
- 5.4. Market Analysis, Insights and Forecast - by Region
- 5.4.1. North America
- 5.4.2. South America
- 5.4.3. Europe
- 5.4.4. Middle East & Africa
- 5.4.5. Asia Pacific
- 5.1. Market Analysis, Insights and Forecast - by Pet Type
- 6. Global US Pet Industry Analysis, Insights and Forecast, 2021-2033
- 6.1. Market Analysis, Insights and Forecast - by Pet Type
- 6.1.1. Dog
- 6.1.2. Cat
- 6.1.3. Bird
- 6.1.4. Fresh Water Fish
- 6.1.5. Other Pet Types
- 6.2. Market Analysis, Insights and Forecast - by Product Type
- 6.2.1. Food
- 6.2.2. Supplies/OTC Medicine
- 6.2.3. Other Product Types
- 6.3. Market Analysis, Insights and Forecast - by Distribution Channel
- 6.3.1. Supermarkets/Hypermarkets
- 6.3.2. Specialty Stores
- 6.3.3. Online Retail Stores
- 6.3.4. Other Distribution Channels
- 6.1. Market Analysis, Insights and Forecast - by Pet Type
- 7. North America US Pet Industry Analysis, Insights and Forecast, 2020-2032
- 7.1. Market Analysis, Insights and Forecast - by Pet Type
- 7.1.1. Dog
- 7.1.2. Cat
- 7.1.3. Bird
- 7.1.4. Fresh Water Fish
- 7.1.5. Other Pet Types
- 7.2. Market Analysis, Insights and Forecast - by Product Type
- 7.2.1. Food
- 7.2.2. Supplies/OTC Medicine
- 7.2.3. Other Product Types
- 7.3. Market Analysis, Insights and Forecast - by Distribution Channel
- 7.3.1. Supermarkets/Hypermarkets
- 7.3.2. Specialty Stores
- 7.3.3. Online Retail Stores
- 7.3.4. Other Distribution Channels
- 7.1. Market Analysis, Insights and Forecast - by Pet Type
- 8. South America US Pet Industry Analysis, Insights and Forecast, 2020-2032
- 8.1. Market Analysis, Insights and Forecast - by Pet Type
- 8.1.1. Dog
- 8.1.2. Cat
- 8.1.3. Bird
- 8.1.4. Fresh Water Fish
- 8.1.5. Other Pet Types
- 8.2. Market Analysis, Insights and Forecast - by Product Type
- 8.2.1. Food
- 8.2.2. Supplies/OTC Medicine
- 8.2.3. Other Product Types
- 8.3. Market Analysis, Insights and Forecast - by Distribution Channel
- 8.3.1. Supermarkets/Hypermarkets
- 8.3.2. Specialty Stores
- 8.3.3. Online Retail Stores
- 8.3.4. Other Distribution Channels
- 8.1. Market Analysis, Insights and Forecast - by Pet Type
- 9. Europe US Pet Industry Analysis, Insights and Forecast, 2020-2032
- 9.1. Market Analysis, Insights and Forecast - by Pet Type
- 9.1.1. Dog
- 9.1.2. Cat
- 9.1.3. Bird
- 9.1.4. Fresh Water Fish
- 9.1.5. Other Pet Types
- 9.2. Market Analysis, Insights and Forecast - by Product Type
- 9.2.1. Food
- 9.2.2. Supplies/OTC Medicine
- 9.2.3. Other Product Types
- 9.3. Market Analysis, Insights and Forecast - by Distribution Channel
- 9.3.1. Supermarkets/Hypermarkets
- 9.3.2. Specialty Stores
- 9.3.3. Online Retail Stores
- 9.3.4. Other Distribution Channels
- 9.1. Market Analysis, Insights and Forecast - by Pet Type
- 10. Middle East & Africa US Pet Industry Analysis, Insights and Forecast, 2020-2032
- 10.1. Market Analysis, Insights and Forecast - by Pet Type
- 10.1.1. Dog
- 10.1.2. Cat
- 10.1.3. Bird
- 10.1.4. Fresh Water Fish
- 10.1.5. Other Pet Types
- 10.2. Market Analysis, Insights and Forecast - by Product Type
- 10.2.1. Food
- 10.2.2. Supplies/OTC Medicine
- 10.2.3. Other Product Types
- 10.3. Market Analysis, Insights and Forecast - by Distribution Channel
- 10.3.1. Supermarkets/Hypermarkets
- 10.3.2. Specialty Stores
- 10.3.3. Online Retail Stores
- 10.3.4. Other Distribution Channels
- 10.1. Market Analysis, Insights and Forecast - by Pet Type
- 11. Asia Pacific US Pet Industry Analysis, Insights and Forecast, 2020-2032
- 11.1. Market Analysis, Insights and Forecast - by Pet Type
- 11.1.1. Dog
- 11.1.2. Cat
- 11.1.3. Bird
- 11.1.4. Fresh Water Fish
- 11.1.5. Other Pet Types
- 11.2. Market Analysis, Insights and Forecast - by Product Type
- 11.2.1. Food
- 11.2.2. Supplies/OTC Medicine
- 11.2.3. Other Product Types
- 11.3. Market Analysis, Insights and Forecast - by Distribution Channel
- 11.3.1. Supermarkets/Hypermarkets
- 11.3.2. Specialty Stores
- 11.3.3. Online Retail Stores
- 11.3.4. Other Distribution Channels
- 11.1. Market Analysis, Insights and Forecast - by Pet Type
- 12. Competitive Analysis
- 12.1. Company Profiles
- 12.1.1 WellPet
- 12.1.1.1. Company Overview
- 12.1.1.2. Products
- 12.1.1.3. Company Financials
- 12.1.1.4. SWOT Analysis
- 12.1.2 Nestle SA (Purina)
- 12.1.2.1. Company Overview
- 12.1.2.2. Products
- 12.1.2.3. Company Financials
- 12.1.2.4. SWOT Analysis
- 12.1.3 The J M Smucker Company
- 12.1.3.1. Company Overview
- 12.1.3.2. Products
- 12.1.3.3. Company Financials
- 12.1.3.4. SWOT Analysis
- 12.1.4 Darling Ingredients Inc *List Not Exhaustive
- 12.1.4.1. Company Overview
- 12.1.4.2. Products
- 12.1.4.3. Company Financials
- 12.1.4.4. SWOT Analysis
- 12.1.5 Colgate Pamolive (Hill's Pet Nutrition)
- 12.1.5.1. Company Overview
- 12.1.5.2. Products
- 12.1.5.3. Company Financials
- 12.1.5.4. SWOT Analysis
- 12.1.6 Pure and Natural Pet
- 12.1.6.1. Company Overview
- 12.1.6.2. Products
- 12.1.6.3. Company Financials
- 12.1.6.4. SWOT Analysis
- 12.1.7 United Pet Group Inc
- 12.1.7.1. Company Overview
- 12.1.7.2. Products
- 12.1.7.3. Company Financials
- 12.1.7.4. SWOT Analysis
- 12.1.8 Diamond Pet Foods
- 12.1.8.1. Company Overview
- 12.1.8.2. Products
- 12.1.8.3. Company Financials
- 12.1.8.4. SWOT Analysis
- 12.1.9 Blue Buffalo Co Ltd
- 12.1.9.1. Company Overview
- 12.1.9.2. Products
- 12.1.9.3. Company Financials
- 12.1.9.4. SWOT Analysis
- 12.1.10 Mars Inc
- 12.1.10.1. Company Overview
- 12.1.10.2. Products
- 12.1.10.3. Company Financials
- 12.1.10.4. SWOT Analysis
- 12.1.1 WellPet
- 12.2. Market Entropy
- 12.2.1 Company's Key Areas Served
- 12.2.2 Recent Developments
- 12.3. Company Market Share Analysis 2025
- 12.3.1 Top 5 Companies Market Share Analysis
- 12.3.2 Top 3 Companies Market Share Analysis
- 12.4. List of Potential Customers
- 13. Research Methodology
List of Figures
- Figure 1: Global US Pet Industry Revenue Breakdown (Million, %) by Region 2025 & 2033
- Figure 2: North America US Pet Industry Revenue (Million), by Pet Type 2025 & 2033
- Figure 3: North America US Pet Industry Revenue Share (%), by Pet Type 2025 & 2033
- Figure 4: North America US Pet Industry Revenue (Million), by Product Type 2025 & 2033
- Figure 5: North America US Pet Industry Revenue Share (%), by Product Type 2025 & 2033
- Figure 6: North America US Pet Industry Revenue (Million), by Distribution Channel 2025 & 2033
- Figure 7: North America US Pet Industry Revenue Share (%), by Distribution Channel 2025 & 2033
- Figure 8: North America US Pet Industry Revenue (Million), by Country 2025 & 2033
- Figure 9: North America US Pet Industry Revenue Share (%), by Country 2025 & 2033
- Figure 10: South America US Pet Industry Revenue (Million), by Pet Type 2025 & 2033
- Figure 11: South America US Pet Industry Revenue Share (%), by Pet Type 2025 & 2033
- Figure 12: South America US Pet Industry Revenue (Million), by Product Type 2025 & 2033
- Figure 13: South America US Pet Industry Revenue Share (%), by Product Type 2025 & 2033
- Figure 14: South America US Pet Industry Revenue (Million), by Distribution Channel 2025 & 2033
- Figure 15: South America US Pet Industry Revenue Share (%), by Distribution Channel 2025 & 2033
- Figure 16: South America US Pet Industry Revenue (Million), by Country 2025 & 2033
- Figure 17: South America US Pet Industry Revenue Share (%), by Country 2025 & 2033
- Figure 18: Europe US Pet Industry Revenue (Million), by Pet Type 2025 & 2033
- Figure 19: Europe US Pet Industry Revenue Share (%), by Pet Type 2025 & 2033
- Figure 20: Europe US Pet Industry Revenue (Million), by Product Type 2025 & 2033
- Figure 21: Europe US Pet Industry Revenue Share (%), by Product Type 2025 & 2033
- Figure 22: Europe US Pet Industry Revenue (Million), by Distribution Channel 2025 & 2033
- Figure 23: Europe US Pet Industry Revenue Share (%), by Distribution Channel 2025 & 2033
- Figure 24: Europe US Pet Industry Revenue (Million), by Country 2025 & 2033
- Figure 25: Europe US Pet Industry Revenue Share (%), by Country 2025 & 2033
- Figure 26: Middle East & Africa US Pet Industry Revenue (Million), by Pet Type 2025 & 2033
- Figure 27: Middle East & Africa US Pet Industry Revenue Share (%), by Pet Type 2025 & 2033
- Figure 28: Middle East & Africa US Pet Industry Revenue (Million), by Product Type 2025 & 2033
- Figure 29: Middle East & Africa US Pet Industry Revenue Share (%), by Product Type 2025 & 2033
- Figure 30: Middle East & Africa US Pet Industry Revenue (Million), by Distribution Channel 2025 & 2033
- Figure 31: Middle East & Africa US Pet Industry Revenue Share (%), by Distribution Channel 2025 & 2033
- Figure 32: Middle East & Africa US Pet Industry Revenue (Million), by Country 2025 & 2033
- Figure 33: Middle East & Africa US Pet Industry Revenue Share (%), by Country 2025 & 2033
- Figure 34: Asia Pacific US Pet Industry Revenue (Million), by Pet Type 2025 & 2033
- Figure 35: Asia Pacific US Pet Industry Revenue Share (%), by Pet Type 2025 & 2033
- Figure 36: Asia Pacific US Pet Industry Revenue (Million), by Product Type 2025 & 2033
- Figure 37: Asia Pacific US Pet Industry Revenue Share (%), by Product Type 2025 & 2033
- Figure 38: Asia Pacific US Pet Industry Revenue (Million), by Distribution Channel 2025 & 2033
- Figure 39: Asia Pacific US Pet Industry Revenue Share (%), by Distribution Channel 2025 & 2033
- Figure 40: Asia Pacific US Pet Industry Revenue (Million), by Country 2025 & 2033
- Figure 41: Asia Pacific US Pet Industry Revenue Share (%), by Country 2025 & 2033
List of Tables
- Table 1: Global US Pet Industry Revenue Million Forecast, by Pet Type 2020 & 2033
- Table 2: Global US Pet Industry Revenue Million Forecast, by Product Type 2020 & 2033
- Table 3: Global US Pet Industry Revenue Million Forecast, by Distribution Channel 2020 & 2033
- Table 4: Global US Pet Industry Revenue Million Forecast, by Region 2020 & 2033
- Table 5: Global US Pet Industry Revenue Million Forecast, by Pet Type 2020 & 2033
- Table 6: Global US Pet Industry Revenue Million Forecast, by Product Type 2020 & 2033
- Table 7: Global US Pet Industry Revenue Million Forecast, by Distribution Channel 2020 & 2033
- Table 8: Global US Pet Industry Revenue Million Forecast, by Country 2020 & 2033
- Table 9: United States US Pet Industry Revenue (Million) Forecast, by Application 2020 & 2033
- Table 10: Canada US Pet Industry Revenue (Million) Forecast, by Application 2020 & 2033
- Table 11: Mexico US Pet Industry Revenue (Million) Forecast, by Application 2020 & 2033
- Table 12: Global US Pet Industry Revenue Million Forecast, by Pet Type 2020 & 2033
- Table 13: Global US Pet Industry Revenue Million Forecast, by Product Type 2020 & 2033
- Table 14: Global US Pet Industry Revenue Million Forecast, by Distribution Channel 2020 & 2033
- Table 15: Global US Pet Industry Revenue Million Forecast, by Country 2020 & 2033
- Table 16: Brazil US Pet Industry Revenue (Million) Forecast, by Application 2020 & 2033
- Table 17: Argentina US Pet Industry Revenue (Million) Forecast, by Application 2020 & 2033
- Table 18: Rest of South America US Pet Industry Revenue (Million) Forecast, by Application 2020 & 2033
- Table 19: Global US Pet Industry Revenue Million Forecast, by Pet Type 2020 & 2033
- Table 20: Global US Pet Industry Revenue Million Forecast, by Product Type 2020 & 2033
- Table 21: Global US Pet Industry Revenue Million Forecast, by Distribution Channel 2020 & 2033
- Table 22: Global US Pet Industry Revenue Million Forecast, by Country 2020 & 2033
- Table 23: United Kingdom US Pet Industry Revenue (Million) Forecast, by Application 2020 & 2033
- Table 24: Germany US Pet Industry Revenue (Million) Forecast, by Application 2020 & 2033
- Table 25: France US Pet Industry Revenue (Million) Forecast, by Application 2020 & 2033
- Table 26: Italy US Pet Industry Revenue (Million) Forecast, by Application 2020 & 2033
- Table 27: Spain US Pet Industry Revenue (Million) Forecast, by Application 2020 & 2033
- Table 28: Russia US Pet Industry Revenue (Million) Forecast, by Application 2020 & 2033
- Table 29: Benelux US Pet Industry Revenue (Million) Forecast, by Application 2020 & 2033
- Table 30: Nordics US Pet Industry Revenue (Million) Forecast, by Application 2020 & 2033
- Table 31: Rest of Europe US Pet Industry Revenue (Million) Forecast, by Application 2020 & 2033
- Table 32: Global US Pet Industry Revenue Million Forecast, by Pet Type 2020 & 2033
- Table 33: Global US Pet Industry Revenue Million Forecast, by Product Type 2020 & 2033
- Table 34: Global US Pet Industry Revenue Million Forecast, by Distribution Channel 2020 & 2033
- Table 35: Global US Pet Industry Revenue Million Forecast, by Country 2020 & 2033
- Table 36: Turkey US Pet Industry Revenue (Million) Forecast, by Application 2020 & 2033
- Table 37: Israel US Pet Industry Revenue (Million) Forecast, by Application 2020 & 2033
- Table 38: GCC US Pet Industry Revenue (Million) Forecast, by Application 2020 & 2033
- Table 39: North Africa US Pet Industry Revenue (Million) Forecast, by Application 2020 & 2033
- Table 40: South Africa US Pet Industry Revenue (Million) Forecast, by Application 2020 & 2033
- Table 41: Rest of Middle East & Africa US Pet Industry Revenue (Million) Forecast, by Application 2020 & 2033
- Table 42: Global US Pet Industry Revenue Million Forecast, by Pet Type 2020 & 2033
- Table 43: Global US Pet Industry Revenue Million Forecast, by Product Type 2020 & 2033
- Table 44: Global US Pet Industry Revenue Million Forecast, by Distribution Channel 2020 & 2033
- Table 45: Global US Pet Industry Revenue Million Forecast, by Country 2020 & 2033
- Table 46: China US Pet Industry Revenue (Million) Forecast, by Application 2020 & 2033
- Table 47: India US Pet Industry Revenue (Million) Forecast, by Application 2020 & 2033
- Table 48: Japan US Pet Industry Revenue (Million) Forecast, by Application 2020 & 2033
- Table 49: South Korea US Pet Industry Revenue (Million) Forecast, by Application 2020 & 2033
- Table 50: ASEAN US Pet Industry Revenue (Million) Forecast, by Application 2020 & 2033
- Table 51: Oceania US Pet Industry Revenue (Million) Forecast, by Application 2020 & 2033
- Table 52: Rest of Asia Pacific US Pet Industry Revenue (Million) Forecast, by Application 2020 & 2033
Frequently Asked Questions
1. What is the projected Compound Annual Growth Rate (CAGR) of the US Pet Industry?
The projected CAGR is approximately 5.06%.
2. Which companies are prominent players in the US Pet Industry?
Key companies in the market include WellPet, Nestle SA (Purina), The J M Smucker Company, Darling Ingredients Inc *List Not Exhaustive, Colgate Pamolive (Hill's Pet Nutrition), Pure and Natural Pet, United Pet Group Inc, Diamond Pet Foods, Blue Buffalo Co Ltd, Mars Inc.
3. What are the main segments of the US Pet Industry?
The market segments include Pet Type, Product Type, Distribution Channel.
4. Can you provide details about the market size?
The market size is estimated to be USD 80.69 Million as of 2022.
5. What are some drivers contributing to market growth?
Increased Pet Humanization; Growing Trend of E-commerce.
6. What are the notable trends driving market growth?
Increase in the Number of Pet Owners and Increased Expenditures on Pets.
7. Are there any restraints impacting market growth?
Rising Cost of Raw Material Production; Growing Concern Over Environment and Pet Health.
8. Can you provide examples of recent developments in the market?
N/A
9. What pricing options are available for accessing the report?
Pricing options include single-user, multi-user, and enterprise licenses priced at USD 3800, USD 4500, and USD 5800 respectively.
10. Is the market size provided in terms of value or volume?
The market size is provided in terms of value, measured in Million.
11. Are there any specific market keywords associated with the report?
Yes, the market keyword associated with the report is "US Pet Industry," which aids in identifying and referencing the specific market segment covered.
12. How do I determine which pricing option suits my needs best?
The pricing options vary based on user requirements and access needs. Individual users may opt for single-user licenses, while businesses requiring broader access may choose multi-user or enterprise licenses for cost-effective access to the report.
13. Are there any additional resources or data provided in the US Pet Industry report?
While the report offers comprehensive insights, it's advisable to review the specific contents or supplementary materials provided to ascertain if additional resources or data are available.
14. How can I stay updated on further developments or reports in the US Pet Industry?
To stay informed about further developments, trends, and reports in the US Pet Industry, consider subscribing to industry newsletters, following relevant companies and organizations, or regularly checking reputable industry news sources and publications.
Methodology
Step 1 - Identification of Relevant Samples Size from Population Database


Step 2 - Approaches for Defining Global Market Size (Value, Volume* & Price*)

Note*: In applicable scenarios
Step 3 - Data Sources
Primary Research
- Web Analytics
- Survey Reports
- Research Institute
- Latest Research Reports
- Opinion Leaders
Secondary Research
- Annual Reports
- White Paper
- Latest Press Release
- Industry Association
- Paid Database
- Investor Presentations

Step 4 - Data Triangulation
Involves using different sources of information in order to increase the validity of a study
These sources are likely to be stakeholders in a program - participants, other researchers, program staff, other community members, and so on.
Then we put all data in single framework & apply various statistical tools to find out the dynamic on the market.
During the analysis stage, feedback from the stakeholder groups would be compared to determine areas of agreement as well as areas of divergence