

Key Insights
The USA onshore drilling fluid market is poised for significant expansion, propelled by escalating oil and gas exploration and production (E&P) activities, especially within shale formations. The projected Compound Annual Growth Rate (CAGR) of 7.5% from 2024 to 2033 underscores robust market momentum. This growth is intrinsically linked to advancements in drilling methodologies like horizontal drilling and hydraulic fracturing, which mandate specialized drilling fluids for enhanced performance and operational efficiency. Moreover, increasingly stringent environmental regulations are accelerating the adoption of eco-friendly drilling fluids, opening new avenues for sustainable solutions. The market is segmented by fluid type (water-based, oil-based, synthetic-based), application (conventional, directional, horizontal drilling), and regional distribution across key shale basins. Leading entities are investing in research and development to elevate fluid capabilities and minimize ecological impact. Intense competition is marked by strategic pricing and the consistent introduction of novel products. However, volatile crude oil prices and evolving regulatory landscapes present considerable challenges. Despite these factors, the long-term outlook remains optimistic, supported by persistent energy demand and ongoing upstream sector investments.
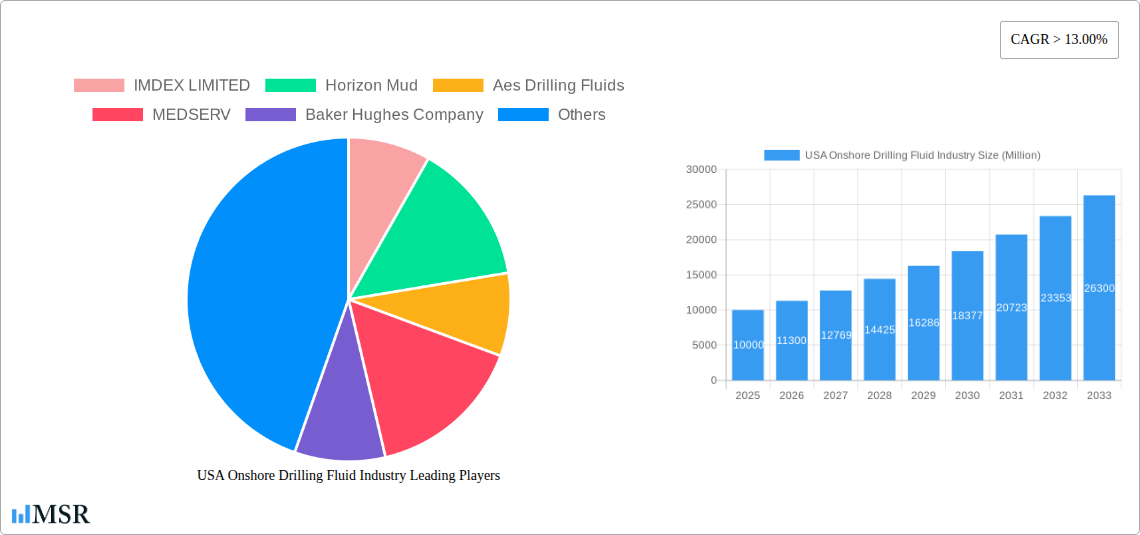
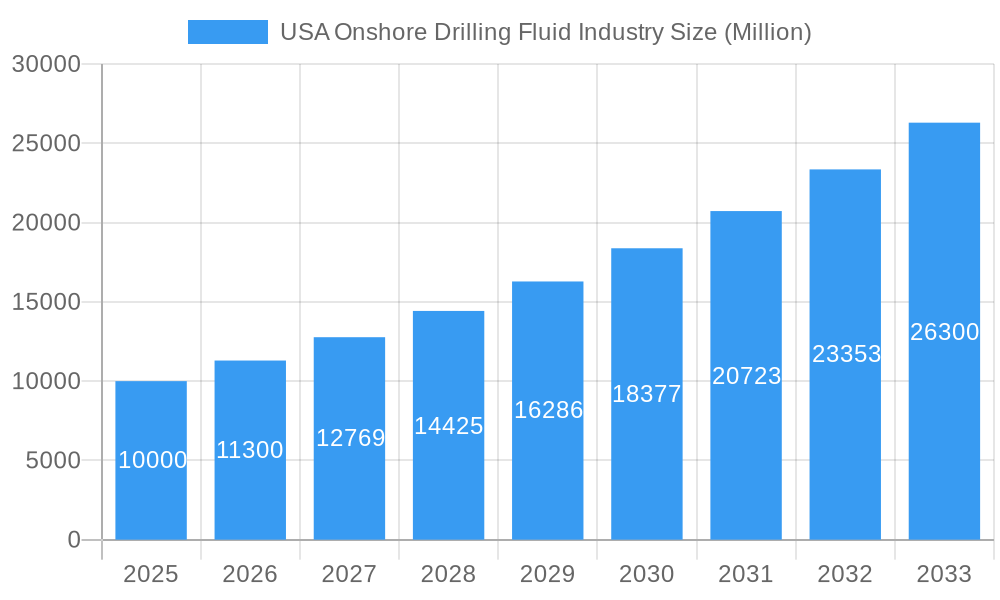
USA Onshore Drilling Fluid Industry Market Size (In Billion)
The estimated market size for 2025 is $2.7 billion. This projection is derived from current drilling trends, anticipated increases in oil and gas output, and the historical growth trajectory. Future market dynamics will be significantly shaped by energy policy, environmental regulations, and global energy demand. Continuous innovation in drilling fluid technology and a strong emphasis on sustainable practices will be paramount for market participants to maintain competitiveness and secure a larger market share.
USA Onshore Drilling Fluid Industry Company Market Share
Unlock Growth in the USA Onshore Drilling Fluid Industry: A Comprehensive Market Report (2019-2033)
This comprehensive report provides an in-depth analysis of the USA onshore drilling fluid industry, offering invaluable insights for stakeholders seeking to navigate this dynamic market. With a study period spanning 2019-2033, a base year of 2025, and a forecast period of 2025-2033, this report delivers actionable intelligence on market size, growth drivers, key players, and emerging trends. The report covers a market valued at xx Million in 2025, projecting a Compound Annual Growth Rate (CAGR) of xx% from 2025 to 2033, reaching a projected xx Million by 2033.
USA Onshore Drilling Fluid Industry Market Concentration & Dynamics
The USA onshore drilling fluid market exhibits a moderately concentrated structure, with a few major players holding significant market share. The top five companies, including Baker Hughes Company, Schlumberger Limited, Newpark Resources Inc, Weatherford, and National Oilwell Varco, collectively account for an estimated xx% of the market in 2025. However, smaller, specialized companies like Horizon Mud and Unique Drilling Fluids Inc are also making significant contributions, particularly in niche segments.
- Market Concentration: Highly concentrated, with the top 5 companies holding xx% market share in 2025.
- Innovation Ecosystems: Active, with ongoing R&D in environmentally friendly fluids and enhanced performance additives.
- Regulatory Frameworks: Stringent environmental regulations drive innovation towards sustainable solutions.
- Substitute Products: Limited viable substitutes, maintaining market stability.
- End-User Trends: Focus on cost optimization and environmental sustainability.
- M&A Activities: Moderate M&A activity, with xx major deals recorded between 2019 and 2024.
USA Onshore Drilling Fluid Industry Industry Insights & Trends
The USA onshore drilling fluid market is experiencing robust growth fueled by several key factors. The resurgence of onshore drilling activities, driven by rising energy demands and favorable government policies, is a primary driver. Technological advancements, such as the development of high-performance drilling fluids that enhance efficiency and reduce environmental impact, are further contributing to market expansion. The market size reached xx Million in 2024, and is anticipated to experience significant growth, driven by the increasing demand for environmentally friendly drilling fluids. Consumer behavior is shifting towards environmentally conscious solutions, prompting companies to invest heavily in R&D of sustainable products.
Key Markets & Segments Leading USA Onshore Drilling Fluid Industry
The Permian Basin and Eagle Ford Shale regions are currently the dominant segments within the USA onshore drilling fluid market, accounting for approximately xx% of total market share in 2025. This dominance is attributed to their significant shale gas and oil reserves and high drilling activity.
- Drivers of Dominance:
- High concentration of oil and gas reserves.
- Extensive existing infrastructure.
- Favorable regulatory environment.
- Strong economic activity.
- Detailed Dominance Analysis: The Permian and Eagle Ford basins' robust exploration and production activities, coupled with supportive government policies, have fostered a highly competitive yet lucrative market for drilling fluid suppliers, creating a positive feedback loop of investment and growth.
USA Onshore Drilling Fluid Industry Product Developments
Recent product developments focus heavily on environmentally friendly water-based muds (WBM) and synthetic-based muds (SBM), minimizing environmental impact and maximizing drilling efficiency. Innovations include advanced rheology modifiers, filtration control agents, and enhanced shale inhibition technologies. These advancements offer improved wellbore stability, reduced non-productive time, and a smaller environmental footprint, giving producers a considerable competitive advantage.
Challenges in the USA Onshore Drilling Fluid Industry Market
The industry faces challenges from fluctuating oil and gas prices, impacting demand for drilling fluids. Supply chain disruptions and the increasing cost of raw materials, such as polymers and chemicals, add to the pressure on profitability. Stringent environmental regulations also increase compliance costs. These factors collectively impacted the market by an estimated xx Million in 2024.
Forces Driving USA Onshore Drilling Fluid Industry Growth
Several factors fuel market growth: Increased onshore drilling activity driven by energy demand; technological advancements in drilling fluid formulations leading to enhanced efficiency and reduced environmental impact; and government support for domestic energy production.
Challenges in the USA Onshore Drilling Fluid Industry Market
Long-term growth depends on sustained investment in R&D, strategic partnerships to access new technologies and markets, and expansion into emerging shale plays.
Emerging Opportunities in USA Onshore Drilling Fluid Industry
Emerging opportunities lie in developing specialized drilling fluids for unconventional reservoirs and incorporating advanced technologies like nanotechnology for enhanced fluid performance. Furthermore, expanding into new geographic areas and focusing on sustainable and environmentally responsible solutions will be crucial for long-term growth.
Leading Players in the USA Onshore Drilling Fluid Industry Sector
- IMDEX LIMITED
- Horizon Mud
- Aes Drilling Fluids
- MEDSERV
- Baker Hughes Company
- Schlumberger Limited
- Newpark Resources Inc
- Weatherford
- National Oilwell Varco
- Francis Drilling Fluids Ltd
- Oleon Americas Inc (Avril Group)
- Q'max Solutions Inc
- Unique Drilling Fluids Inc
- Sunwest Fluids LLC
- McAda Drilling Fluids
- Geo Drilling Fluids Inc
- CES Energy Solutions Corp
Key Milestones in USA Onshore Drilling Fluid Industry Industry
- 2020: Increased adoption of environmentally friendly drilling fluids.
- 2021: Several major M&A activities reshaped the market landscape.
- 2022: Introduction of advanced drilling fluid formulations with enhanced performance.
- 2023: Focus on reducing carbon footprint through sustainable practices.
- 2024: Significant investment in research and development of innovative drilling fluids.
Strategic Outlook for USA Onshore Drilling Fluid Industry Market
The USA onshore drilling fluid market shows strong potential for continued growth, driven by technological innovation, expanding shale gas and oil production, and a focus on sustainability. Strategic partnerships and investments in R&D will be critical for companies seeking to capitalize on the market's future potential.
USA Onshore Drilling Fluid Industry Segmentation
-
1. Additive Type
- 1.1. Protective Chemicals
- 1.2. Fluid Viscosifiers
- 1.3. Weighting Agents
- 1.4. Wetting Agents
- 1.5. Lost Circulation Materials
- 1.6. Thinners
- 1.7. Rheology Modifiers
- 1.8. Surfactants
- 1.9. Alkalinity and pH Control Materials
- 1.10. Shale Stabilizers
- 1.11. Other Additive Types
-
2. Product Type
- 2.1. Oil-based Drilling Fluid
- 2.2. Synthetic-based Drilling Fluid
- 2.3. Water-based Drilling Fluid
-
3. Basin
- 3.1. Permian
- 3.2. Eagle Ford
- 3.3. Niobrara
- 3.4. Bakken
- 3.5. Appalachia
- 3.6. Other Basins
USA Onshore Drilling Fluid Industry Segmentation By Geography
-
1. North America
- 1.1. United States
- 1.2. Canada
- 1.3. Mexico
-
2. South America
- 2.1. Brazil
- 2.2. Argentina
- 2.3. Rest of South America
-
3. Europe
- 3.1. United Kingdom
- 3.2. Germany
- 3.3. France
- 3.4. Italy
- 3.5. Spain
- 3.6. Russia
- 3.7. Benelux
- 3.8. Nordics
- 3.9. Rest of Europe
-
4. Middle East & Africa
- 4.1. Turkey
- 4.2. Israel
- 4.3. GCC
- 4.4. North Africa
- 4.5. South Africa
- 4.6. Rest of Middle East & Africa
-
5. Asia Pacific
- 5.1. China
- 5.2. India
- 5.3. Japan
- 5.4. South Korea
- 5.5. ASEAN
- 5.6. Oceania
- 5.7. Rest of Asia Pacific
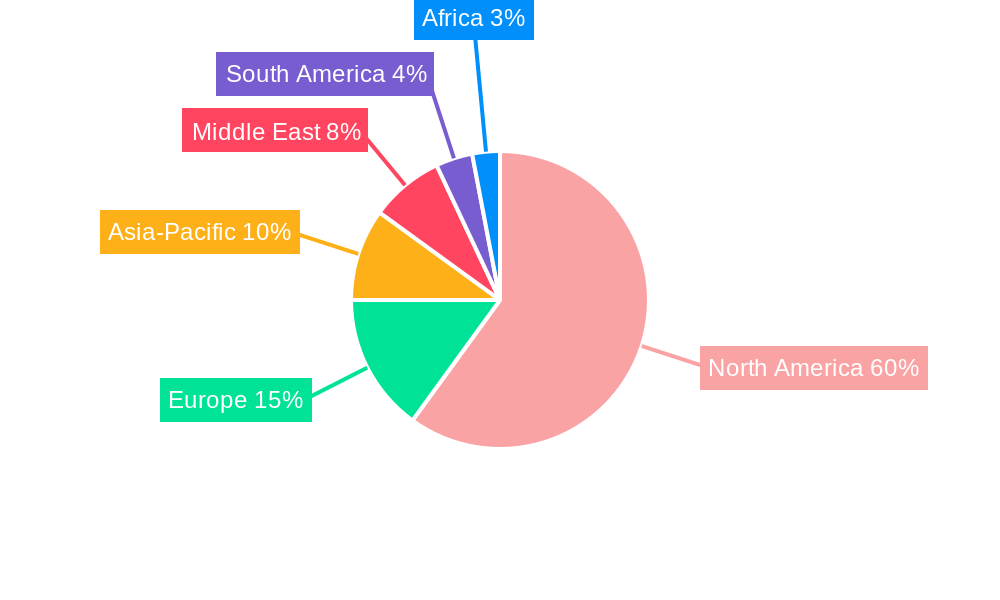
USA Onshore Drilling Fluid Industry Regional Market Share
Geographic Coverage of USA Onshore Drilling Fluid Industry
USA Onshore Drilling Fluid Industry REPORT HIGHLIGHTS
| Aspects | Details |
|---|---|
| Study Period | 2020-2034 |
| Base Year | 2025 |
| Estimated Year | 2026 |
| Forecast Period | 2026-2034 |
| Historical Period | 2020-2025 |
| Growth Rate | CAGR of 7.5% from 2020-2034 |
| Segmentation |
|
Table of Contents
- 1. Introduction
- 1.1. Research Scope
- 1.2. Market Segmentation
- 1.3. Research Objective
- 1.4. Definitions and Assumptions
- 2. Executive Summary
- 2.1. Market Snapshot
- 3. Market Dynamics
- 3.1. Market Drivers
- 3.2. Market Restrains
- 3.3. Market Trends
- 3.4. Market Opportunities
- 4. Market Factor Analysis
- 4.1. Porters Five Forces
- 4.1.1. Bargaining Power of Suppliers
- 4.1.2. Bargaining Power of Buyers
- 4.1.3. Threat of New Entrants
- 4.1.4. Threat of Substitutes
- 4.1.5. Competitive Rivalry
- 4.2. PESTEL analysis
- 4.3. BCG Analysis
- 4.3.1. Stars (High Growth, High Market Share)
- 4.3.2. Cash Cows (Low Growth, High Market Share)
- 4.3.3. Question Mark (High Growth, Low Market Share)
- 4.3.4. Dogs (Low Growth, Low Market Share)
- 4.4. Ansoff Matrix Analysis
- 4.5. Supply Chain Analysis
- 4.6. Regulatory Landscape
- 4.7. Current Market Potential and Opportunity Assessment (TAM–SAM–SOM Framework)
- 4.8. MSR Analyst Note
- 4.1. Porters Five Forces
- 5. Market Analysis, Insights and Forecast 2021-2033
- 5.1. Market Analysis, Insights and Forecast - by Additive Type
- 5.1.1. Protective Chemicals
- 5.1.2. Fluid Viscosifiers
- 5.1.3. Weighting Agents
- 5.1.4. Wetting Agents
- 5.1.5. Lost Circulation Materials
- 5.1.6. Thinners
- 5.1.7. Rheology Modifiers
- 5.1.8. Surfactants
- 5.1.9. Alkalinity and pH Control Materials
- 5.1.10. Shale Stabilizers
- 5.1.11. Other Additive Types
- 5.2. Market Analysis, Insights and Forecast - by Product Type
- 5.2.1. Oil-based Drilling Fluid
- 5.2.2. Synthetic-based Drilling Fluid
- 5.2.3. Water-based Drilling Fluid
- 5.3. Market Analysis, Insights and Forecast - by Basin
- 5.3.1. Permian
- 5.3.2. Eagle Ford
- 5.3.3. Niobrara
- 5.3.4. Bakken
- 5.3.5. Appalachia
- 5.3.6. Other Basins
- 5.4. Market Analysis, Insights and Forecast - by Region
- 5.4.1. North America
- 5.4.2. South America
- 5.4.3. Europe
- 5.4.4. Middle East & Africa
- 5.4.5. Asia Pacific
- 5.1. Market Analysis, Insights and Forecast - by Additive Type
- 6. Global USA Onshore Drilling Fluid Industry Analysis, Insights and Forecast, 2021-2033
- 6.1. Market Analysis, Insights and Forecast - by Additive Type
- 6.1.1. Protective Chemicals
- 6.1.2. Fluid Viscosifiers
- 6.1.3. Weighting Agents
- 6.1.4. Wetting Agents
- 6.1.5. Lost Circulation Materials
- 6.1.6. Thinners
- 6.1.7. Rheology Modifiers
- 6.1.8. Surfactants
- 6.1.9. Alkalinity and pH Control Materials
- 6.1.10. Shale Stabilizers
- 6.1.11. Other Additive Types
- 6.2. Market Analysis, Insights and Forecast - by Product Type
- 6.2.1. Oil-based Drilling Fluid
- 6.2.2. Synthetic-based Drilling Fluid
- 6.2.3. Water-based Drilling Fluid
- 6.3. Market Analysis, Insights and Forecast - by Basin
- 6.3.1. Permian
- 6.3.2. Eagle Ford
- 6.3.3. Niobrara
- 6.3.4. Bakken
- 6.3.5. Appalachia
- 6.3.6. Other Basins
- 6.1. Market Analysis, Insights and Forecast - by Additive Type
- 7. North America USA Onshore Drilling Fluid Industry Analysis, Insights and Forecast, 2020-2032
- 7.1. Market Analysis, Insights and Forecast - by Additive Type
- 7.1.1. Protective Chemicals
- 7.1.2. Fluid Viscosifiers
- 7.1.3. Weighting Agents
- 7.1.4. Wetting Agents
- 7.1.5. Lost Circulation Materials
- 7.1.6. Thinners
- 7.1.7. Rheology Modifiers
- 7.1.8. Surfactants
- 7.1.9. Alkalinity and pH Control Materials
- 7.1.10. Shale Stabilizers
- 7.1.11. Other Additive Types
- 7.2. Market Analysis, Insights and Forecast - by Product Type
- 7.2.1. Oil-based Drilling Fluid
- 7.2.2. Synthetic-based Drilling Fluid
- 7.2.3. Water-based Drilling Fluid
- 7.3. Market Analysis, Insights and Forecast - by Basin
- 7.3.1. Permian
- 7.3.2. Eagle Ford
- 7.3.3. Niobrara
- 7.3.4. Bakken
- 7.3.5. Appalachia
- 7.3.6. Other Basins
- 7.1. Market Analysis, Insights and Forecast - by Additive Type
- 8. South America USA Onshore Drilling Fluid Industry Analysis, Insights and Forecast, 2020-2032
- 8.1. Market Analysis, Insights and Forecast - by Additive Type
- 8.1.1. Protective Chemicals
- 8.1.2. Fluid Viscosifiers
- 8.1.3. Weighting Agents
- 8.1.4. Wetting Agents
- 8.1.5. Lost Circulation Materials
- 8.1.6. Thinners
- 8.1.7. Rheology Modifiers
- 8.1.8. Surfactants
- 8.1.9. Alkalinity and pH Control Materials
- 8.1.10. Shale Stabilizers
- 8.1.11. Other Additive Types
- 8.2. Market Analysis, Insights and Forecast - by Product Type
- 8.2.1. Oil-based Drilling Fluid
- 8.2.2. Synthetic-based Drilling Fluid
- 8.2.3. Water-based Drilling Fluid
- 8.3. Market Analysis, Insights and Forecast - by Basin
- 8.3.1. Permian
- 8.3.2. Eagle Ford
- 8.3.3. Niobrara
- 8.3.4. Bakken
- 8.3.5. Appalachia
- 8.3.6. Other Basins
- 8.1. Market Analysis, Insights and Forecast - by Additive Type
- 9. Europe USA Onshore Drilling Fluid Industry Analysis, Insights and Forecast, 2020-2032
- 9.1. Market Analysis, Insights and Forecast - by Additive Type
- 9.1.1. Protective Chemicals
- 9.1.2. Fluid Viscosifiers
- 9.1.3. Weighting Agents
- 9.1.4. Wetting Agents
- 9.1.5. Lost Circulation Materials
- 9.1.6. Thinners
- 9.1.7. Rheology Modifiers
- 9.1.8. Surfactants
- 9.1.9. Alkalinity and pH Control Materials
- 9.1.10. Shale Stabilizers
- 9.1.11. Other Additive Types
- 9.2. Market Analysis, Insights and Forecast - by Product Type
- 9.2.1. Oil-based Drilling Fluid
- 9.2.2. Synthetic-based Drilling Fluid
- 9.2.3. Water-based Drilling Fluid
- 9.3. Market Analysis, Insights and Forecast - by Basin
- 9.3.1. Permian
- 9.3.2. Eagle Ford
- 9.3.3. Niobrara
- 9.3.4. Bakken
- 9.3.5. Appalachia
- 9.3.6. Other Basins
- 9.1. Market Analysis, Insights and Forecast - by Additive Type
- 10. Middle East & Africa USA Onshore Drilling Fluid Industry Analysis, Insights and Forecast, 2020-2032
- 10.1. Market Analysis, Insights and Forecast - by Additive Type
- 10.1.1. Protective Chemicals
- 10.1.2. Fluid Viscosifiers
- 10.1.3. Weighting Agents
- 10.1.4. Wetting Agents
- 10.1.5. Lost Circulation Materials
- 10.1.6. Thinners
- 10.1.7. Rheology Modifiers
- 10.1.8. Surfactants
- 10.1.9. Alkalinity and pH Control Materials
- 10.1.10. Shale Stabilizers
- 10.1.11. Other Additive Types
- 10.2. Market Analysis, Insights and Forecast - by Product Type
- 10.2.1. Oil-based Drilling Fluid
- 10.2.2. Synthetic-based Drilling Fluid
- 10.2.3. Water-based Drilling Fluid
- 10.3. Market Analysis, Insights and Forecast - by Basin
- 10.3.1. Permian
- 10.3.2. Eagle Ford
- 10.3.3. Niobrara
- 10.3.4. Bakken
- 10.3.5. Appalachia
- 10.3.6. Other Basins
- 10.1. Market Analysis, Insights and Forecast - by Additive Type
- 11. Asia Pacific USA Onshore Drilling Fluid Industry Analysis, Insights and Forecast, 2020-2032
- 11.1. Market Analysis, Insights and Forecast - by Additive Type
- 11.1.1. Protective Chemicals
- 11.1.2. Fluid Viscosifiers
- 11.1.3. Weighting Agents
- 11.1.4. Wetting Agents
- 11.1.5. Lost Circulation Materials
- 11.1.6. Thinners
- 11.1.7. Rheology Modifiers
- 11.1.8. Surfactants
- 11.1.9. Alkalinity and pH Control Materials
- 11.1.10. Shale Stabilizers
- 11.1.11. Other Additive Types
- 11.2. Market Analysis, Insights and Forecast - by Product Type
- 11.2.1. Oil-based Drilling Fluid
- 11.2.2. Synthetic-based Drilling Fluid
- 11.2.3. Water-based Drilling Fluid
- 11.3. Market Analysis, Insights and Forecast - by Basin
- 11.3.1. Permian
- 11.3.2. Eagle Ford
- 11.3.3. Niobrara
- 11.3.4. Bakken
- 11.3.5. Appalachia
- 11.3.6. Other Basins
- 11.1. Market Analysis, Insights and Forecast - by Additive Type
- 12. Competitive Analysis
- 12.1. Company Profiles
- 12.1.1 IMDEX LIMITED
- 12.1.1.1. Company Overview
- 12.1.1.2. Products
- 12.1.1.3. Company Financials
- 12.1.1.4. SWOT Analysis
- 12.1.2 Horizon Mud
- 12.1.2.1. Company Overview
- 12.1.2.2. Products
- 12.1.2.3. Company Financials
- 12.1.2.4. SWOT Analysis
- 12.1.3 Aes Drilling Fluids
- 12.1.3.1. Company Overview
- 12.1.3.2. Products
- 12.1.3.3. Company Financials
- 12.1.3.4. SWOT Analysis
- 12.1.4 MEDSERV
- 12.1.4.1. Company Overview
- 12.1.4.2. Products
- 12.1.4.3. Company Financials
- 12.1.4.4. SWOT Analysis
- 12.1.5 Baker Hughes Company
- 12.1.5.1. Company Overview
- 12.1.5.2. Products
- 12.1.5.3. Company Financials
- 12.1.5.4. SWOT Analysis
- 12.1.6 Schlumberger Limited
- 12.1.6.1. Company Overview
- 12.1.6.2. Products
- 12.1.6.3. Company Financials
- 12.1.6.4. SWOT Analysis
- 12.1.7 Newpark Resources Inc
- 12.1.7.1. Company Overview
- 12.1.7.2. Products
- 12.1.7.3. Company Financials
- 12.1.7.4. SWOT Analysis
- 12.1.8 Weatherford
- 12.1.8.1. Company Overview
- 12.1.8.2. Products
- 12.1.8.3. Company Financials
- 12.1.8.4. SWOT Analysis
- 12.1.9 National Oilwell Varco
- 12.1.9.1. Company Overview
- 12.1.9.2. Products
- 12.1.9.3. Company Financials
- 12.1.9.4. SWOT Analysis
- 12.1.10 Francis Drilling Fluids Ltd
- 12.1.10.1. Company Overview
- 12.1.10.2. Products
- 12.1.10.3. Company Financials
- 12.1.10.4. SWOT Analysis
- 12.1.11 Oleon Americas Inc (Avril Group)
- 12.1.11.1. Company Overview
- 12.1.11.2. Products
- 12.1.11.3. Company Financials
- 12.1.11.4. SWOT Analysis
- 12.1.12 Q'max Solutions Inc
- 12.1.12.1. Company Overview
- 12.1.12.2. Products
- 12.1.12.3. Company Financials
- 12.1.12.4. SWOT Analysis
- 12.1.13 Unique Drilling Fluids Inc
- 12.1.13.1. Company Overview
- 12.1.13.2. Products
- 12.1.13.3. Company Financials
- 12.1.13.4. SWOT Analysis
- 12.1.14 Sunwest Fluids LLC
- 12.1.14.1. Company Overview
- 12.1.14.2. Products
- 12.1.14.3. Company Financials
- 12.1.14.4. SWOT Analysis
- 12.1.15 McAda Drilling Fluids
- 12.1.15.1. Company Overview
- 12.1.15.2. Products
- 12.1.15.3. Company Financials
- 12.1.15.4. SWOT Analysis
- 12.1.16 Geo Drilling Fluids Inc
- 12.1.16.1. Company Overview
- 12.1.16.2. Products
- 12.1.16.3. Company Financials
- 12.1.16.4. SWOT Analysis
- 12.1.17 CES Energy Solutions Corp *List Not Exhaustive
- 12.1.17.1. Company Overview
- 12.1.17.2. Products
- 12.1.17.3. Company Financials
- 12.1.17.4. SWOT Analysis
- 12.1.1 IMDEX LIMITED
- 12.2. Market Entropy
- 12.2.1 Company's Key Areas Served
- 12.2.2 Recent Developments
- 12.3. Company Market Share Analysis 2025
- 12.3.1 Top 5 Companies Market Share Analysis
- 12.3.2 Top 3 Companies Market Share Analysis
- 12.4. List of Potential Customers
- 13. Research Methodology
List of Figures
- Figure 1: Global USA Onshore Drilling Fluid Industry Revenue Breakdown (billion, %) by Region 2025 & 2033
- Figure 2: North America USA Onshore Drilling Fluid Industry Revenue (billion), by Additive Type 2025 & 2033
- Figure 3: North America USA Onshore Drilling Fluid Industry Revenue Share (%), by Additive Type 2025 & 2033
- Figure 4: North America USA Onshore Drilling Fluid Industry Revenue (billion), by Product Type 2025 & 2033
- Figure 5: North America USA Onshore Drilling Fluid Industry Revenue Share (%), by Product Type 2025 & 2033
- Figure 6: North America USA Onshore Drilling Fluid Industry Revenue (billion), by Basin 2025 & 2033
- Figure 7: North America USA Onshore Drilling Fluid Industry Revenue Share (%), by Basin 2025 & 2033
- Figure 8: North America USA Onshore Drilling Fluid Industry Revenue (billion), by Country 2025 & 2033
- Figure 9: North America USA Onshore Drilling Fluid Industry Revenue Share (%), by Country 2025 & 2033
- Figure 10: South America USA Onshore Drilling Fluid Industry Revenue (billion), by Additive Type 2025 & 2033
- Figure 11: South America USA Onshore Drilling Fluid Industry Revenue Share (%), by Additive Type 2025 & 2033
- Figure 12: South America USA Onshore Drilling Fluid Industry Revenue (billion), by Product Type 2025 & 2033
- Figure 13: South America USA Onshore Drilling Fluid Industry Revenue Share (%), by Product Type 2025 & 2033
- Figure 14: South America USA Onshore Drilling Fluid Industry Revenue (billion), by Basin 2025 & 2033
- Figure 15: South America USA Onshore Drilling Fluid Industry Revenue Share (%), by Basin 2025 & 2033
- Figure 16: South America USA Onshore Drilling Fluid Industry Revenue (billion), by Country 2025 & 2033
- Figure 17: South America USA Onshore Drilling Fluid Industry Revenue Share (%), by Country 2025 & 2033
- Figure 18: Europe USA Onshore Drilling Fluid Industry Revenue (billion), by Additive Type 2025 & 2033
- Figure 19: Europe USA Onshore Drilling Fluid Industry Revenue Share (%), by Additive Type 2025 & 2033
- Figure 20: Europe USA Onshore Drilling Fluid Industry Revenue (billion), by Product Type 2025 & 2033
- Figure 21: Europe USA Onshore Drilling Fluid Industry Revenue Share (%), by Product Type 2025 & 2033
- Figure 22: Europe USA Onshore Drilling Fluid Industry Revenue (billion), by Basin 2025 & 2033
- Figure 23: Europe USA Onshore Drilling Fluid Industry Revenue Share (%), by Basin 2025 & 2033
- Figure 24: Europe USA Onshore Drilling Fluid Industry Revenue (billion), by Country 2025 & 2033
- Figure 25: Europe USA Onshore Drilling Fluid Industry Revenue Share (%), by Country 2025 & 2033
- Figure 26: Middle East & Africa USA Onshore Drilling Fluid Industry Revenue (billion), by Additive Type 2025 & 2033
- Figure 27: Middle East & Africa USA Onshore Drilling Fluid Industry Revenue Share (%), by Additive Type 2025 & 2033
- Figure 28: Middle East & Africa USA Onshore Drilling Fluid Industry Revenue (billion), by Product Type 2025 & 2033
- Figure 29: Middle East & Africa USA Onshore Drilling Fluid Industry Revenue Share (%), by Product Type 2025 & 2033
- Figure 30: Middle East & Africa USA Onshore Drilling Fluid Industry Revenue (billion), by Basin 2025 & 2033
- Figure 31: Middle East & Africa USA Onshore Drilling Fluid Industry Revenue Share (%), by Basin 2025 & 2033
- Figure 32: Middle East & Africa USA Onshore Drilling Fluid Industry Revenue (billion), by Country 2025 & 2033
- Figure 33: Middle East & Africa USA Onshore Drilling Fluid Industry Revenue Share (%), by Country 2025 & 2033
- Figure 34: Asia Pacific USA Onshore Drilling Fluid Industry Revenue (billion), by Additive Type 2025 & 2033
- Figure 35: Asia Pacific USA Onshore Drilling Fluid Industry Revenue Share (%), by Additive Type 2025 & 2033
- Figure 36: Asia Pacific USA Onshore Drilling Fluid Industry Revenue (billion), by Product Type 2025 & 2033
- Figure 37: Asia Pacific USA Onshore Drilling Fluid Industry Revenue Share (%), by Product Type 2025 & 2033
- Figure 38: Asia Pacific USA Onshore Drilling Fluid Industry Revenue (billion), by Basin 2025 & 2033
- Figure 39: Asia Pacific USA Onshore Drilling Fluid Industry Revenue Share (%), by Basin 2025 & 2033
- Figure 40: Asia Pacific USA Onshore Drilling Fluid Industry Revenue (billion), by Country 2025 & 2033
- Figure 41: Asia Pacific USA Onshore Drilling Fluid Industry Revenue Share (%), by Country 2025 & 2033
List of Tables
- Table 1: Global USA Onshore Drilling Fluid Industry Revenue billion Forecast, by Additive Type 2020 & 2033
- Table 2: Global USA Onshore Drilling Fluid Industry Revenue billion Forecast, by Product Type 2020 & 2033
- Table 3: Global USA Onshore Drilling Fluid Industry Revenue billion Forecast, by Basin 2020 & 2033
- Table 4: Global USA Onshore Drilling Fluid Industry Revenue billion Forecast, by Region 2020 & 2033
- Table 5: Global USA Onshore Drilling Fluid Industry Revenue billion Forecast, by Additive Type 2020 & 2033
- Table 6: Global USA Onshore Drilling Fluid Industry Revenue billion Forecast, by Product Type 2020 & 2033
- Table 7: Global USA Onshore Drilling Fluid Industry Revenue billion Forecast, by Basin 2020 & 2033
- Table 8: Global USA Onshore Drilling Fluid Industry Revenue billion Forecast, by Country 2020 & 2033
- Table 9: United States USA Onshore Drilling Fluid Industry Revenue (billion) Forecast, by Application 2020 & 2033
- Table 10: Canada USA Onshore Drilling Fluid Industry Revenue (billion) Forecast, by Application 2020 & 2033
- Table 11: Mexico USA Onshore Drilling Fluid Industry Revenue (billion) Forecast, by Application 2020 & 2033
- Table 12: Global USA Onshore Drilling Fluid Industry Revenue billion Forecast, by Additive Type 2020 & 2033
- Table 13: Global USA Onshore Drilling Fluid Industry Revenue billion Forecast, by Product Type 2020 & 2033
- Table 14: Global USA Onshore Drilling Fluid Industry Revenue billion Forecast, by Basin 2020 & 2033
- Table 15: Global USA Onshore Drilling Fluid Industry Revenue billion Forecast, by Country 2020 & 2033
- Table 16: Brazil USA Onshore Drilling Fluid Industry Revenue (billion) Forecast, by Application 2020 & 2033
- Table 17: Argentina USA Onshore Drilling Fluid Industry Revenue (billion) Forecast, by Application 2020 & 2033
- Table 18: Rest of South America USA Onshore Drilling Fluid Industry Revenue (billion) Forecast, by Application 2020 & 2033
- Table 19: Global USA Onshore Drilling Fluid Industry Revenue billion Forecast, by Additive Type 2020 & 2033
- Table 20: Global USA Onshore Drilling Fluid Industry Revenue billion Forecast, by Product Type 2020 & 2033
- Table 21: Global USA Onshore Drilling Fluid Industry Revenue billion Forecast, by Basin 2020 & 2033
- Table 22: Global USA Onshore Drilling Fluid Industry Revenue billion Forecast, by Country 2020 & 2033
- Table 23: United Kingdom USA Onshore Drilling Fluid Industry Revenue (billion) Forecast, by Application 2020 & 2033
- Table 24: Germany USA Onshore Drilling Fluid Industry Revenue (billion) Forecast, by Application 2020 & 2033
- Table 25: France USA Onshore Drilling Fluid Industry Revenue (billion) Forecast, by Application 2020 & 2033
- Table 26: Italy USA Onshore Drilling Fluid Industry Revenue (billion) Forecast, by Application 2020 & 2033
- Table 27: Spain USA Onshore Drilling Fluid Industry Revenue (billion) Forecast, by Application 2020 & 2033
- Table 28: Russia USA Onshore Drilling Fluid Industry Revenue (billion) Forecast, by Application 2020 & 2033
- Table 29: Benelux USA Onshore Drilling Fluid Industry Revenue (billion) Forecast, by Application 2020 & 2033
- Table 30: Nordics USA Onshore Drilling Fluid Industry Revenue (billion) Forecast, by Application 2020 & 2033
- Table 31: Rest of Europe USA Onshore Drilling Fluid Industry Revenue (billion) Forecast, by Application 2020 & 2033
- Table 32: Global USA Onshore Drilling Fluid Industry Revenue billion Forecast, by Additive Type 2020 & 2033
- Table 33: Global USA Onshore Drilling Fluid Industry Revenue billion Forecast, by Product Type 2020 & 2033
- Table 34: Global USA Onshore Drilling Fluid Industry Revenue billion Forecast, by Basin 2020 & 2033
- Table 35: Global USA Onshore Drilling Fluid Industry Revenue billion Forecast, by Country 2020 & 2033
- Table 36: Turkey USA Onshore Drilling Fluid Industry Revenue (billion) Forecast, by Application 2020 & 2033
- Table 37: Israel USA Onshore Drilling Fluid Industry Revenue (billion) Forecast, by Application 2020 & 2033
- Table 38: GCC USA Onshore Drilling Fluid Industry Revenue (billion) Forecast, by Application 2020 & 2033
- Table 39: North Africa USA Onshore Drilling Fluid Industry Revenue (billion) Forecast, by Application 2020 & 2033
- Table 40: South Africa USA Onshore Drilling Fluid Industry Revenue (billion) Forecast, by Application 2020 & 2033
- Table 41: Rest of Middle East & Africa USA Onshore Drilling Fluid Industry Revenue (billion) Forecast, by Application 2020 & 2033
- Table 42: Global USA Onshore Drilling Fluid Industry Revenue billion Forecast, by Additive Type 2020 & 2033
- Table 43: Global USA Onshore Drilling Fluid Industry Revenue billion Forecast, by Product Type 2020 & 2033
- Table 44: Global USA Onshore Drilling Fluid Industry Revenue billion Forecast, by Basin 2020 & 2033
- Table 45: Global USA Onshore Drilling Fluid Industry Revenue billion Forecast, by Country 2020 & 2033
- Table 46: China USA Onshore Drilling Fluid Industry Revenue (billion) Forecast, by Application 2020 & 2033
- Table 47: India USA Onshore Drilling Fluid Industry Revenue (billion) Forecast, by Application 2020 & 2033
- Table 48: Japan USA Onshore Drilling Fluid Industry Revenue (billion) Forecast, by Application 2020 & 2033
- Table 49: South Korea USA Onshore Drilling Fluid Industry Revenue (billion) Forecast, by Application 2020 & 2033
- Table 50: ASEAN USA Onshore Drilling Fluid Industry Revenue (billion) Forecast, by Application 2020 & 2033
- Table 51: Oceania USA Onshore Drilling Fluid Industry Revenue (billion) Forecast, by Application 2020 & 2033
- Table 52: Rest of Asia Pacific USA Onshore Drilling Fluid Industry Revenue (billion) Forecast, by Application 2020 & 2033
Frequently Asked Questions
1. What is the projected Compound Annual Growth Rate (CAGR) of the USA Onshore Drilling Fluid Industry?
The projected CAGR is approximately 7.5%.
2. Which companies are prominent players in the USA Onshore Drilling Fluid Industry?
Key companies in the market include IMDEX LIMITED, Horizon Mud, Aes Drilling Fluids, MEDSERV, Baker Hughes Company, Schlumberger Limited, Newpark Resources Inc, Weatherford, National Oilwell Varco, Francis Drilling Fluids Ltd, Oleon Americas Inc (Avril Group), Q'max Solutions Inc, Unique Drilling Fluids Inc, Sunwest Fluids LLC, McAda Drilling Fluids, Geo Drilling Fluids Inc, CES Energy Solutions Corp *List Not Exhaustive.
3. What are the main segments of the USA Onshore Drilling Fluid Industry?
The market segments include Additive Type, Product Type, Basin.
4. Can you provide details about the market size?
The market size is estimated to be USD 2.7 billion as of 2022.
5. What are some drivers contributing to market growth?
; Low Breakeven Price and High Crude Oil Price; Increasing Demand for Longer Lateral Length; Continuous Growth in Demand from Permian Basin.
6. What are the notable trends driving market growth?
Continuous Growth in Demand from Permian Basin.
7. Are there any restraints impacting market growth?
; Low Breakeven Price and High Crude Oil Price; Increasing Demand for Longer Lateral Length; Continuous Growth in Demand from Permian Basin.
8. Can you provide examples of recent developments in the market?
N/A
9. What pricing options are available for accessing the report?
Pricing options include single-user, multi-user, and enterprise licenses priced at USD 3800, USD 4500, and USD 5800 respectively.
10. Is the market size provided in terms of value or volume?
The market size is provided in terms of value, measured in billion.
11. Are there any specific market keywords associated with the report?
Yes, the market keyword associated with the report is "USA Onshore Drilling Fluid Industry," which aids in identifying and referencing the specific market segment covered.
12. How do I determine which pricing option suits my needs best?
The pricing options vary based on user requirements and access needs. Individual users may opt for single-user licenses, while businesses requiring broader access may choose multi-user or enterprise licenses for cost-effective access to the report.
13. Are there any additional resources or data provided in the USA Onshore Drilling Fluid Industry report?
While the report offers comprehensive insights, it's advisable to review the specific contents or supplementary materials provided to ascertain if additional resources or data are available.
14. How can I stay updated on further developments or reports in the USA Onshore Drilling Fluid Industry?
To stay informed about further developments, trends, and reports in the USA Onshore Drilling Fluid Industry, consider subscribing to industry newsletters, following relevant companies and organizations, or regularly checking reputable industry news sources and publications.
Methodology
Step 1 - Identification of Relevant Samples Size from Population Database


Step 2 - Approaches for Defining Global Market Size (Value, Volume* & Price*)

Note*: In applicable scenarios
Step 3 - Data Sources
Primary Research
- Web Analytics
- Survey Reports
- Research Institute
- Latest Research Reports
- Opinion Leaders
Secondary Research
- Annual Reports
- White Paper
- Latest Press Release
- Industry Association
- Paid Database
- Investor Presentations

Step 4 - Data Triangulation
Involves using different sources of information in order to increase the validity of a study
These sources are likely to be stakeholders in a program - participants, other researchers, program staff, other community members, and so on.
Then we put all data in single framework & apply various statistical tools to find out the dynamic on the market.
During the analysis stage, feedback from the stakeholder groups would be compared to determine areas of agreement as well as areas of divergence