

Key Insights
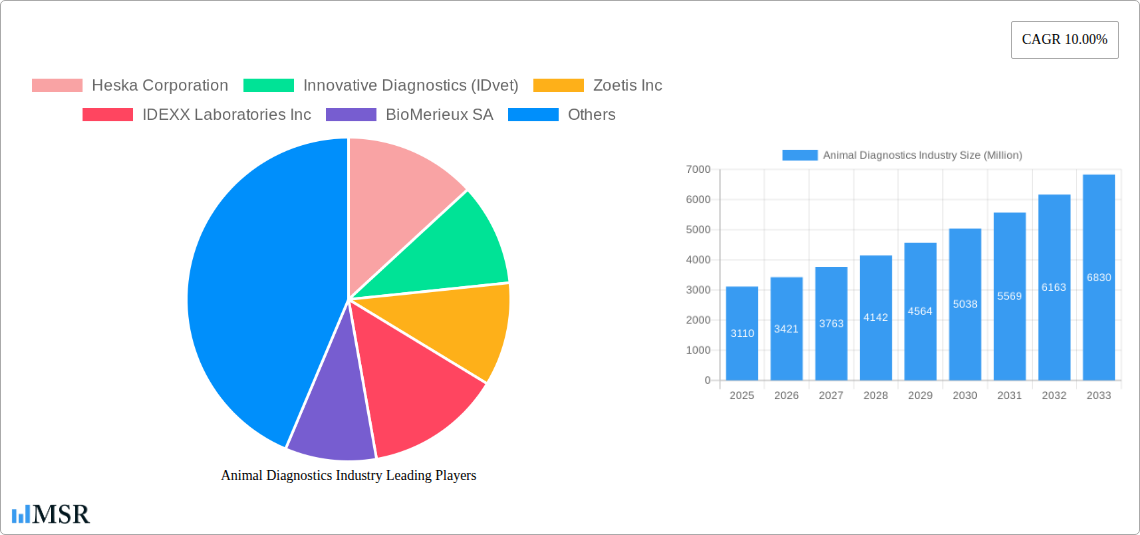
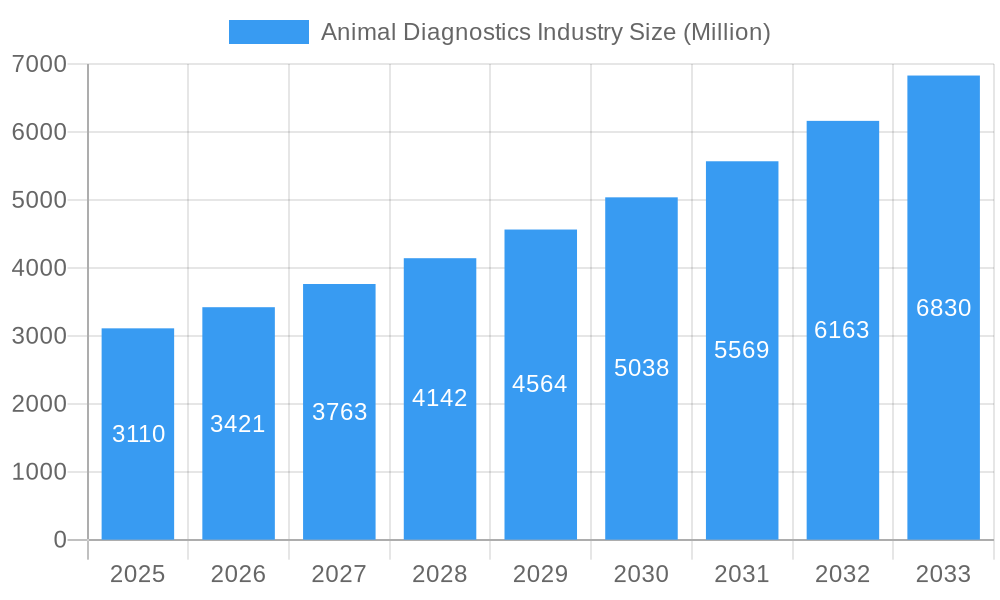
The global animal diagnostics market, valued at $3.11 billion in 2025, is experiencing robust growth, projected to expand at a compound annual growth rate (CAGR) of 10% from 2025 to 2033. This expansion is fueled by several key factors. The rising pet ownership globally, coupled with increasing awareness of animal health and wellness among pet owners, is driving demand for diagnostic services. Advancements in diagnostic technologies, particularly in immunodiagnostics and molecular diagnostics, are enabling faster, more accurate, and more cost-effective disease detection. The increasing prevalence of zoonotic diseases—diseases transmittable between animals and humans—further necessitates advanced diagnostic capabilities to protect both animal and public health. Veterinary clinics and hospitals are increasingly incorporating sophisticated diagnostic tools into their practices, reflecting a shift towards proactive and preventative animal healthcare. The market segmentation reveals strong growth across various animal types (cats and dogs leading the way) and applications (bacteriology, parasitology, and clinical pathology being prominent). Geographic distribution indicates significant market presence in North America and Europe, with Asia-Pacific poised for substantial future growth due to rising pet ownership and economic development.
Animal Diagnostics Industry Market Size (In Billion)
The competitive landscape is characterized by a mix of established multinational corporations like IDEXX Laboratories Inc., Zoetis Inc., and Thermo Fisher Scientific Inc., alongside smaller specialized companies focusing on niche areas. These companies are continuously investing in research and development to innovate diagnostic technologies and expand their product portfolios. However, factors like the high cost of advanced diagnostic equipment and tests, along with regulatory hurdles in certain regions, could potentially restrain market growth. Despite these challenges, the long-term outlook for the animal diagnostics market remains positive, fueled by continued technological advancements, growing pet humanization, and the imperative for effective animal disease management. Future growth will likely be shaped by the introduction of point-of-care diagnostics, increasing integration of digital technologies, and the development of personalized medicine approaches in veterinary care.
Animal Diagnostics Industry Company Market Share
Animal Diagnostics Industry Market Report: 2019-2033
This comprehensive report provides an in-depth analysis of the Animal Diagnostics Industry, covering market size, growth drivers, key players, and future trends from 2019 to 2033. With a focus on actionable insights and key performance indicators, this report is an essential resource for industry stakeholders, investors, and strategic decision-makers. The report utilizes a robust methodology incorporating historical data (2019-2024), a base year of 2025, and forecasts until 2033. The global market value is projected to reach xx Million by 2033.
Animal Diagnostics Industry Market Concentration & Dynamics
The animal diagnostics market exhibits a moderately concentrated structure, with a few dominant players and several smaller niche players. Market share is largely determined by technological advancements, R&D investment, and global reach. Major players such as IDEXX Laboratories Inc. and Zoetis Inc. hold significant shares, while smaller companies compete through specialized products and regional focus. The industry's innovation ecosystem is dynamic, driven by continuous advancements in molecular diagnostics, immunodiagnostic tests, and diagnostic imaging. Regulatory frameworks vary across regions, impacting market access and product approvals. Substitute products are limited, mainly focusing on traditional diagnostic methods, but technological advancements continuously reduce their relevance. End-user trends indicate an increasing preference for faster, more accurate, and convenient diagnostic solutions, driving the demand for point-of-care testing and telemedicine integration. M&A activity has been moderate, with a few significant deals boosting market consolidation.
- Market Share (2024 Estimate): IDEXX Laboratories Inc. (xx%), Zoetis Inc. (xx%), Heska Corporation (xx%), Others (xx%)
- M&A Deal Count (2019-2024): xx
Animal Diagnostics Industry Industry Insights & Trends
The global animal diagnostics market is experiencing robust growth, driven by several factors. Increasing pet ownership and rising pet healthcare expenditure globally are primary drivers. Technological advancements, such as the development of faster and more accurate diagnostic tests (including molecular diagnostics and point-of-care testing), contribute significantly to market expansion. Furthermore, a growing awareness of animal health among pet owners and veterinary professionals, coupled with an increasing demand for preventive healthcare, fuels market growth. The market is witnessing a rise in the adoption of advanced technologies like AI-powered diagnostic tools. The CAGR for the period 2025-2033 is estimated at xx%. The market size is projected to reach xx Million by 2033, up from xx Million in 2025.
Key Markets & Segments Leading Animal Diagnostics Industry
The global animal diagnostics market is segmented by animal type (cats, dogs, other animals), application (bacteriology, parasitology, clinical pathology, other applications), and technology (immunodiagnostic tests, molecular diagnostics, diagnostic imaging, other diagnostics). The dog segment currently holds the largest market share, driven by higher pet ownership and greater spending on companion animal healthcare. Clinical pathology represents a significant application segment, followed by parasitology. Immunodiagnostic tests remain dominant in technology, although molecular diagnostics are witnessing rapid growth due to their higher sensitivity and specificity. North America currently leads the market, followed by Europe and Asia-Pacific.
Drivers:
- High Pet Ownership: Growing urbanization and changing lifestyles.
- Increased Pet Healthcare Spending: Rising disposable incomes and increasing pet humanization.
- Technological Advancements: Development of faster and more accurate tests.
- Government Regulations: Increased regulatory scrutiny on animal health.
Dominance Analysis:
The North American market dominates due to high pet ownership rates, advanced veterinary infrastructure, and greater acceptance of advanced diagnostic technologies. Europe follows closely, while the Asia-Pacific region displays high growth potential due to rising disposable incomes and increasing pet ownership.
Animal Diagnostics Industry Product Developments
Recent years have witnessed significant product innovations in the animal diagnostics sector, driven by advancements in molecular diagnostics, immunodiagnostics, and imaging technologies. New point-of-care testing devices offer rapid and accurate results in veterinary clinics, while telemedicine integration expands access to diagnostics in remote areas. Companies continuously strive to enhance the speed, accuracy, and ease of use of their diagnostic tests, leveraging technological advancements to gain a competitive edge. These innovations are streamlining veterinary workflows and improving animal healthcare outcomes.
Challenges in the Animal Diagnostics Industry Market
The animal diagnostics industry faces several challenges. Regulatory hurdles in gaining approvals for new products in different regions pose a significant obstacle. Supply chain disruptions, particularly regarding raw materials and components, can impact production and distribution. Intense competition among established players and the emergence of new entrants contribute to price pressures and create challenges in market penetration. These factors, along with the high cost of R&D and regulatory compliance, can affect overall profitability. The estimated impact of these challenges on the market growth is approximately xx% reduction in CAGR.
Forces Driving Animal Diagnostics Industry Growth
Several factors drive the growth of the animal diagnostics industry. Technological advancements, such as the development of rapid diagnostic tests, point-of-care devices, and AI-powered diagnostic platforms, are significantly accelerating market expansion. Growing pet ownership and increased pet healthcare spending, fueled by rising disposable incomes and increased pet humanization, provide strong market demand. Furthermore, favorable government regulations supporting animal healthcare and increased investments in veterinary research contribute to industry growth.
Long-Term Growth Catalysts in the Animal Diagnostics Industry
Long-term growth in the animal diagnostics industry hinges on continued technological innovations like advanced molecular diagnostics and improved diagnostic imaging techniques. Strategic partnerships between diagnostics companies and veterinary clinics/hospitals will further enhance market penetration and improve access to advanced diagnostic capabilities. Expansion into new geographical markets, particularly in developing economies with growing pet ownership, presents substantial opportunities for growth.
Emerging Opportunities in Animal Diagnostics Industry
Emerging opportunities include the development of personalized medicine approaches for animals, leveraging genomics and other “omics” data for targeted diagnostics and treatments. The integration of AI and machine learning in diagnostic platforms enhances accuracy and efficiency. The expansion into companion animal diagnostics beyond traditional markets offers substantial growth potential. Furthermore, increasing demand for at-home diagnostic solutions and telemedicine integration creates new opportunities for innovation and market penetration.
Leading Players in the Animal Diagnostics Industry Sector
- Heska Corporation
- Innovative Diagnostics (IDvet)
- Zoetis Inc
- IDEXX Laboratories Inc
- BioMerieux SA
- Randox Laboratories Ltd
- Chembio Diagnostic Systems Inc
- Thermo Fisher Scientific Inc
- Indical Bioscience GmbH
- Creative Diagnostics
- Agrolabo SpA
- Virbac
- Neogen Corporation
Key Milestones in Animal Diagnostics Industry Industry
- August 2022: PepiPets launched a new mobile diagnostic testing service, expanding access to at-home pet diagnostics and creating a new market segment.
- January 2022: IDEXX Laboratories, Inc. introduced several product and service enhancements, improving efficiency in veterinary practices and enhancing diagnostic capabilities, which significantly impacted the market by improving workflow and diagnostic quality.
Strategic Outlook for Animal Diagnostics Industry Market
The animal diagnostics market is poised for continued robust growth, driven by technological advancements, increasing pet ownership, and rising pet healthcare spending. Strategic opportunities for companies include focusing on innovation, particularly in molecular diagnostics and point-of-care testing, expanding into emerging markets, and forming strategic alliances to enhance market penetration. Companies that can offer faster, more accurate, and convenient diagnostic solutions will be well-positioned to capture significant market share in the coming years.
Animal Diagnostics Industry Segmentation
-
1. Animals
- 1.1. Cats
- 1.2. Dogs
- 1.3. Other Animals
-
2. Application
- 2.1. Bacteriology
- 2.2. Parasitology
- 2.3. Clinical Pathology
- 2.4. Other Applications
-
3. Technology
- 3.1. Immunodiagnostic Tests
- 3.2. Molecular Diagnostics
- 3.3. Diagnostic Imaging
- 3.4. Other Diagnostics
Animal Diagnostics Industry Segmentation By Geography
-
1. North America
- 1.1. United States
- 1.2. Canada
- 1.3. Mexico
-
2. Europe
- 2.1. Germany
- 2.2. United Kingdom
- 2.3. France
- 2.4. Italy
- 2.5. Spain
- 2.6. Rest of Europe
-
3. Asia Pacific
- 3.1. China
- 3.2. Japan
- 3.3. India
- 3.4. Australia
- 3.5. South Korea
- 3.6. Rest of Asia Pacific
-
4. Middle East and Africa
- 4.1. GCC
- 4.2. South Africa
- 4.3. Rest of Middle East and Africa
-
5. South America
- 5.1. Brazil
- 5.2. Argentina
- 5.3. Rest of South America
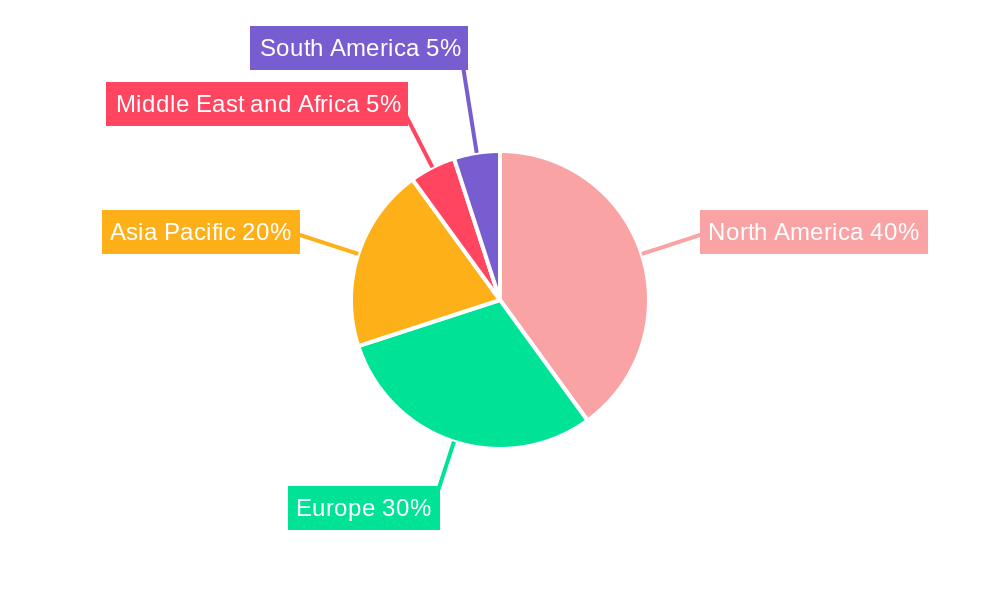
Animal Diagnostics Industry Regional Market Share
Geographic Coverage of Animal Diagnostics Industry
Animal Diagnostics Industry REPORT HIGHLIGHTS
| Aspects | Details |
|---|---|
| Study Period | 2020-2034 |
| Base Year | 2025 |
| Estimated Year | 2026 |
| Forecast Period | 2026-2034 |
| Historical Period | 2020-2025 |
| Growth Rate | CAGR of 10.00% from 2020-2034 |
| Segmentation |
|
Table of Contents
- 1. Introduction
- 1.1. Research Scope
- 1.2. Market Segmentation
- 1.3. Research Objective
- 1.4. Definitions and Assumptions
- 2. Executive Summary
- 2.1. Market Snapshot
- 3. Market Dynamics
- 3.1. Market Drivers
- 3.2. Market Restrains
- 3.3. Market Trends
- 3.4. Market Opportunities
- 4. Market Factor Analysis
- 4.1. Porters Five Forces
- 4.1.1. Bargaining Power of Suppliers
- 4.1.2. Bargaining Power of Buyers
- 4.1.3. Threat of New Entrants
- 4.1.4. Threat of Substitutes
- 4.1.5. Competitive Rivalry
- 4.2. PESTEL analysis
- 4.3. BCG Analysis
- 4.3.1. Stars (High Growth, High Market Share)
- 4.3.2. Cash Cows (Low Growth, High Market Share)
- 4.3.3. Question Mark (High Growth, Low Market Share)
- 4.3.4. Dogs (Low Growth, Low Market Share)
- 4.4. Ansoff Matrix Analysis
- 4.5. Supply Chain Analysis
- 4.6. Regulatory Landscape
- 4.7. Current Market Potential and Opportunity Assessment (TAM–SAM–SOM Framework)
- 4.8. MSR Analyst Note
- 4.1. Porters Five Forces
- 5. Market Analysis, Insights and Forecast 2021-2033
- 5.1. Market Analysis, Insights and Forecast - by Animals
- 5.1.1. Cats
- 5.1.2. Dogs
- 5.1.3. Other Animals
- 5.2. Market Analysis, Insights and Forecast - by Application
- 5.2.1. Bacteriology
- 5.2.2. Parasitology
- 5.2.3. Clinical Pathology
- 5.2.4. Other Applications
- 5.3. Market Analysis, Insights and Forecast - by Technology
- 5.3.1. Immunodiagnostic Tests
- 5.3.2. Molecular Diagnostics
- 5.3.3. Diagnostic Imaging
- 5.3.4. Other Diagnostics
- 5.4. Market Analysis, Insights and Forecast - by Region
- 5.4.1. North America
- 5.4.2. Europe
- 5.4.3. Asia Pacific
- 5.4.4. Middle East and Africa
- 5.4.5. South America
- 5.1. Market Analysis, Insights and Forecast - by Animals
- 6. Global Animal Diagnostics Industry Analysis, Insights and Forecast, 2021-2033
- 6.1. Market Analysis, Insights and Forecast - by Animals
- 6.1.1. Cats
- 6.1.2. Dogs
- 6.1.3. Other Animals
- 6.2. Market Analysis, Insights and Forecast - by Application
- 6.2.1. Bacteriology
- 6.2.2. Parasitology
- 6.2.3. Clinical Pathology
- 6.2.4. Other Applications
- 6.3. Market Analysis, Insights and Forecast - by Technology
- 6.3.1. Immunodiagnostic Tests
- 6.3.2. Molecular Diagnostics
- 6.3.3. Diagnostic Imaging
- 6.3.4. Other Diagnostics
- 6.1. Market Analysis, Insights and Forecast - by Animals
- 7. North America Animal Diagnostics Industry Analysis, Insights and Forecast, 2020-2032
- 7.1. Market Analysis, Insights and Forecast - by Animals
- 7.1.1. Cats
- 7.1.2. Dogs
- 7.1.3. Other Animals
- 7.2. Market Analysis, Insights and Forecast - by Application
- 7.2.1. Bacteriology
- 7.2.2. Parasitology
- 7.2.3. Clinical Pathology
- 7.2.4. Other Applications
- 7.3. Market Analysis, Insights and Forecast - by Technology
- 7.3.1. Immunodiagnostic Tests
- 7.3.2. Molecular Diagnostics
- 7.3.3. Diagnostic Imaging
- 7.3.4. Other Diagnostics
- 7.1. Market Analysis, Insights and Forecast - by Animals
- 8. Europe Animal Diagnostics Industry Analysis, Insights and Forecast, 2020-2032
- 8.1. Market Analysis, Insights and Forecast - by Animals
- 8.1.1. Cats
- 8.1.2. Dogs
- 8.1.3. Other Animals
- 8.2. Market Analysis, Insights and Forecast - by Application
- 8.2.1. Bacteriology
- 8.2.2. Parasitology
- 8.2.3. Clinical Pathology
- 8.2.4. Other Applications
- 8.3. Market Analysis, Insights and Forecast - by Technology
- 8.3.1. Immunodiagnostic Tests
- 8.3.2. Molecular Diagnostics
- 8.3.3. Diagnostic Imaging
- 8.3.4. Other Diagnostics
- 8.1. Market Analysis, Insights and Forecast - by Animals
- 9. Asia Pacific Animal Diagnostics Industry Analysis, Insights and Forecast, 2020-2032
- 9.1. Market Analysis, Insights and Forecast - by Animals
- 9.1.1. Cats
- 9.1.2. Dogs
- 9.1.3. Other Animals
- 9.2. Market Analysis, Insights and Forecast - by Application
- 9.2.1. Bacteriology
- 9.2.2. Parasitology
- 9.2.3. Clinical Pathology
- 9.2.4. Other Applications
- 9.3. Market Analysis, Insights and Forecast - by Technology
- 9.3.1. Immunodiagnostic Tests
- 9.3.2. Molecular Diagnostics
- 9.3.3. Diagnostic Imaging
- 9.3.4. Other Diagnostics
- 9.1. Market Analysis, Insights and Forecast - by Animals
- 10. Middle East and Africa Animal Diagnostics Industry Analysis, Insights and Forecast, 2020-2032
- 10.1. Market Analysis, Insights and Forecast - by Animals
- 10.1.1. Cats
- 10.1.2. Dogs
- 10.1.3. Other Animals
- 10.2. Market Analysis, Insights and Forecast - by Application
- 10.2.1. Bacteriology
- 10.2.2. Parasitology
- 10.2.3. Clinical Pathology
- 10.2.4. Other Applications
- 10.3. Market Analysis, Insights and Forecast - by Technology
- 10.3.1. Immunodiagnostic Tests
- 10.3.2. Molecular Diagnostics
- 10.3.3. Diagnostic Imaging
- 10.3.4. Other Diagnostics
- 10.1. Market Analysis, Insights and Forecast - by Animals
- 11. South America Animal Diagnostics Industry Analysis, Insights and Forecast, 2020-2032
- 11.1. Market Analysis, Insights and Forecast - by Animals
- 11.1.1. Cats
- 11.1.2. Dogs
- 11.1.3. Other Animals
- 11.2. Market Analysis, Insights and Forecast - by Application
- 11.2.1. Bacteriology
- 11.2.2. Parasitology
- 11.2.3. Clinical Pathology
- 11.2.4. Other Applications
- 11.3. Market Analysis, Insights and Forecast - by Technology
- 11.3.1. Immunodiagnostic Tests
- 11.3.2. Molecular Diagnostics
- 11.3.3. Diagnostic Imaging
- 11.3.4. Other Diagnostics
- 11.1. Market Analysis, Insights and Forecast - by Animals
- 12. Competitive Analysis
- 12.1. Company Profiles
- 12.1.1 Heska Corporation
- 12.1.1.1. Company Overview
- 12.1.1.2. Products
- 12.1.1.3. Company Financials
- 12.1.1.4. SWOT Analysis
- 12.1.2 Innovative Diagnostics (IDvet)
- 12.1.2.1. Company Overview
- 12.1.2.2. Products
- 12.1.2.3. Company Financials
- 12.1.2.4. SWOT Analysis
- 12.1.3 Zoetis Inc
- 12.1.3.1. Company Overview
- 12.1.3.2. Products
- 12.1.3.3. Company Financials
- 12.1.3.4. SWOT Analysis
- 12.1.4 IDEXX Laboratories Inc
- 12.1.4.1. Company Overview
- 12.1.4.2. Products
- 12.1.4.3. Company Financials
- 12.1.4.4. SWOT Analysis
- 12.1.5 BioMerieux SA
- 12.1.5.1. Company Overview
- 12.1.5.2. Products
- 12.1.5.3. Company Financials
- 12.1.5.4. SWOT Analysis
- 12.1.6 Randox Laboratories Ltd
- 12.1.6.1. Company Overview
- 12.1.6.2. Products
- 12.1.6.3. Company Financials
- 12.1.6.4. SWOT Analysis
- 12.1.7 Chembio Diagnostic Systems Inc
- 12.1.7.1. Company Overview
- 12.1.7.2. Products
- 12.1.7.3. Company Financials
- 12.1.7.4. SWOT Analysis
- 12.1.8 Thermo Fisher Scientific Inc
- 12.1.8.1. Company Overview
- 12.1.8.2. Products
- 12.1.8.3. Company Financials
- 12.1.8.4. SWOT Analysis
- 12.1.9 Indical Bioscience GmbH
- 12.1.9.1. Company Overview
- 12.1.9.2. Products
- 12.1.9.3. Company Financials
- 12.1.9.4. SWOT Analysis
- 12.1.10 Creative Diagnostics
- 12.1.10.1. Company Overview
- 12.1.10.2. Products
- 12.1.10.3. Company Financials
- 12.1.10.4. SWOT Analysis
- 12.1.11 Agrolabo SpA
- 12.1.11.1. Company Overview
- 12.1.11.2. Products
- 12.1.11.3. Company Financials
- 12.1.11.4. SWOT Analysis
- 12.1.12 Virbac
- 12.1.12.1. Company Overview
- 12.1.12.2. Products
- 12.1.12.3. Company Financials
- 12.1.12.4. SWOT Analysis
- 12.1.13 Neogen Corporation
- 12.1.13.1. Company Overview
- 12.1.13.2. Products
- 12.1.13.3. Company Financials
- 12.1.13.4. SWOT Analysis
- 12.1.1 Heska Corporation
- 12.2. Market Entropy
- 12.2.1 Company's Key Areas Served
- 12.2.2 Recent Developments
- 12.3. Company Market Share Analysis 2025
- 12.3.1 Top 5 Companies Market Share Analysis
- 12.3.2 Top 3 Companies Market Share Analysis
- 12.4. List of Potential Customers
- 13. Research Methodology
List of Figures
- Figure 1: Global Animal Diagnostics Industry Revenue Breakdown (Million, %) by Region 2025 & 2033
- Figure 2: Global Animal Diagnostics Industry Volume Breakdown (K Unit, %) by Region 2025 & 2033
- Figure 3: North America Animal Diagnostics Industry Revenue (Million), by Animals 2025 & 2033
- Figure 4: North America Animal Diagnostics Industry Volume (K Unit), by Animals 2025 & 2033
- Figure 5: North America Animal Diagnostics Industry Revenue Share (%), by Animals 2025 & 2033
- Figure 6: North America Animal Diagnostics Industry Volume Share (%), by Animals 2025 & 2033
- Figure 7: North America Animal Diagnostics Industry Revenue (Million), by Application 2025 & 2033
- Figure 8: North America Animal Diagnostics Industry Volume (K Unit), by Application 2025 & 2033
- Figure 9: North America Animal Diagnostics Industry Revenue Share (%), by Application 2025 & 2033
- Figure 10: North America Animal Diagnostics Industry Volume Share (%), by Application 2025 & 2033
- Figure 11: North America Animal Diagnostics Industry Revenue (Million), by Technology 2025 & 2033
- Figure 12: North America Animal Diagnostics Industry Volume (K Unit), by Technology 2025 & 2033
- Figure 13: North America Animal Diagnostics Industry Revenue Share (%), by Technology 2025 & 2033
- Figure 14: North America Animal Diagnostics Industry Volume Share (%), by Technology 2025 & 2033
- Figure 15: North America Animal Diagnostics Industry Revenue (Million), by Country 2025 & 2033
- Figure 16: North America Animal Diagnostics Industry Volume (K Unit), by Country 2025 & 2033
- Figure 17: North America Animal Diagnostics Industry Revenue Share (%), by Country 2025 & 2033
- Figure 18: North America Animal Diagnostics Industry Volume Share (%), by Country 2025 & 2033
- Figure 19: Europe Animal Diagnostics Industry Revenue (Million), by Animals 2025 & 2033
- Figure 20: Europe Animal Diagnostics Industry Volume (K Unit), by Animals 2025 & 2033
- Figure 21: Europe Animal Diagnostics Industry Revenue Share (%), by Animals 2025 & 2033
- Figure 22: Europe Animal Diagnostics Industry Volume Share (%), by Animals 2025 & 2033
- Figure 23: Europe Animal Diagnostics Industry Revenue (Million), by Application 2025 & 2033
- Figure 24: Europe Animal Diagnostics Industry Volume (K Unit), by Application 2025 & 2033
- Figure 25: Europe Animal Diagnostics Industry Revenue Share (%), by Application 2025 & 2033
- Figure 26: Europe Animal Diagnostics Industry Volume Share (%), by Application 2025 & 2033
- Figure 27: Europe Animal Diagnostics Industry Revenue (Million), by Technology 2025 & 2033
- Figure 28: Europe Animal Diagnostics Industry Volume (K Unit), by Technology 2025 & 2033
- Figure 29: Europe Animal Diagnostics Industry Revenue Share (%), by Technology 2025 & 2033
- Figure 30: Europe Animal Diagnostics Industry Volume Share (%), by Technology 2025 & 2033
- Figure 31: Europe Animal Diagnostics Industry Revenue (Million), by Country 2025 & 2033
- Figure 32: Europe Animal Diagnostics Industry Volume (K Unit), by Country 2025 & 2033
- Figure 33: Europe Animal Diagnostics Industry Revenue Share (%), by Country 2025 & 2033
- Figure 34: Europe Animal Diagnostics Industry Volume Share (%), by Country 2025 & 2033
- Figure 35: Asia Pacific Animal Diagnostics Industry Revenue (Million), by Animals 2025 & 2033
- Figure 36: Asia Pacific Animal Diagnostics Industry Volume (K Unit), by Animals 2025 & 2033
- Figure 37: Asia Pacific Animal Diagnostics Industry Revenue Share (%), by Animals 2025 & 2033
- Figure 38: Asia Pacific Animal Diagnostics Industry Volume Share (%), by Animals 2025 & 2033
- Figure 39: Asia Pacific Animal Diagnostics Industry Revenue (Million), by Application 2025 & 2033
- Figure 40: Asia Pacific Animal Diagnostics Industry Volume (K Unit), by Application 2025 & 2033
- Figure 41: Asia Pacific Animal Diagnostics Industry Revenue Share (%), by Application 2025 & 2033
- Figure 42: Asia Pacific Animal Diagnostics Industry Volume Share (%), by Application 2025 & 2033
- Figure 43: Asia Pacific Animal Diagnostics Industry Revenue (Million), by Technology 2025 & 2033
- Figure 44: Asia Pacific Animal Diagnostics Industry Volume (K Unit), by Technology 2025 & 2033
- Figure 45: Asia Pacific Animal Diagnostics Industry Revenue Share (%), by Technology 2025 & 2033
- Figure 46: Asia Pacific Animal Diagnostics Industry Volume Share (%), by Technology 2025 & 2033
- Figure 47: Asia Pacific Animal Diagnostics Industry Revenue (Million), by Country 2025 & 2033
- Figure 48: Asia Pacific Animal Diagnostics Industry Volume (K Unit), by Country 2025 & 2033
- Figure 49: Asia Pacific Animal Diagnostics Industry Revenue Share (%), by Country 2025 & 2033
- Figure 50: Asia Pacific Animal Diagnostics Industry Volume Share (%), by Country 2025 & 2033
- Figure 51: Middle East and Africa Animal Diagnostics Industry Revenue (Million), by Animals 2025 & 2033
- Figure 52: Middle East and Africa Animal Diagnostics Industry Volume (K Unit), by Animals 2025 & 2033
- Figure 53: Middle East and Africa Animal Diagnostics Industry Revenue Share (%), by Animals 2025 & 2033
- Figure 54: Middle East and Africa Animal Diagnostics Industry Volume Share (%), by Animals 2025 & 2033
- Figure 55: Middle East and Africa Animal Diagnostics Industry Revenue (Million), by Application 2025 & 2033
- Figure 56: Middle East and Africa Animal Diagnostics Industry Volume (K Unit), by Application 2025 & 2033
- Figure 57: Middle East and Africa Animal Diagnostics Industry Revenue Share (%), by Application 2025 & 2033
- Figure 58: Middle East and Africa Animal Diagnostics Industry Volume Share (%), by Application 2025 & 2033
- Figure 59: Middle East and Africa Animal Diagnostics Industry Revenue (Million), by Technology 2025 & 2033
- Figure 60: Middle East and Africa Animal Diagnostics Industry Volume (K Unit), by Technology 2025 & 2033
- Figure 61: Middle East and Africa Animal Diagnostics Industry Revenue Share (%), by Technology 2025 & 2033
- Figure 62: Middle East and Africa Animal Diagnostics Industry Volume Share (%), by Technology 2025 & 2033
- Figure 63: Middle East and Africa Animal Diagnostics Industry Revenue (Million), by Country 2025 & 2033
- Figure 64: Middle East and Africa Animal Diagnostics Industry Volume (K Unit), by Country 2025 & 2033
- Figure 65: Middle East and Africa Animal Diagnostics Industry Revenue Share (%), by Country 2025 & 2033
- Figure 66: Middle East and Africa Animal Diagnostics Industry Volume Share (%), by Country 2025 & 2033
- Figure 67: South America Animal Diagnostics Industry Revenue (Million), by Animals 2025 & 2033
- Figure 68: South America Animal Diagnostics Industry Volume (K Unit), by Animals 2025 & 2033
- Figure 69: South America Animal Diagnostics Industry Revenue Share (%), by Animals 2025 & 2033
- Figure 70: South America Animal Diagnostics Industry Volume Share (%), by Animals 2025 & 2033
- Figure 71: South America Animal Diagnostics Industry Revenue (Million), by Application 2025 & 2033
- Figure 72: South America Animal Diagnostics Industry Volume (K Unit), by Application 2025 & 2033
- Figure 73: South America Animal Diagnostics Industry Revenue Share (%), by Application 2025 & 2033
- Figure 74: South America Animal Diagnostics Industry Volume Share (%), by Application 2025 & 2033
- Figure 75: South America Animal Diagnostics Industry Revenue (Million), by Technology 2025 & 2033
- Figure 76: South America Animal Diagnostics Industry Volume (K Unit), by Technology 2025 & 2033
- Figure 77: South America Animal Diagnostics Industry Revenue Share (%), by Technology 2025 & 2033
- Figure 78: South America Animal Diagnostics Industry Volume Share (%), by Technology 2025 & 2033
- Figure 79: South America Animal Diagnostics Industry Revenue (Million), by Country 2025 & 2033
- Figure 80: South America Animal Diagnostics Industry Volume (K Unit), by Country 2025 & 2033
- Figure 81: South America Animal Diagnostics Industry Revenue Share (%), by Country 2025 & 2033
- Figure 82: South America Animal Diagnostics Industry Volume Share (%), by Country 2025 & 2033
List of Tables
- Table 1: Global Animal Diagnostics Industry Revenue Million Forecast, by Animals 2020 & 2033
- Table 2: Global Animal Diagnostics Industry Volume K Unit Forecast, by Animals 2020 & 2033
- Table 3: Global Animal Diagnostics Industry Revenue Million Forecast, by Application 2020 & 2033
- Table 4: Global Animal Diagnostics Industry Volume K Unit Forecast, by Application 2020 & 2033
- Table 5: Global Animal Diagnostics Industry Revenue Million Forecast, by Technology 2020 & 2033
- Table 6: Global Animal Diagnostics Industry Volume K Unit Forecast, by Technology 2020 & 2033
- Table 7: Global Animal Diagnostics Industry Revenue Million Forecast, by Region 2020 & 2033
- Table 8: Global Animal Diagnostics Industry Volume K Unit Forecast, by Region 2020 & 2033
- Table 9: Global Animal Diagnostics Industry Revenue Million Forecast, by Animals 2020 & 2033
- Table 10: Global Animal Diagnostics Industry Volume K Unit Forecast, by Animals 2020 & 2033
- Table 11: Global Animal Diagnostics Industry Revenue Million Forecast, by Application 2020 & 2033
- Table 12: Global Animal Diagnostics Industry Volume K Unit Forecast, by Application 2020 & 2033
- Table 13: Global Animal Diagnostics Industry Revenue Million Forecast, by Technology 2020 & 2033
- Table 14: Global Animal Diagnostics Industry Volume K Unit Forecast, by Technology 2020 & 2033
- Table 15: Global Animal Diagnostics Industry Revenue Million Forecast, by Country 2020 & 2033
- Table 16: Global Animal Diagnostics Industry Volume K Unit Forecast, by Country 2020 & 2033
- Table 17: United States Animal Diagnostics Industry Revenue (Million) Forecast, by Application 2020 & 2033
- Table 18: United States Animal Diagnostics Industry Volume (K Unit) Forecast, by Application 2020 & 2033
- Table 19: Canada Animal Diagnostics Industry Revenue (Million) Forecast, by Application 2020 & 2033
- Table 20: Canada Animal Diagnostics Industry Volume (K Unit) Forecast, by Application 2020 & 2033
- Table 21: Mexico Animal Diagnostics Industry Revenue (Million) Forecast, by Application 2020 & 2033
- Table 22: Mexico Animal Diagnostics Industry Volume (K Unit) Forecast, by Application 2020 & 2033
- Table 23: Global Animal Diagnostics Industry Revenue Million Forecast, by Animals 2020 & 2033
- Table 24: Global Animal Diagnostics Industry Volume K Unit Forecast, by Animals 2020 & 2033
- Table 25: Global Animal Diagnostics Industry Revenue Million Forecast, by Application 2020 & 2033
- Table 26: Global Animal Diagnostics Industry Volume K Unit Forecast, by Application 2020 & 2033
- Table 27: Global Animal Diagnostics Industry Revenue Million Forecast, by Technology 2020 & 2033
- Table 28: Global Animal Diagnostics Industry Volume K Unit Forecast, by Technology 2020 & 2033
- Table 29: Global Animal Diagnostics Industry Revenue Million Forecast, by Country 2020 & 2033
- Table 30: Global Animal Diagnostics Industry Volume K Unit Forecast, by Country 2020 & 2033
- Table 31: Germany Animal Diagnostics Industry Revenue (Million) Forecast, by Application 2020 & 2033
- Table 32: Germany Animal Diagnostics Industry Volume (K Unit) Forecast, by Application 2020 & 2033
- Table 33: United Kingdom Animal Diagnostics Industry Revenue (Million) Forecast, by Application 2020 & 2033
- Table 34: United Kingdom Animal Diagnostics Industry Volume (K Unit) Forecast, by Application 2020 & 2033
- Table 35: France Animal Diagnostics Industry Revenue (Million) Forecast, by Application 2020 & 2033
- Table 36: France Animal Diagnostics Industry Volume (K Unit) Forecast, by Application 2020 & 2033
- Table 37: Italy Animal Diagnostics Industry Revenue (Million) Forecast, by Application 2020 & 2033
- Table 38: Italy Animal Diagnostics Industry Volume (K Unit) Forecast, by Application 2020 & 2033
- Table 39: Spain Animal Diagnostics Industry Revenue (Million) Forecast, by Application 2020 & 2033
- Table 40: Spain Animal Diagnostics Industry Volume (K Unit) Forecast, by Application 2020 & 2033
- Table 41: Rest of Europe Animal Diagnostics Industry Revenue (Million) Forecast, by Application 2020 & 2033
- Table 42: Rest of Europe Animal Diagnostics Industry Volume (K Unit) Forecast, by Application 2020 & 2033
- Table 43: Global Animal Diagnostics Industry Revenue Million Forecast, by Animals 2020 & 2033
- Table 44: Global Animal Diagnostics Industry Volume K Unit Forecast, by Animals 2020 & 2033
- Table 45: Global Animal Diagnostics Industry Revenue Million Forecast, by Application 2020 & 2033
- Table 46: Global Animal Diagnostics Industry Volume K Unit Forecast, by Application 2020 & 2033
- Table 47: Global Animal Diagnostics Industry Revenue Million Forecast, by Technology 2020 & 2033
- Table 48: Global Animal Diagnostics Industry Volume K Unit Forecast, by Technology 2020 & 2033
- Table 49: Global Animal Diagnostics Industry Revenue Million Forecast, by Country 2020 & 2033
- Table 50: Global Animal Diagnostics Industry Volume K Unit Forecast, by Country 2020 & 2033
- Table 51: China Animal Diagnostics Industry Revenue (Million) Forecast, by Application 2020 & 2033
- Table 52: China Animal Diagnostics Industry Volume (K Unit) Forecast, by Application 2020 & 2033
- Table 53: Japan Animal Diagnostics Industry Revenue (Million) Forecast, by Application 2020 & 2033
- Table 54: Japan Animal Diagnostics Industry Volume (K Unit) Forecast, by Application 2020 & 2033
- Table 55: India Animal Diagnostics Industry Revenue (Million) Forecast, by Application 2020 & 2033
- Table 56: India Animal Diagnostics Industry Volume (K Unit) Forecast, by Application 2020 & 2033
- Table 57: Australia Animal Diagnostics Industry Revenue (Million) Forecast, by Application 2020 & 2033
- Table 58: Australia Animal Diagnostics Industry Volume (K Unit) Forecast, by Application 2020 & 2033
- Table 59: South Korea Animal Diagnostics Industry Revenue (Million) Forecast, by Application 2020 & 2033
- Table 60: South Korea Animal Diagnostics Industry Volume (K Unit) Forecast, by Application 2020 & 2033
- Table 61: Rest of Asia Pacific Animal Diagnostics Industry Revenue (Million) Forecast, by Application 2020 & 2033
- Table 62: Rest of Asia Pacific Animal Diagnostics Industry Volume (K Unit) Forecast, by Application 2020 & 2033
- Table 63: Global Animal Diagnostics Industry Revenue Million Forecast, by Animals 2020 & 2033
- Table 64: Global Animal Diagnostics Industry Volume K Unit Forecast, by Animals 2020 & 2033
- Table 65: Global Animal Diagnostics Industry Revenue Million Forecast, by Application 2020 & 2033
- Table 66: Global Animal Diagnostics Industry Volume K Unit Forecast, by Application 2020 & 2033
- Table 67: Global Animal Diagnostics Industry Revenue Million Forecast, by Technology 2020 & 2033
- Table 68: Global Animal Diagnostics Industry Volume K Unit Forecast, by Technology 2020 & 2033
- Table 69: Global Animal Diagnostics Industry Revenue Million Forecast, by Country 2020 & 2033
- Table 70: Global Animal Diagnostics Industry Volume K Unit Forecast, by Country 2020 & 2033
- Table 71: GCC Animal Diagnostics Industry Revenue (Million) Forecast, by Application 2020 & 2033
- Table 72: GCC Animal Diagnostics Industry Volume (K Unit) Forecast, by Application 2020 & 2033
- Table 73: South Africa Animal Diagnostics Industry Revenue (Million) Forecast, by Application 2020 & 2033
- Table 74: South Africa Animal Diagnostics Industry Volume (K Unit) Forecast, by Application 2020 & 2033
- Table 75: Rest of Middle East and Africa Animal Diagnostics Industry Revenue (Million) Forecast, by Application 2020 & 2033
- Table 76: Rest of Middle East and Africa Animal Diagnostics Industry Volume (K Unit) Forecast, by Application 2020 & 2033
- Table 77: Global Animal Diagnostics Industry Revenue Million Forecast, by Animals 2020 & 2033
- Table 78: Global Animal Diagnostics Industry Volume K Unit Forecast, by Animals 2020 & 2033
- Table 79: Global Animal Diagnostics Industry Revenue Million Forecast, by Application 2020 & 2033
- Table 80: Global Animal Diagnostics Industry Volume K Unit Forecast, by Application 2020 & 2033
- Table 81: Global Animal Diagnostics Industry Revenue Million Forecast, by Technology 2020 & 2033
- Table 82: Global Animal Diagnostics Industry Volume K Unit Forecast, by Technology 2020 & 2033
- Table 83: Global Animal Diagnostics Industry Revenue Million Forecast, by Country 2020 & 2033
- Table 84: Global Animal Diagnostics Industry Volume K Unit Forecast, by Country 2020 & 2033
- Table 85: Brazil Animal Diagnostics Industry Revenue (Million) Forecast, by Application 2020 & 2033
- Table 86: Brazil Animal Diagnostics Industry Volume (K Unit) Forecast, by Application 2020 & 2033
- Table 87: Argentina Animal Diagnostics Industry Revenue (Million) Forecast, by Application 2020 & 2033
- Table 88: Argentina Animal Diagnostics Industry Volume (K Unit) Forecast, by Application 2020 & 2033
- Table 89: Rest of South America Animal Diagnostics Industry Revenue (Million) Forecast, by Application 2020 & 2033
- Table 90: Rest of South America Animal Diagnostics Industry Volume (K Unit) Forecast, by Application 2020 & 2033
Frequently Asked Questions
1. What is the projected Compound Annual Growth Rate (CAGR) of the Animal Diagnostics Industry?
The projected CAGR is approximately 10.00%.
2. Which companies are prominent players in the Animal Diagnostics Industry?
Key companies in the market include Heska Corporation, Innovative Diagnostics (IDvet), Zoetis Inc , IDEXX Laboratories Inc, BioMerieux SA, Randox Laboratories Ltd, Chembio Diagnostic Systems Inc, Thermo Fisher Scientific Inc, Indical Bioscience GmbH, Creative Diagnostics, Agrolabo SpA, Virbac, Neogen Corporation.
3. What are the main segments of the Animal Diagnostics Industry?
The market segments include Animals, Application, Technology.
4. Can you provide details about the market size?
The market size is estimated to be USD 3.11 Million as of 2022.
5. What are some drivers contributing to market growth?
Rising Demand for Pet Insurance; Growth in the Companion Animal Population; Increasing Number of Veterinary Practitioners in Developed Economies.
6. What are the notable trends driving market growth?
Molecular Diagnostics is Expected to Witness Growth Over the Forecast Period.
7. Are there any restraints impacting market growth?
Rising Burden of the Pet Care Cost.
8. Can you provide examples of recent developments in the market?
August 2022: PepiPets launched a new mobile diagnostic testing service allowing clients to receive diagnostic testing at home for their pets.
9. What pricing options are available for accessing the report?
Pricing options include single-user, multi-user, and enterprise licenses priced at USD 4750, USD 5250, and USD 8750 respectively.
10. Is the market size provided in terms of value or volume?
The market size is provided in terms of value, measured in Million and volume, measured in K Unit.
11. Are there any specific market keywords associated with the report?
Yes, the market keyword associated with the report is "Animal Diagnostics Industry," which aids in identifying and referencing the specific market segment covered.
12. How do I determine which pricing option suits my needs best?
The pricing options vary based on user requirements and access needs. Individual users may opt for single-user licenses, while businesses requiring broader access may choose multi-user or enterprise licenses for cost-effective access to the report.
13. Are there any additional resources or data provided in the Animal Diagnostics Industry report?
While the report offers comprehensive insights, it's advisable to review the specific contents or supplementary materials provided to ascertain if additional resources or data are available.
14. How can I stay updated on further developments or reports in the Animal Diagnostics Industry?
To stay informed about further developments, trends, and reports in the Animal Diagnostics Industry, consider subscribing to industry newsletters, following relevant companies and organizations, or regularly checking reputable industry news sources and publications.
Methodology
Step 1 - Identification of Relevant Samples Size from Population Database


Step 2 - Approaches for Defining Global Market Size (Value, Volume* & Price*)

Note*: In applicable scenarios
Step 3 - Data Sources
Primary Research
- Web Analytics
- Survey Reports
- Research Institute
- Latest Research Reports
- Opinion Leaders
Secondary Research
- Annual Reports
- White Paper
- Latest Press Release
- Industry Association
- Paid Database
- Investor Presentations

Step 4 - Data Triangulation
Involves using different sources of information in order to increase the validity of a study
These sources are likely to be stakeholders in a program - participants, other researchers, program staff, other community members, and so on.
Then we put all data in single framework & apply various statistical tools to find out the dynamic on the market.
During the analysis stage, feedback from the stakeholder groups would be compared to determine areas of agreement as well as areas of divergence