

Key Insights
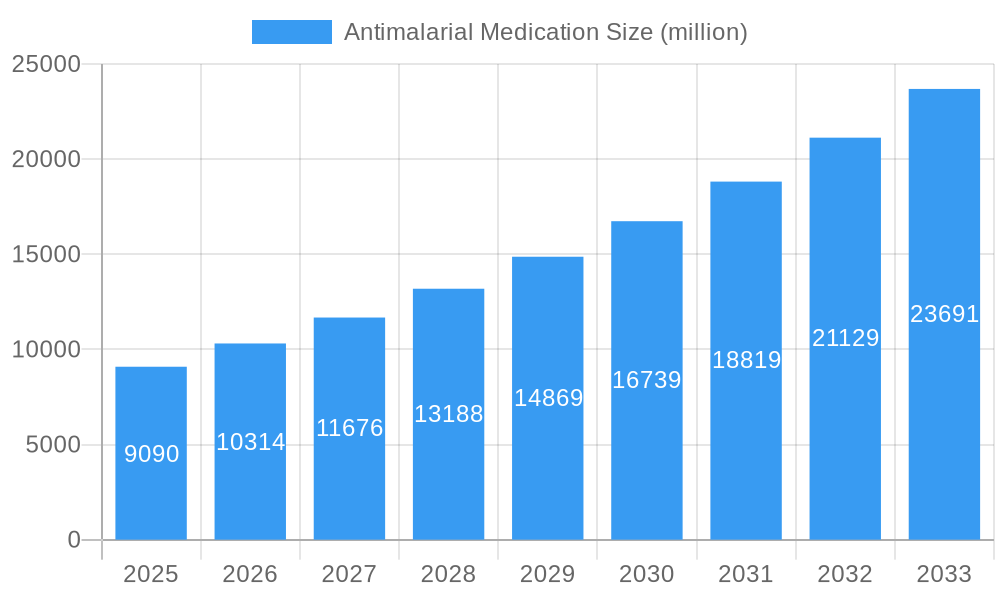
The global Antimalarial Medication market is poised for significant expansion, projected to reach USD 9.09 billion by 2025, driven by a robust compound annual growth rate (CAGR) of 13.52%. This impressive growth is fueled by a combination of factors including the persistent global burden of malaria, particularly in endemic regions of Africa and Southeast Asia, and ongoing efforts to combat drug-resistant strains of the parasite. Pharmaceutical companies are investing heavily in research and development to introduce novel antimalarial drugs with improved efficacy and safety profiles. The increasing prevalence of Plasmodium falciparum, the most deadly malaria parasite, necessitates continuous innovation and widespread access to effective treatments. Furthermore, a growing emphasis on public health initiatives and international collaborations to eradicate malaria are contributing to market expansion. Strategic partnerships between governments, non-governmental organizations (NGOs), and pharmaceutical giants are crucial in ensuring the accessibility and affordability of these life-saving medications across vulnerable populations.
Antimalarial Medication Market Size (In Billion)
The market is experiencing dynamic shifts across its segments. The Hospital Pharmacy segment is expected to lead in terms of revenue, owing to the critical role of hospitals in diagnosis and treatment of severe malaria cases. However, the E-Commerce segment is witnessing rapid growth as online pharmacies offer convenience and accessibility, especially in regions with limited healthcare infrastructure. While advancements in diagnostics and preventative measures are important, the core demand for antimalarial medications remains strong, spurred by the need to manage existing infections and prevent relapses. Key players like GlaxoSmithKline, F. Hoffmann-La Roche, Novartis, and Pfizer are actively involved in the market, with ongoing R&D efforts focused on developing next-generation antimalarials. The market is strategically segmented by Plasmodium Falciparum, Plasmodium Malariae, Plasmodium Vivax, and Plasmodium Ovale, reflecting the diverse nature of malaria infections. Future growth will likely be shaped by advancements in combination therapies and the strategic rollout of these medications in high-burden countries.
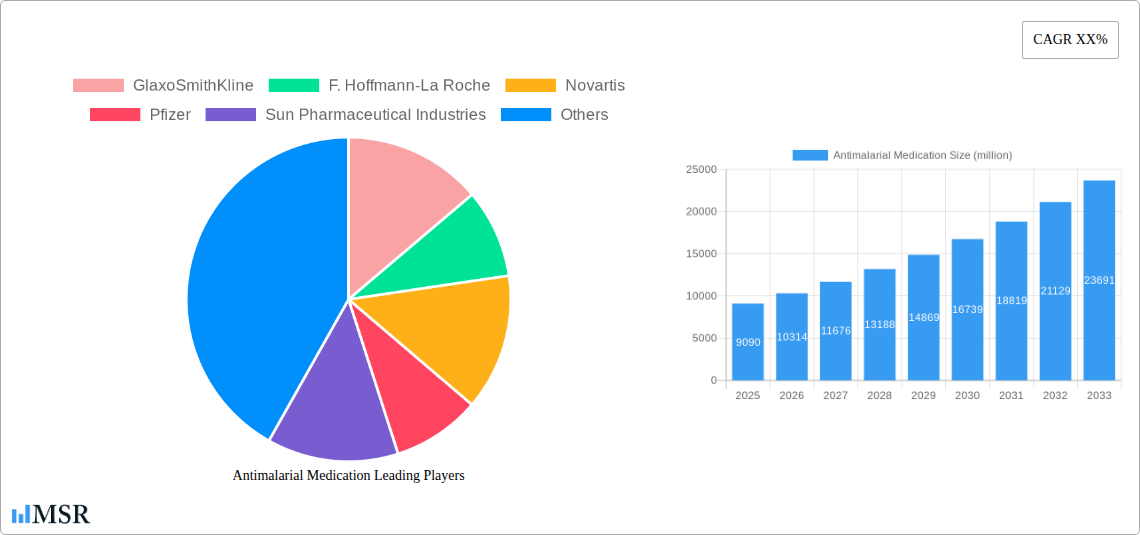
Antimalarial Medication Company Market Share
Antimalarial Medication Market: Comprehensive Industry Analysis & Growth Projections (2019-2033)
This in-depth report offers a definitive analysis of the global Antimalarial Medication market, forecasting significant growth and highlighting key industry dynamics from 2019 to 2033. Covering market concentration, groundbreaking trends, regional dominance, product innovation, challenges, growth drivers, emerging opportunities, leading players, and pivotal milestones, this report is essential for pharmaceutical companies, healthcare providers, investors, and policymakers seeking to capitalize on this billion-dollar market.
Antimalarial Medication Market Concentration & Dynamics
The global Antimalarial Medication market, valued at over $5 billion in 2025, exhibits a moderate to high concentration, with key players like GlaxoSmithKline, F. Hoffmann-La Roche, Novartis, Pfizer, Sun Pharmaceutical Industries, and Merck holding substantial market shares. The innovation ecosystem is characterized by continuous research and development in novel drug formulations and combination therapies to combat drug-resistant strains of Plasmodium falciparum and Plasmodium vivax. Regulatory frameworks, primarily governed by bodies like the World Health Organization (WHO) and national health authorities, play a critical role in drug approval, pricing, and accessibility, influencing market entry and expansion. Substitute products, including preventive measures and insecticidal interventions, complement therapeutic treatments, creating a multifaceted approach to malaria control. End-user trends are shifting towards combination therapies and more convenient dosing regimens, driven by patient adherence and efficacy requirements. Mergers and acquisitions (M&A) activities, though moderate, are strategically aimed at consolidating market presence, acquiring novel drug pipelines, and expanding geographical reach. In the historical period (2019-2024), there were approximately 15 significant M&A deals valued at over $2 billion cumulatively, indicating a dynamic landscape.
- Market Share Snapshot (2025):
- GlaxoSmithKline: ~18%
- F. Hoffmann-La Roche: ~15%
- Novartis: ~12%
- Pfizer: ~10%
- Sun Pharmaceutical Industries: ~8%
- Merck: ~7%
- Others: ~30%
- M&A Activity (2019-2024):
- Total Deal Count: 15
- Estimated Cumulative Deal Value: $2.5 billion
Antimalarial Medication Industry Insights & Trends
The Antimalarial Medication market is poised for substantial growth, projected to reach over $10 billion by 2033, driven by an impressive Compound Annual Growth Rate (CAGR) of approximately 7.5% from the base year 2025. This upward trajectory is fueled by several critical market growth drivers. A primary catalyst is the persistent global burden of malaria, particularly in sub-Saharan Africa, Southeast Asia, and parts of South America, necessitating continuous access to effective treatments. Government initiatives and non-governmental organizations (NGOs) are actively funding malaria eradication programs, increasing demand for antimalarial drugs. Furthermore, the rise of drug-resistant malaria strains is a significant concern, prompting substantial investment in research and development of new, more potent antimalarial medications and combination therapies.
Technological disruptions are playing a pivotal role in shaping the industry. Advancements in drug discovery and formulation technologies are leading to the development of drugs with improved efficacy, reduced side effects, and enhanced patient compliance. This includes the exploration of novel drug targets and the utilization of artificial intelligence (AI) in accelerating drug development processes. Precision medicine approaches, tailoring treatments based on genetic profiles and parasite strains, are also gaining traction, promising more targeted and effective interventions.
Evolving consumer behaviors, particularly within healthcare ecosystems, are influencing market dynamics. Patients and healthcare providers alike are demanding more convenient and effective treatment options. This translates to a preference for single-dose therapies, fixed-dose combinations, and medications with improved pharmacokinetic profiles. The increasing awareness about malaria prevention and treatment in endemic regions also contributes to market expansion. The retail pharmacy segment, in particular, is witnessing a rise in over-the-counter malaria testing kits and preventive medications, driven by accessibility and self-care trends. The e-commerce segment, while nascent in some regions, is showing significant potential for growth in delivering antimalarial medications directly to consumers and healthcare facilities, especially in remote areas. The overall market size for antimalarial medications in 2025 is estimated to be over $5 billion.
Key Markets & Segments Leading Antimalarial Medication
The Antimalarial Medication market is witnessing significant leadership from specific regions and application segments, driven by a confluence of economic, infrastructural, and health-related factors. Sub-Saharan Africa, accounting for over 70% of global malaria cases, remains the largest and most critical market. Within this region, countries like Nigeria, Democratic Republic of Congo, and Tanzania are the primary consumers of antimalarial drugs due to the high prevalence of Plasmodium falciparum.
Dominant Application Segments:
- Hospital Pharmacy: This segment holds the largest market share, estimated at over $2 billion in 2025.
- Drivers:
- Higher incidence of severe malaria cases requiring intravenous administration and intensive care.
- Centralized procurement by government health ministries and large healthcare organizations.
- Availability of a wider range of antimalarial drugs and diagnostic facilities.
- Strict adherence to treatment protocols and physician prescriptions.
- Drivers:
- Retail Pharmacy: This segment is experiencing robust growth, projected to exceed $1.5 billion by 2025.
- Drivers:
- Increased accessibility of over-the-counter antimalarial medications for milder infections.
- Growing awareness and self-medication practices in endemic areas.
- Expansion of pharmacy networks in both urban and rural settings.
- Availability of generic antimalarial drugs at competitive prices.
- Drivers:
- E-Commerce: While currently a smaller segment, estimated at $500 million in 2025, it presents immense growth potential.
- Drivers:
- Growing internet penetration and digital literacy in developing nations.
- Convenience of home delivery, especially for remote populations.
- Availability of a wider selection of specialized antimalarial products.
- Potential for online consultations and prescription fulfillment.
- Drivers:
- Others: This segment, including NGOs and public health programs, accounts for a significant portion of antimalarial drug distribution, estimated at over $1 billion in 2025.
- Drivers:
- Large-scale distribution programs funded by international organizations.
- Targeted interventions in high-burden areas.
- Focus on affordability and accessibility for vulnerable populations.
- Drivers:
Dominant Parasite Types:
The market is heavily influenced by the prevalence of specific Plasmodium species.
- Plasmodium Falciparum: This is the most virulent and dominant species, responsible for the majority of malaria deaths globally. Consequently, medications targeting P. falciparum, particularly Artemisinin-based Combination Therapies (ACTs), constitute the largest segment of the antimalarial market. The market share for treatments effective against P. falciparum is estimated to be over 65% of the total antimalarial drug market in 2025.
- Plasmodium Vivax: This species is the second most prevalent and is significant in regions like Southeast Asia and Latin America. Medications that address the dormant liver stages of P. vivax (hypnozoites) are crucial, leading to a substantial market for drugs like primaquine and tafenoquine. This segment holds an estimated market share of approximately 20% in 2025.
- Plasmodium Malariae and Plasmodium Ovale: These species are less common globally but still contribute to the overall antimalarial medication market. Treatments for these species are often covered by broader-spectrum antimalarials or specific regimens. Their combined market share is estimated to be around 15% in 2025.
Antimalarial Medication Product Developments
Product development in the Antimalarial Medication market is heavily focused on combating drug resistance and improving patient outcomes. Innovations include novel fixed-dose combination (FDC) therapies that enhance adherence and efficacy, particularly against multi-drug resistant strains of Plasmodium falciparum. Research is also progressing on the development of novel drug candidates targeting different stages of the parasite lifecycle and exploring new chemical entities with unique mechanisms of action. Furthermore, there is a growing emphasis on developing long-acting injectables and potential vaccine candidates, which, if successful, could revolutionize malaria prevention and treatment by significantly reducing reliance on daily oral medications. The market relevance of these developments lies in their ability to address unmet medical needs, improve public health, and drive market growth.
Challenges in the Antimalarial Medication Market
The Antimalarial Medication market faces several significant challenges that impede its full growth potential. Drug resistance remains a paramount concern, as the Plasmodium parasite rapidly evolves, necessitating continuous development of new and more effective treatments. The high cost of research and development for novel antimalarial drugs, coupled with uncertain market returns, often discourages pharmaceutical companies. Stringent regulatory pathways for drug approval, although crucial for patient safety, can also lead to delays in market entry. Furthermore, supply chain disruptions, particularly in low-income endemic regions, can affect the availability and affordability of essential medications. Competitive pressures from generic manufacturers, while beneficial for affordability, can impact the profitability of branded innovators. These challenges collectively add billions of dollars in potential market value lost due to unmet needs and access barriers.
- Drug Resistance: Ongoing evolution of parasite resistance to existing therapies.
- High R&D Costs: Substantial investment required for novel drug discovery and development.
- Regulatory Hurdles: Lengthy and complex drug approval processes.
- Supply Chain Inefficiencies: Logistical challenges in reaching remote and underserved populations.
- Pricing Pressures: Balancing affordability with the need for sustainable innovation.
Forces Driving Antimalarial Medication Growth
The Antimalarial Medication market is propelled by a potent combination of technological advancements, economic factors, and evolving regulatory landscapes. The persistent global burden of malaria, especially in tropical and subtropical regions, acts as a fundamental driver, ensuring sustained demand for effective treatments. Government and international health organizations' commitments to malaria eradication programs, backed by significant funding exceeding $2 billion annually, further bolster market growth by supporting procurement and distribution initiatives. Technological innovations in drug discovery, including genomics and AI-driven research, are accelerating the development of novel antimalarial agents with improved efficacy and reduced resistance potential. Economic growth in endemic countries, leading to increased healthcare expenditure and improved access to medical facilities, also contributes significantly. Favorable regulatory policies aimed at expediting the approval of promising antimalarial drugs and incentivizing R&D further catalyze market expansion.
Challenges in the Antimalarial Medication Market
Long-term growth in the Antimalarial Medication market hinges on overcoming persistent obstacles and capitalizing on emerging strengths. The primary growth catalyst lies in continued innovation in drug development. This includes the pursuit of therapies targeting novel parasite pathways, the development of effective vaccines, and the creation of more user-friendly formulations, such as long-acting injectables, which are estimated to address a market segment of over $1 billion in potential future revenue. Strategic partnerships between pharmaceutical giants like GlaxoSmithKline and Novartis, along with academic institutions and non-profit organizations, are crucial for sharing expertise and resources to accelerate R&D. Market expansion into underserved regions, coupled with effective public-private collaborations, will be key to increasing access and driving sustainable growth. Furthermore, the ongoing threat of emerging infectious diseases and the potential for malaria to spread to new geographical areas underscore the critical need for robust and adaptable antimalarial medication strategies, representing a growth opportunity of over $500 million in preparedness investments.
Emerging Opportunities in Antimalarial Medication
The Antimalarial Medication market is ripe with emerging opportunities driven by evolving global health priorities and technological advancements. The development and widespread adoption of malaria vaccines represent a transformative opportunity, potentially shifting the market focus from treatment to prevention, with an estimated future market value in the billions. Novel drug delivery systems, such as nanoparticle-based therapies and long-acting injectables, offer significant potential for improving treatment adherence and efficacy, opening up new revenue streams estimated at over $1 billion. The expansion of e-commerce platforms for pharmaceutical distribution in low- and middle-income countries presents a substantial opportunity to improve access to antimalarial medications, with projected growth of over 20% annually. Furthermore, increasing investment in global health initiatives and the growing focus on neglected tropical diseases are creating a more favorable environment for the development and commercialization of antimalarial drugs, with potential for over $500 million in new funding. The growing threat of climate change and its impact on malaria transmission patterns may also necessitate the development of new preventative and therapeutic strategies, creating further market opportunities.
Leading Players in the Antimalarial Medication Sector
- GlaxoSmithKline
- F. Hoffmann-La Roche
- Novartis
- Pfizer
- Sun Pharmaceutical Industries
- Merck
- Sanofi
- AstraZeneca
- Takeda Pharmaceutical Company
- Ipsen
Key Milestones in Antimalarial Medication Industry
- 2019: Launch of tafenoquine (Krintafel/Kozenis) for the radical cure and prophylaxis of Plasmodium vivax malaria by GlaxoSmithKline.
- 2020: World Health Organization (WHO) recommends widespread use of the RTS,S/AS01 malaria vaccine in children.
- 2021: Continued research and clinical trials for novel antimalarial drug candidates, focusing on combating artemisinin resistance.
- 2022: Significant increase in global funding for malaria control programs, exceeding $3 billion.
- 2023: Emergence of new concerns regarding Plasmodium falciparum resistance to dihydroartemisinin-piperaquine in specific regions, prompting renewed focus on alternative therapies.
- 2024: Advancements in AI-driven drug discovery leading to the identification of promising new antimalarial compound targets.
Strategic Outlook for Antimalarial Medication Market
The strategic outlook for the Antimalarial Medication market is overwhelmingly positive, characterized by robust growth accelerators and significant expansion opportunities. Continued investment in R&D for novel therapies and vaccines will be paramount to outpace parasite resistance and address unmet medical needs, creating a market potential estimated to be worth billions. The expansion of global malaria control initiatives and increasing governmental commitment to eradication programs will ensure sustained demand. Furthermore, the strategic leveraging of e-commerce platforms and improved supply chain logistics will enhance accessibility and affordability in endemic regions, driving market penetration. Public-private partnerships will remain critical for fostering innovation and facilitating the widespread distribution of essential antimalarial medications, solidifying the market's trajectory towards significant value creation and disease reduction. The estimated market value by 2033 is projected to exceed $10 billion.
Antimalarial Medication Segmentation
-
1. Application
- 1.1. Hospital Pharmacy
- 1.2. Retail Pharmacy
- 1.3. E- Commerce
- 1.4. Others
-
2. Types
- 2.1. Plasmodium Falciparum
- 2.2. Plasmodium Malariae
- 2.3. Plasmodium Vivax
- 2.4. Plasmodium Ovale
Antimalarial Medication Segmentation By Geography
-
1. North America
- 1.1. United States
- 1.2. Canada
- 1.3. Mexico
-
2. South America
- 2.1. Brazil
- 2.2. Argentina
- 2.3. Rest of South America
-
3. Europe
- 3.1. United Kingdom
- 3.2. Germany
- 3.3. France
- 3.4. Italy
- 3.5. Spain
- 3.6. Russia
- 3.7. Benelux
- 3.8. Nordics
- 3.9. Rest of Europe
-
4. Middle East & Africa
- 4.1. Turkey
- 4.2. Israel
- 4.3. GCC
- 4.4. North Africa
- 4.5. South Africa
- 4.6. Rest of Middle East & Africa
-
5. Asia Pacific
- 5.1. China
- 5.2. India
- 5.3. Japan
- 5.4. South Korea
- 5.5. ASEAN
- 5.6. Oceania
- 5.7. Rest of Asia Pacific
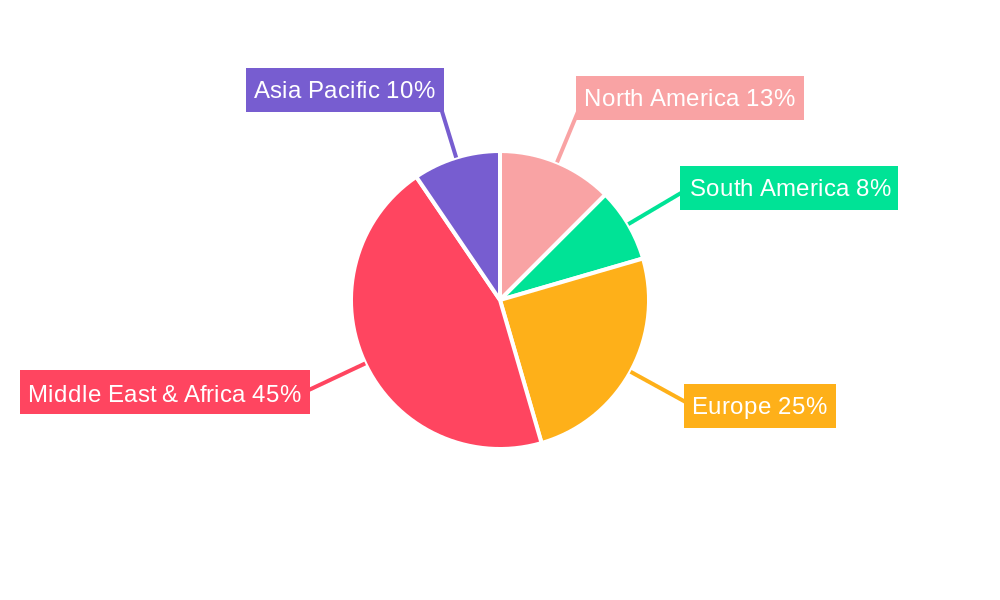
Antimalarial Medication Regional Market Share
Geographic Coverage of Antimalarial Medication
Antimalarial Medication REPORT HIGHLIGHTS
| Aspects | Details |
|---|---|
| Study Period | 2020-2034 |
| Base Year | 2025 |
| Estimated Year | 2026 |
| Forecast Period | 2026-2034 |
| Historical Period | 2020-2025 |
| Growth Rate | CAGR of 13.52% from 2020-2034 |
| Segmentation |
|
Table of Contents
- 1. Introduction
- 1.1. Research Scope
- 1.2. Market Segmentation
- 1.3. Research Objective
- 1.4. Definitions and Assumptions
- 2. Executive Summary
- 2.1. Market Snapshot
- 3. Market Dynamics
- 3.1. Market Drivers
- 3.2. Market Restrains
- 3.3. Market Trends
- 3.4. Market Opportunities
- 4. Market Factor Analysis
- 4.1. Porters Five Forces
- 4.1.1. Bargaining Power of Suppliers
- 4.1.2. Bargaining Power of Buyers
- 4.1.3. Threat of New Entrants
- 4.1.4. Threat of Substitutes
- 4.1.5. Competitive Rivalry
- 4.2. PESTEL analysis
- 4.3. BCG Analysis
- 4.3.1. Stars (High Growth, High Market Share)
- 4.3.2. Cash Cows (Low Growth, High Market Share)
- 4.3.3. Question Mark (High Growth, Low Market Share)
- 4.3.4. Dogs (Low Growth, Low Market Share)
- 4.4. Ansoff Matrix Analysis
- 4.5. Supply Chain Analysis
- 4.6. Regulatory Landscape
- 4.7. Current Market Potential and Opportunity Assessment (TAM–SAM–SOM Framework)
- 4.8. MSR Analyst Note
- 4.1. Porters Five Forces
- 5. Market Analysis, Insights and Forecast 2021-2033
- 5.1. Market Analysis, Insights and Forecast - by Application
- 5.1.1. Hospital Pharmacy
- 5.1.2. Retail Pharmacy
- 5.1.3. E- Commerce
- 5.1.4. Others
- 5.2. Market Analysis, Insights and Forecast - by Types
- 5.2.1. Plasmodium Falciparum
- 5.2.2. Plasmodium Malariae
- 5.2.3. Plasmodium Vivax
- 5.2.4. Plasmodium Ovale
- 5.3. Market Analysis, Insights and Forecast - by Region
- 5.3.1. North America
- 5.3.2. South America
- 5.3.3. Europe
- 5.3.4. Middle East & Africa
- 5.3.5. Asia Pacific
- 5.1. Market Analysis, Insights and Forecast - by Application
- 6. Global Antimalarial Medication Analysis, Insights and Forecast, 2021-2033
- 6.1. Market Analysis, Insights and Forecast - by Application
- 6.1.1. Hospital Pharmacy
- 6.1.2. Retail Pharmacy
- 6.1.3. E- Commerce
- 6.1.4. Others
- 6.2. Market Analysis, Insights and Forecast - by Types
- 6.2.1. Plasmodium Falciparum
- 6.2.2. Plasmodium Malariae
- 6.2.3. Plasmodium Vivax
- 6.2.4. Plasmodium Ovale
- 6.1. Market Analysis, Insights and Forecast - by Application
- 7. North America Antimalarial Medication Analysis, Insights and Forecast, 2020-2032
- 7.1. Market Analysis, Insights and Forecast - by Application
- 7.1.1. Hospital Pharmacy
- 7.1.2. Retail Pharmacy
- 7.1.3. E- Commerce
- 7.1.4. Others
- 7.2. Market Analysis, Insights and Forecast - by Types
- 7.2.1. Plasmodium Falciparum
- 7.2.2. Plasmodium Malariae
- 7.2.3. Plasmodium Vivax
- 7.2.4. Plasmodium Ovale
- 7.1. Market Analysis, Insights and Forecast - by Application
- 8. South America Antimalarial Medication Analysis, Insights and Forecast, 2020-2032
- 8.1. Market Analysis, Insights and Forecast - by Application
- 8.1.1. Hospital Pharmacy
- 8.1.2. Retail Pharmacy
- 8.1.3. E- Commerce
- 8.1.4. Others
- 8.2. Market Analysis, Insights and Forecast - by Types
- 8.2.1. Plasmodium Falciparum
- 8.2.2. Plasmodium Malariae
- 8.2.3. Plasmodium Vivax
- 8.2.4. Plasmodium Ovale
- 8.1. Market Analysis, Insights and Forecast - by Application
- 9. Europe Antimalarial Medication Analysis, Insights and Forecast, 2020-2032
- 9.1. Market Analysis, Insights and Forecast - by Application
- 9.1.1. Hospital Pharmacy
- 9.1.2. Retail Pharmacy
- 9.1.3. E- Commerce
- 9.1.4. Others
- 9.2. Market Analysis, Insights and Forecast - by Types
- 9.2.1. Plasmodium Falciparum
- 9.2.2. Plasmodium Malariae
- 9.2.3. Plasmodium Vivax
- 9.2.4. Plasmodium Ovale
- 9.1. Market Analysis, Insights and Forecast - by Application
- 10. Middle East & Africa Antimalarial Medication Analysis, Insights and Forecast, 2020-2032
- 10.1. Market Analysis, Insights and Forecast - by Application
- 10.1.1. Hospital Pharmacy
- 10.1.2. Retail Pharmacy
- 10.1.3. E- Commerce
- 10.1.4. Others
- 10.2. Market Analysis, Insights and Forecast - by Types
- 10.2.1. Plasmodium Falciparum
- 10.2.2. Plasmodium Malariae
- 10.2.3. Plasmodium Vivax
- 10.2.4. Plasmodium Ovale
- 10.1. Market Analysis, Insights and Forecast - by Application
- 11. Asia Pacific Antimalarial Medication Analysis, Insights and Forecast, 2020-2032
- 11.1. Market Analysis, Insights and Forecast - by Application
- 11.1.1. Hospital Pharmacy
- 11.1.2. Retail Pharmacy
- 11.1.3. E- Commerce
- 11.1.4. Others
- 11.2. Market Analysis, Insights and Forecast - by Types
- 11.2.1. Plasmodium Falciparum
- 11.2.2. Plasmodium Malariae
- 11.2.3. Plasmodium Vivax
- 11.2.4. Plasmodium Ovale
- 11.1. Market Analysis, Insights and Forecast - by Application
- 12. Competitive Analysis
- 12.1. Company Profiles
- 12.1.1 GlaxoSmithKline
- 12.1.1.1. Company Overview
- 12.1.1.2. Products
- 12.1.1.3. Company Financials
- 12.1.1.4. SWOT Analysis
- 12.1.2 F. Hoffmann-La Roche
- 12.1.2.1. Company Overview
- 12.1.2.2. Products
- 12.1.2.3. Company Financials
- 12.1.2.4. SWOT Analysis
- 12.1.3 Novartis
- 12.1.3.1. Company Overview
- 12.1.3.2. Products
- 12.1.3.3. Company Financials
- 12.1.3.4. SWOT Analysis
- 12.1.4 Pfizer
- 12.1.4.1. Company Overview
- 12.1.4.2. Products
- 12.1.4.3. Company Financials
- 12.1.4.4. SWOT Analysis
- 12.1.5 Sun Pharmaceutical Industries
- 12.1.5.1. Company Overview
- 12.1.5.2. Products
- 12.1.5.3. Company Financials
- 12.1.5.4. SWOT Analysis
- 12.1.6 Merck
- 12.1.6.1. Company Overview
- 12.1.6.2. Products
- 12.1.6.3. Company Financials
- 12.1.6.4. SWOT Analysis
- 12.1.1 GlaxoSmithKline
- 12.2. Market Entropy
- 12.2.1 Company's Key Areas Served
- 12.2.2 Recent Developments
- 12.3. Company Market Share Analysis 2025
- 12.3.1 Top 5 Companies Market Share Analysis
- 12.3.2 Top 3 Companies Market Share Analysis
- 12.4. List of Potential Customers
- 13. Research Methodology
List of Figures
- Figure 1: Global Antimalarial Medication Revenue Breakdown (undefined, %) by Region 2025 & 2033
- Figure 2: Global Antimalarial Medication Volume Breakdown (K, %) by Region 2025 & 2033
- Figure 3: North America Antimalarial Medication Revenue (undefined), by Application 2025 & 2033
- Figure 4: North America Antimalarial Medication Volume (K), by Application 2025 & 2033
- Figure 5: North America Antimalarial Medication Revenue Share (%), by Application 2025 & 2033
- Figure 6: North America Antimalarial Medication Volume Share (%), by Application 2025 & 2033
- Figure 7: North America Antimalarial Medication Revenue (undefined), by Types 2025 & 2033
- Figure 8: North America Antimalarial Medication Volume (K), by Types 2025 & 2033
- Figure 9: North America Antimalarial Medication Revenue Share (%), by Types 2025 & 2033
- Figure 10: North America Antimalarial Medication Volume Share (%), by Types 2025 & 2033
- Figure 11: North America Antimalarial Medication Revenue (undefined), by Country 2025 & 2033
- Figure 12: North America Antimalarial Medication Volume (K), by Country 2025 & 2033
- Figure 13: North America Antimalarial Medication Revenue Share (%), by Country 2025 & 2033
- Figure 14: North America Antimalarial Medication Volume Share (%), by Country 2025 & 2033
- Figure 15: South America Antimalarial Medication Revenue (undefined), by Application 2025 & 2033
- Figure 16: South America Antimalarial Medication Volume (K), by Application 2025 & 2033
- Figure 17: South America Antimalarial Medication Revenue Share (%), by Application 2025 & 2033
- Figure 18: South America Antimalarial Medication Volume Share (%), by Application 2025 & 2033
- Figure 19: South America Antimalarial Medication Revenue (undefined), by Types 2025 & 2033
- Figure 20: South America Antimalarial Medication Volume (K), by Types 2025 & 2033
- Figure 21: South America Antimalarial Medication Revenue Share (%), by Types 2025 & 2033
- Figure 22: South America Antimalarial Medication Volume Share (%), by Types 2025 & 2033
- Figure 23: South America Antimalarial Medication Revenue (undefined), by Country 2025 & 2033
- Figure 24: South America Antimalarial Medication Volume (K), by Country 2025 & 2033
- Figure 25: South America Antimalarial Medication Revenue Share (%), by Country 2025 & 2033
- Figure 26: South America Antimalarial Medication Volume Share (%), by Country 2025 & 2033
- Figure 27: Europe Antimalarial Medication Revenue (undefined), by Application 2025 & 2033
- Figure 28: Europe Antimalarial Medication Volume (K), by Application 2025 & 2033
- Figure 29: Europe Antimalarial Medication Revenue Share (%), by Application 2025 & 2033
- Figure 30: Europe Antimalarial Medication Volume Share (%), by Application 2025 & 2033
- Figure 31: Europe Antimalarial Medication Revenue (undefined), by Types 2025 & 2033
- Figure 32: Europe Antimalarial Medication Volume (K), by Types 2025 & 2033
- Figure 33: Europe Antimalarial Medication Revenue Share (%), by Types 2025 & 2033
- Figure 34: Europe Antimalarial Medication Volume Share (%), by Types 2025 & 2033
- Figure 35: Europe Antimalarial Medication Revenue (undefined), by Country 2025 & 2033
- Figure 36: Europe Antimalarial Medication Volume (K), by Country 2025 & 2033
- Figure 37: Europe Antimalarial Medication Revenue Share (%), by Country 2025 & 2033
- Figure 38: Europe Antimalarial Medication Volume Share (%), by Country 2025 & 2033
- Figure 39: Middle East & Africa Antimalarial Medication Revenue (undefined), by Application 2025 & 2033
- Figure 40: Middle East & Africa Antimalarial Medication Volume (K), by Application 2025 & 2033
- Figure 41: Middle East & Africa Antimalarial Medication Revenue Share (%), by Application 2025 & 2033
- Figure 42: Middle East & Africa Antimalarial Medication Volume Share (%), by Application 2025 & 2033
- Figure 43: Middle East & Africa Antimalarial Medication Revenue (undefined), by Types 2025 & 2033
- Figure 44: Middle East & Africa Antimalarial Medication Volume (K), by Types 2025 & 2033
- Figure 45: Middle East & Africa Antimalarial Medication Revenue Share (%), by Types 2025 & 2033
- Figure 46: Middle East & Africa Antimalarial Medication Volume Share (%), by Types 2025 & 2033
- Figure 47: Middle East & Africa Antimalarial Medication Revenue (undefined), by Country 2025 & 2033
- Figure 48: Middle East & Africa Antimalarial Medication Volume (K), by Country 2025 & 2033
- Figure 49: Middle East & Africa Antimalarial Medication Revenue Share (%), by Country 2025 & 2033
- Figure 50: Middle East & Africa Antimalarial Medication Volume Share (%), by Country 2025 & 2033
- Figure 51: Asia Pacific Antimalarial Medication Revenue (undefined), by Application 2025 & 2033
- Figure 52: Asia Pacific Antimalarial Medication Volume (K), by Application 2025 & 2033
- Figure 53: Asia Pacific Antimalarial Medication Revenue Share (%), by Application 2025 & 2033
- Figure 54: Asia Pacific Antimalarial Medication Volume Share (%), by Application 2025 & 2033
- Figure 55: Asia Pacific Antimalarial Medication Revenue (undefined), by Types 2025 & 2033
- Figure 56: Asia Pacific Antimalarial Medication Volume (K), by Types 2025 & 2033
- Figure 57: Asia Pacific Antimalarial Medication Revenue Share (%), by Types 2025 & 2033
- Figure 58: Asia Pacific Antimalarial Medication Volume Share (%), by Types 2025 & 2033
- Figure 59: Asia Pacific Antimalarial Medication Revenue (undefined), by Country 2025 & 2033
- Figure 60: Asia Pacific Antimalarial Medication Volume (K), by Country 2025 & 2033
- Figure 61: Asia Pacific Antimalarial Medication Revenue Share (%), by Country 2025 & 2033
- Figure 62: Asia Pacific Antimalarial Medication Volume Share (%), by Country 2025 & 2033
List of Tables
- Table 1: Global Antimalarial Medication Revenue undefined Forecast, by Application 2020 & 2033
- Table 2: Global Antimalarial Medication Volume K Forecast, by Application 2020 & 2033
- Table 3: Global Antimalarial Medication Revenue undefined Forecast, by Types 2020 & 2033
- Table 4: Global Antimalarial Medication Volume K Forecast, by Types 2020 & 2033
- Table 5: Global Antimalarial Medication Revenue undefined Forecast, by Region 2020 & 2033
- Table 6: Global Antimalarial Medication Volume K Forecast, by Region 2020 & 2033
- Table 7: Global Antimalarial Medication Revenue undefined Forecast, by Application 2020 & 2033
- Table 8: Global Antimalarial Medication Volume K Forecast, by Application 2020 & 2033
- Table 9: Global Antimalarial Medication Revenue undefined Forecast, by Types 2020 & 2033
- Table 10: Global Antimalarial Medication Volume K Forecast, by Types 2020 & 2033
- Table 11: Global Antimalarial Medication Revenue undefined Forecast, by Country 2020 & 2033
- Table 12: Global Antimalarial Medication Volume K Forecast, by Country 2020 & 2033
- Table 13: United States Antimalarial Medication Revenue (undefined) Forecast, by Application 2020 & 2033
- Table 14: United States Antimalarial Medication Volume (K) Forecast, by Application 2020 & 2033
- Table 15: Canada Antimalarial Medication Revenue (undefined) Forecast, by Application 2020 & 2033
- Table 16: Canada Antimalarial Medication Volume (K) Forecast, by Application 2020 & 2033
- Table 17: Mexico Antimalarial Medication Revenue (undefined) Forecast, by Application 2020 & 2033
- Table 18: Mexico Antimalarial Medication Volume (K) Forecast, by Application 2020 & 2033
- Table 19: Global Antimalarial Medication Revenue undefined Forecast, by Application 2020 & 2033
- Table 20: Global Antimalarial Medication Volume K Forecast, by Application 2020 & 2033
- Table 21: Global Antimalarial Medication Revenue undefined Forecast, by Types 2020 & 2033
- Table 22: Global Antimalarial Medication Volume K Forecast, by Types 2020 & 2033
- Table 23: Global Antimalarial Medication Revenue undefined Forecast, by Country 2020 & 2033
- Table 24: Global Antimalarial Medication Volume K Forecast, by Country 2020 & 2033
- Table 25: Brazil Antimalarial Medication Revenue (undefined) Forecast, by Application 2020 & 2033
- Table 26: Brazil Antimalarial Medication Volume (K) Forecast, by Application 2020 & 2033
- Table 27: Argentina Antimalarial Medication Revenue (undefined) Forecast, by Application 2020 & 2033
- Table 28: Argentina Antimalarial Medication Volume (K) Forecast, by Application 2020 & 2033
- Table 29: Rest of South America Antimalarial Medication Revenue (undefined) Forecast, by Application 2020 & 2033
- Table 30: Rest of South America Antimalarial Medication Volume (K) Forecast, by Application 2020 & 2033
- Table 31: Global Antimalarial Medication Revenue undefined Forecast, by Application 2020 & 2033
- Table 32: Global Antimalarial Medication Volume K Forecast, by Application 2020 & 2033
- Table 33: Global Antimalarial Medication Revenue undefined Forecast, by Types 2020 & 2033
- Table 34: Global Antimalarial Medication Volume K Forecast, by Types 2020 & 2033
- Table 35: Global Antimalarial Medication Revenue undefined Forecast, by Country 2020 & 2033
- Table 36: Global Antimalarial Medication Volume K Forecast, by Country 2020 & 2033
- Table 37: United Kingdom Antimalarial Medication Revenue (undefined) Forecast, by Application 2020 & 2033
- Table 38: United Kingdom Antimalarial Medication Volume (K) Forecast, by Application 2020 & 2033
- Table 39: Germany Antimalarial Medication Revenue (undefined) Forecast, by Application 2020 & 2033
- Table 40: Germany Antimalarial Medication Volume (K) Forecast, by Application 2020 & 2033
- Table 41: France Antimalarial Medication Revenue (undefined) Forecast, by Application 2020 & 2033
- Table 42: France Antimalarial Medication Volume (K) Forecast, by Application 2020 & 2033
- Table 43: Italy Antimalarial Medication Revenue (undefined) Forecast, by Application 2020 & 2033
- Table 44: Italy Antimalarial Medication Volume (K) Forecast, by Application 2020 & 2033
- Table 45: Spain Antimalarial Medication Revenue (undefined) Forecast, by Application 2020 & 2033
- Table 46: Spain Antimalarial Medication Volume (K) Forecast, by Application 2020 & 2033
- Table 47: Russia Antimalarial Medication Revenue (undefined) Forecast, by Application 2020 & 2033
- Table 48: Russia Antimalarial Medication Volume (K) Forecast, by Application 2020 & 2033
- Table 49: Benelux Antimalarial Medication Revenue (undefined) Forecast, by Application 2020 & 2033
- Table 50: Benelux Antimalarial Medication Volume (K) Forecast, by Application 2020 & 2033
- Table 51: Nordics Antimalarial Medication Revenue (undefined) Forecast, by Application 2020 & 2033
- Table 52: Nordics Antimalarial Medication Volume (K) Forecast, by Application 2020 & 2033
- Table 53: Rest of Europe Antimalarial Medication Revenue (undefined) Forecast, by Application 2020 & 2033
- Table 54: Rest of Europe Antimalarial Medication Volume (K) Forecast, by Application 2020 & 2033
- Table 55: Global Antimalarial Medication Revenue undefined Forecast, by Application 2020 & 2033
- Table 56: Global Antimalarial Medication Volume K Forecast, by Application 2020 & 2033
- Table 57: Global Antimalarial Medication Revenue undefined Forecast, by Types 2020 & 2033
- Table 58: Global Antimalarial Medication Volume K Forecast, by Types 2020 & 2033
- Table 59: Global Antimalarial Medication Revenue undefined Forecast, by Country 2020 & 2033
- Table 60: Global Antimalarial Medication Volume K Forecast, by Country 2020 & 2033
- Table 61: Turkey Antimalarial Medication Revenue (undefined) Forecast, by Application 2020 & 2033
- Table 62: Turkey Antimalarial Medication Volume (K) Forecast, by Application 2020 & 2033
- Table 63: Israel Antimalarial Medication Revenue (undefined) Forecast, by Application 2020 & 2033
- Table 64: Israel Antimalarial Medication Volume (K) Forecast, by Application 2020 & 2033
- Table 65: GCC Antimalarial Medication Revenue (undefined) Forecast, by Application 2020 & 2033
- Table 66: GCC Antimalarial Medication Volume (K) Forecast, by Application 2020 & 2033
- Table 67: North Africa Antimalarial Medication Revenue (undefined) Forecast, by Application 2020 & 2033
- Table 68: North Africa Antimalarial Medication Volume (K) Forecast, by Application 2020 & 2033
- Table 69: South Africa Antimalarial Medication Revenue (undefined) Forecast, by Application 2020 & 2033
- Table 70: South Africa Antimalarial Medication Volume (K) Forecast, by Application 2020 & 2033
- Table 71: Rest of Middle East & Africa Antimalarial Medication Revenue (undefined) Forecast, by Application 2020 & 2033
- Table 72: Rest of Middle East & Africa Antimalarial Medication Volume (K) Forecast, by Application 2020 & 2033
- Table 73: Global Antimalarial Medication Revenue undefined Forecast, by Application 2020 & 2033
- Table 74: Global Antimalarial Medication Volume K Forecast, by Application 2020 & 2033
- Table 75: Global Antimalarial Medication Revenue undefined Forecast, by Types 2020 & 2033
- Table 76: Global Antimalarial Medication Volume K Forecast, by Types 2020 & 2033
- Table 77: Global Antimalarial Medication Revenue undefined Forecast, by Country 2020 & 2033
- Table 78: Global Antimalarial Medication Volume K Forecast, by Country 2020 & 2033
- Table 79: China Antimalarial Medication Revenue (undefined) Forecast, by Application 2020 & 2033
- Table 80: China Antimalarial Medication Volume (K) Forecast, by Application 2020 & 2033
- Table 81: India Antimalarial Medication Revenue (undefined) Forecast, by Application 2020 & 2033
- Table 82: India Antimalarial Medication Volume (K) Forecast, by Application 2020 & 2033
- Table 83: Japan Antimalarial Medication Revenue (undefined) Forecast, by Application 2020 & 2033
- Table 84: Japan Antimalarial Medication Volume (K) Forecast, by Application 2020 & 2033
- Table 85: South Korea Antimalarial Medication Revenue (undefined) Forecast, by Application 2020 & 2033
- Table 86: South Korea Antimalarial Medication Volume (K) Forecast, by Application 2020 & 2033
- Table 87: ASEAN Antimalarial Medication Revenue (undefined) Forecast, by Application 2020 & 2033
- Table 88: ASEAN Antimalarial Medication Volume (K) Forecast, by Application 2020 & 2033
- Table 89: Oceania Antimalarial Medication Revenue (undefined) Forecast, by Application 2020 & 2033
- Table 90: Oceania Antimalarial Medication Volume (K) Forecast, by Application 2020 & 2033
- Table 91: Rest of Asia Pacific Antimalarial Medication Revenue (undefined) Forecast, by Application 2020 & 2033
- Table 92: Rest of Asia Pacific Antimalarial Medication Volume (K) Forecast, by Application 2020 & 2033
Frequently Asked Questions
1. What is the projected Compound Annual Growth Rate (CAGR) of the Antimalarial Medication?
The projected CAGR is approximately 13.52%.
2. Which companies are prominent players in the Antimalarial Medication?
Key companies in the market include GlaxoSmithKline, F. Hoffmann-La Roche, Novartis, Pfizer, Sun Pharmaceutical Industries, Merck.
3. What are the main segments of the Antimalarial Medication?
The market segments include Application, Types.
4. Can you provide details about the market size?
The market size is estimated to be USD XXX N/A as of 2022.
5. What are some drivers contributing to market growth?
N/A
6. What are the notable trends driving market growth?
N/A
7. Are there any restraints impacting market growth?
N/A
8. Can you provide examples of recent developments in the market?
N/A
9. What pricing options are available for accessing the report?
Pricing options include single-user, multi-user, and enterprise licenses priced at USD 3350.00, USD 5025.00, and USD 6700.00 respectively.
10. Is the market size provided in terms of value or volume?
The market size is provided in terms of value, measured in N/A and volume, measured in K.
11. Are there any specific market keywords associated with the report?
Yes, the market keyword associated with the report is "Antimalarial Medication," which aids in identifying and referencing the specific market segment covered.
12. How do I determine which pricing option suits my needs best?
The pricing options vary based on user requirements and access needs. Individual users may opt for single-user licenses, while businesses requiring broader access may choose multi-user or enterprise licenses for cost-effective access to the report.
13. Are there any additional resources or data provided in the Antimalarial Medication report?
While the report offers comprehensive insights, it's advisable to review the specific contents or supplementary materials provided to ascertain if additional resources or data are available.
14. How can I stay updated on further developments or reports in the Antimalarial Medication?
To stay informed about further developments, trends, and reports in the Antimalarial Medication, consider subscribing to industry newsletters, following relevant companies and organizations, or regularly checking reputable industry news sources and publications.
Methodology
Step 1 - Identification of Relevant Samples Size from Population Database


Step 2 - Approaches for Defining Global Market Size (Value, Volume* & Price*)

Note*: In applicable scenarios
Step 3 - Data Sources
Primary Research
- Web Analytics
- Survey Reports
- Research Institute
- Latest Research Reports
- Opinion Leaders
Secondary Research
- Annual Reports
- White Paper
- Latest Press Release
- Industry Association
- Paid Database
- Investor Presentations

Step 4 - Data Triangulation
Involves using different sources of information in order to increase the validity of a study
These sources are likely to be stakeholders in a program - participants, other researchers, program staff, other community members, and so on.
Then we put all data in single framework & apply various statistical tools to find out the dynamic on the market.
During the analysis stage, feedback from the stakeholder groups would be compared to determine areas of agreement as well as areas of divergence