

Key Insights
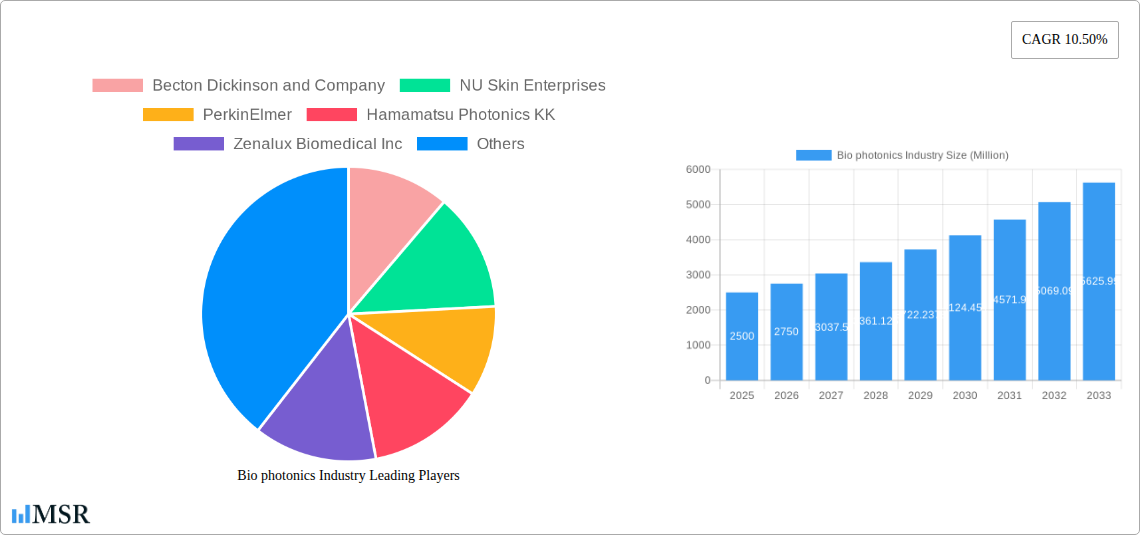
The global biophotonics market is projected to reach $76.1 billion by 2033, expanding at a Compound Annual Growth Rate (CAGR) of 11.3% from a base year of 2024. This growth is propelled by innovations in medical imaging, including surface, internal, and transparent imaging technologies, enhancing diagnostic accuracy and minimally invasive procedures. The increasing global incidence of chronic diseases drives demand for advanced biophotonic diagnostic solutions, while the integration of biosensors and medical lasers in therapeutic applications further fuels market expansion. Emerging microscopy techniques and spectromolecular imaging enhance diagnostic precision and treatment efficacy, opening new market avenues. Despite challenges from regulatory complexities and high initial investments, the market exhibits a positive trajectory, supported by continuous technological progress and rising healthcare expenditure. North America currently leads the market due to its advanced healthcare infrastructure and rapid technology adoption. However, the Asia-Pacific region is expected to witness significant growth, driven by escalating healthcare investments and R&D activities. Leading companies such as Becton Dickinson, NU Skin Enterprises, PerkinElmer, and Thermo Fisher Scientific are actively pursuing R&D and strategic acquisitions to solidify their market positions.
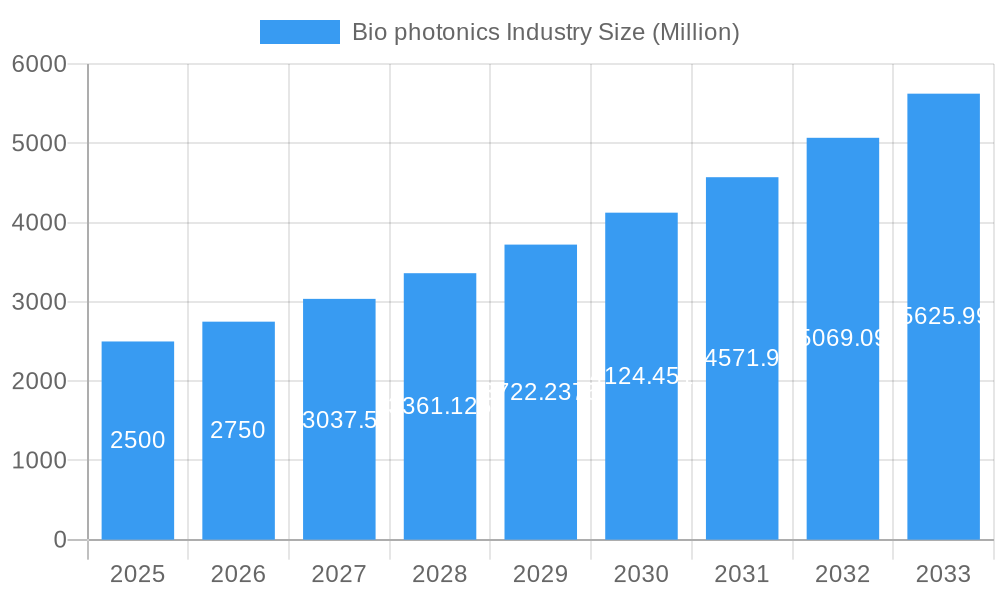
Bio photonics Industry Market Size (In Billion)
The biophotonics market segmentation by technology reveals diverse applications. Surface imaging, utilizing techniques like Optical Coherence Tomography (OCT) and fluorescence imaging, currently leads the market, primarily for dermatological and ophthalmological applications. Internal imaging techniques, including endoscopy and confocal microscopy, are vital for minimally invasive surgery and are experiencing substantial growth. Transparent imaging, enabling non-invasive visualization of internal structures, is a rapidly advancing segment with significant future potential. Microscopy, fundamental to biological research, continues to drive progress in drug discovery and disease comprehension. The incorporation of biosensors and medical lasers in treatment modalities is also a key contributor to market growth. The competitive environment features a blend of established corporations and agile startups, fostering ongoing innovation and market development throughout the forecast period of 2024-2033.
Bio photonics Industry Company Market Share
Biophotonics Industry Market Report: 2019-2033
This comprehensive report provides an in-depth analysis of the biophotonics industry, encompassing market size, growth drivers, key players, and future trends. With a study period spanning 2019-2033, a base year of 2025, and a forecast period of 2025-2033, this report offers actionable insights for stakeholders across the biophotonics value chain. The global biophotonics market is projected to reach xx Million by 2033, exhibiting a CAGR of xx% during the forecast period.
Biophotonics Industry Market Concentration & Dynamics
The biophotonics market exhibits a moderately concentrated structure, with several key players holding significant market share. Market share analysis reveals that the top five companies collectively account for approximately xx% of the global market in 2025. However, the presence of numerous smaller, specialized players contributes to a dynamic competitive landscape.
- Market Concentration: High, with top 5 players accounting for xx% market share (2025).
- Innovation Ecosystems: Strong collaboration between academia, research institutions, and industry players fuels innovation, particularly in areas like microscopy and biosensors.
- Regulatory Frameworks: Stringent regulations regarding medical device approvals influence market entry and product development timelines. Compliance costs can be significant.
- Substitute Products: Competition comes from alternative diagnostic and therapeutic techniques, impacting market growth for certain biophotonics applications.
- End-User Trends: Increasing demand for minimally invasive procedures and personalized medicine is driving growth in medical applications. Research and development activities in life sciences also heavily influence demand.
- M&A Activities: The number of M&A deals in the biophotonics industry reached xx in 2024, indicating consolidation and strategic expansion by major players. This number is expected to reach xx by 2033.
Biophotonics Industry Insights & Trends
The biophotonics market is experiencing robust growth, driven by factors such as technological advancements, increasing healthcare spending, and the rising prevalence of chronic diseases. The market size was valued at xx Million in 2024 and is projected to reach xx Million by 2033, exhibiting a CAGR of xx%. This significant expansion reflects an increasing demand for advanced diagnostic and therapeutic tools in diverse applications, including medical imaging, drug discovery, and environmental monitoring. Technological disruptions, particularly in areas such as AI-driven image analysis and miniaturized devices, are reshaping market dynamics. Consumer behavior reflects a growing preference for faster, more accurate, and less invasive diagnostic tools, further fueling market growth.
Key Markets & Segments Leading Biophotonics Industry
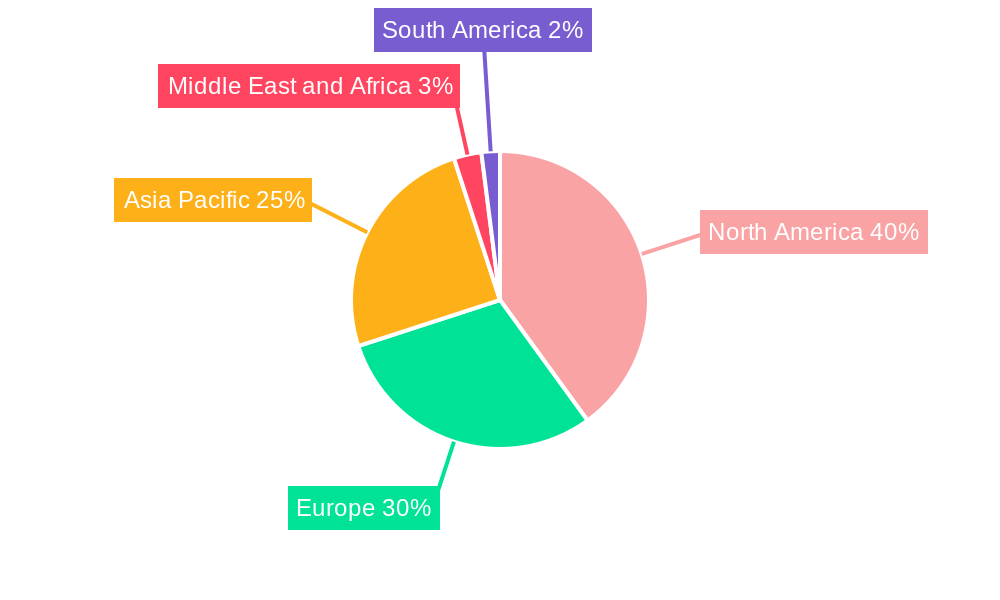
The North American region dominates the global biophotonics market, followed by Europe and Asia Pacific. This dominance is attributed to factors like robust healthcare infrastructure, significant R&D investments, and a high concentration of key players.
Dominant Segment (by Technology): Microscopy, driven by significant advancements in resolution and imaging techniques, holds the largest market share in 2025, valued at approximately xx Million.
Drivers:
- North America: Strong healthcare infrastructure, high R&D spending, early adoption of advanced technologies.
- Europe: Significant investments in life sciences research, presence of established biophotonics companies.
- Asia Pacific: Rapidly growing healthcare sector, increasing disposable income, government initiatives promoting medical technology adoption.
Detailed Dominance Analysis: The microscopy segment's dominance stems from its widespread use in various applications, including disease diagnosis, drug development, and materials science. The continuous development of advanced microscopy techniques, such as super-resolution microscopy, is further fueling its growth. The medical lasers and biosensors segments are also experiencing significant growth due to their increasing adoption in minimally invasive surgeries and point-of-care diagnostics, respectively.
Biophotonics Industry Product Developments
Recent years have witnessed significant product innovations in the biophotonics industry. Advancements in laser technology, imaging sensors, and data analysis algorithms have led to the development of more compact, efficient, and user-friendly devices. These innovations have expanded the applications of biophotonics across various fields, improving diagnostic capabilities, treatment efficacy, and overall patient care. The emergence of AI-powered image analysis tools is revolutionizing diagnostics and increasing accuracy and speed. This ongoing technological evolution contributes to heightened competitiveness and creates new market opportunities.
Challenges in the Biophotonics Industry Market
Several challenges hinder the growth of the biophotonics market. Stringent regulatory approvals for medical devices create significant hurdles and extend time-to-market. The complex supply chains involved in manufacturing biophotonics components, along with potential material shortages, can impact production costs and availability. High initial investment costs associated with some biophotonics technologies limit market access, particularly in developing economies. Intense competition among established players and emerging startups further complicates market dynamics.
Forces Driving Biophotonics Industry Growth
Several factors drive the growth of the biophotonics market. Technological advancements, particularly in areas such as super-resolution microscopy and optical coherence tomography, continuously enhance capabilities. The increasing prevalence of chronic diseases and growing demand for accurate diagnostic tools contribute to market expansion. Supportive government policies and initiatives aimed at promoting medical technology innovation and adoption further encourage market growth.
Long-Term Growth Catalysts in the Biophotonics Industry Market
Long-term growth is expected to be fueled by strategic partnerships and collaborations between technology providers and healthcare institutions. The ongoing development of novel biophotonics-based therapies and diagnostic tools will also play a crucial role in fostering long-term market expansion. Investments in research and development focused on miniaturization, improved portability, and enhanced data processing capabilities will further stimulate market growth.
Emerging Opportunities in Biophotonics Industry
Emerging opportunities include the development of personalized medicine tools, advanced biosensors for early disease detection, and portable diagnostic devices. Expansion into emerging markets with growing healthcare needs presents significant growth potential. Integration of biophotonics with other technologies, such as artificial intelligence and nanotechnology, promises exciting new applications and market opportunities.
Leading Players in the Biophotonics Industry Sector
- Becton Dickinson and Company
- NU Skin Enterprises
- PerkinElmer
- Hamamatsu Photonics KK
- Zenalux Biomedical Inc
- Glenbrook Technologies
- Oxford Instruments PLC
- Carl Zeiss AG
- Olympus Corporation
- Thermo Fisher Scientific
Key Milestones in Biophotonics Industry
- March 2021: Carl Zeiss AG invested USD 180 Million in a new North American research, development, production, sales, and customer service center, expanding its presence and capabilities in X-ray microscopy and other applications.
- November 2021: Oxford Instruments launched the BC43, a compact microscopy device enabling real-time 3D imaging.
Strategic Outlook for Biophotonics Industry Market
The biophotonics market is poised for significant expansion, driven by continued technological advancements, increasing healthcare spending, and a growing demand for improved diagnostic and therapeutic tools. Strategic opportunities exist for companies focusing on innovation in miniaturization, AI integration, and the development of novel applications across various sectors. Partnerships and collaborations will be crucial for navigating regulatory hurdles and accelerating market penetration. The market is projected to witness substantial growth in the coming years, offering promising returns for investors and industry participants.
Bio photonics Industry Segmentation
-
1. Technology
- 1.1. Surface Imaging
- 1.2. Inside Imaging
- 1.3. See-through Imaging
- 1.4. Microscopy
- 1.5. Biosensors
- 1.6. Medical Lasers
- 1.7. Spectromolecular
- 1.8. Other Technologies
-
2. Application
- 2.1. Medical Diagnostics
- 2.2. Drug Discovery
- 2.3. Medical Research
- 2.4. Biotechnology
- 2.5. Environmental Monitoring
Bio photonics Industry Segmentation By Geography
-
1. North America
- 1.1. United States
- 1.2. Canada
- 1.3. Mexico
-
2. Europe
- 2.1. Germany
- 2.2. United Kingdom
- 2.3. France
- 2.4. Italy
- 2.5. Spain
- 2.6. Rest of Europe
-
3. Asia Pacific
- 3.1. China
- 3.2. Japan
- 3.3. India
- 3.4. Australia
- 3.5. South Korea
- 3.6. Rest of Asia Pacific
-
4. Middle East and Africa
- 4.1. GCC
- 4.2. South Africa
- 4.3. Rest of Middle East and Africa
-
5. South America
- 5.1. Brazil
- 5.2. Argentina
- 5.3. Rest of South America
Bio photonics Industry Regional Market Share
Geographic Coverage of Bio photonics Industry
Bio photonics Industry REPORT HIGHLIGHTS
| Aspects | Details |
|---|---|
| Study Period | 2020-2034 |
| Base Year | 2025 |
| Estimated Year | 2026 |
| Forecast Period | 2026-2034 |
| Historical Period | 2020-2025 |
| Growth Rate | CAGR of 11.3% from 2020-2034 |
| Segmentation |
|
Table of Contents
- 1. Introduction
- 1.1. Research Scope
- 1.2. Market Segmentation
- 1.3. Research Objective
- 1.4. Definitions and Assumptions
- 2. Executive Summary
- 2.1. Market Snapshot
- 3. Market Dynamics
- 3.1. Market Drivers
- 3.2. Market Restrains
- 3.3. Market Trends
- 3.4. Market Opportunities
- 4. Market Factor Analysis
- 4.1. Porters Five Forces
- 4.1.1. Bargaining Power of Suppliers
- 4.1.2. Bargaining Power of Buyers
- 4.1.3. Threat of New Entrants
- 4.1.4. Threat of Substitutes
- 4.1.5. Competitive Rivalry
- 4.2. PESTEL analysis
- 4.3. BCG Analysis
- 4.3.1. Stars (High Growth, High Market Share)
- 4.3.2. Cash Cows (Low Growth, High Market Share)
- 4.3.3. Question Mark (High Growth, Low Market Share)
- 4.3.4. Dogs (Low Growth, Low Market Share)
- 4.4. Ansoff Matrix Analysis
- 4.5. Supply Chain Analysis
- 4.6. Regulatory Landscape
- 4.7. Current Market Potential and Opportunity Assessment (TAM–SAM–SOM Framework)
- 4.8. MSR Analyst Note
- 4.1. Porters Five Forces
- 5. Market Analysis, Insights and Forecast 2021-2033
- 5.1. Market Analysis, Insights and Forecast - by Technology
- 5.1.1. Surface Imaging
- 5.1.2. Inside Imaging
- 5.1.3. See-through Imaging
- 5.1.4. Microscopy
- 5.1.5. Biosensors
- 5.1.6. Medical Lasers
- 5.1.7. Spectromolecular
- 5.1.8. Other Technologies
- 5.2. Market Analysis, Insights and Forecast - by Application
- 5.2.1. Medical Diagnostics
- 5.2.2. Drug Discovery
- 5.2.3. Medical Research
- 5.2.4. Biotechnology
- 5.2.5. Environmental Monitoring
- 5.3. Market Analysis, Insights and Forecast - by Region
- 5.3.1. North America
- 5.3.2. Europe
- 5.3.3. Asia Pacific
- 5.3.4. Middle East and Africa
- 5.3.5. South America
- 5.1. Market Analysis, Insights and Forecast - by Technology
- 6. Global Bio photonics Industry Analysis, Insights and Forecast, 2021-2033
- 6.1. Market Analysis, Insights and Forecast - by Technology
- 6.1.1. Surface Imaging
- 6.1.2. Inside Imaging
- 6.1.3. See-through Imaging
- 6.1.4. Microscopy
- 6.1.5. Biosensors
- 6.1.6. Medical Lasers
- 6.1.7. Spectromolecular
- 6.1.8. Other Technologies
- 6.2. Market Analysis, Insights and Forecast - by Application
- 6.2.1. Medical Diagnostics
- 6.2.2. Drug Discovery
- 6.2.3. Medical Research
- 6.2.4. Biotechnology
- 6.2.5. Environmental Monitoring
- 6.1. Market Analysis, Insights and Forecast - by Technology
- 7. North America Bio photonics Industry Analysis, Insights and Forecast, 2020-2032
- 7.1. Market Analysis, Insights and Forecast - by Technology
- 7.1.1. Surface Imaging
- 7.1.2. Inside Imaging
- 7.1.3. See-through Imaging
- 7.1.4. Microscopy
- 7.1.5. Biosensors
- 7.1.6. Medical Lasers
- 7.1.7. Spectromolecular
- 7.1.8. Other Technologies
- 7.2. Market Analysis, Insights and Forecast - by Application
- 7.2.1. Medical Diagnostics
- 7.2.2. Drug Discovery
- 7.2.3. Medical Research
- 7.2.4. Biotechnology
- 7.2.5. Environmental Monitoring
- 7.1. Market Analysis, Insights and Forecast - by Technology
- 8. Europe Bio photonics Industry Analysis, Insights and Forecast, 2020-2032
- 8.1. Market Analysis, Insights and Forecast - by Technology
- 8.1.1. Surface Imaging
- 8.1.2. Inside Imaging
- 8.1.3. See-through Imaging
- 8.1.4. Microscopy
- 8.1.5. Biosensors
- 8.1.6. Medical Lasers
- 8.1.7. Spectromolecular
- 8.1.8. Other Technologies
- 8.2. Market Analysis, Insights and Forecast - by Application
- 8.2.1. Medical Diagnostics
- 8.2.2. Drug Discovery
- 8.2.3. Medical Research
- 8.2.4. Biotechnology
- 8.2.5. Environmental Monitoring
- 8.1. Market Analysis, Insights and Forecast - by Technology
- 9. Asia Pacific Bio photonics Industry Analysis, Insights and Forecast, 2020-2032
- 9.1. Market Analysis, Insights and Forecast - by Technology
- 9.1.1. Surface Imaging
- 9.1.2. Inside Imaging
- 9.1.3. See-through Imaging
- 9.1.4. Microscopy
- 9.1.5. Biosensors
- 9.1.6. Medical Lasers
- 9.1.7. Spectromolecular
- 9.1.8. Other Technologies
- 9.2. Market Analysis, Insights and Forecast - by Application
- 9.2.1. Medical Diagnostics
- 9.2.2. Drug Discovery
- 9.2.3. Medical Research
- 9.2.4. Biotechnology
- 9.2.5. Environmental Monitoring
- 9.1. Market Analysis, Insights and Forecast - by Technology
- 10. Middle East and Africa Bio photonics Industry Analysis, Insights and Forecast, 2020-2032
- 10.1. Market Analysis, Insights and Forecast - by Technology
- 10.1.1. Surface Imaging
- 10.1.2. Inside Imaging
- 10.1.3. See-through Imaging
- 10.1.4. Microscopy
- 10.1.5. Biosensors
- 10.1.6. Medical Lasers
- 10.1.7. Spectromolecular
- 10.1.8. Other Technologies
- 10.2. Market Analysis, Insights and Forecast - by Application
- 10.2.1. Medical Diagnostics
- 10.2.2. Drug Discovery
- 10.2.3. Medical Research
- 10.2.4. Biotechnology
- 10.2.5. Environmental Monitoring
- 10.1. Market Analysis, Insights and Forecast - by Technology
- 11. South America Bio photonics Industry Analysis, Insights and Forecast, 2020-2032
- 11.1. Market Analysis, Insights and Forecast - by Technology
- 11.1.1. Surface Imaging
- 11.1.2. Inside Imaging
- 11.1.3. See-through Imaging
- 11.1.4. Microscopy
- 11.1.5. Biosensors
- 11.1.6. Medical Lasers
- 11.1.7. Spectromolecular
- 11.1.8. Other Technologies
- 11.2. Market Analysis, Insights and Forecast - by Application
- 11.2.1. Medical Diagnostics
- 11.2.2. Drug Discovery
- 11.2.3. Medical Research
- 11.2.4. Biotechnology
- 11.2.5. Environmental Monitoring
- 11.1. Market Analysis, Insights and Forecast - by Technology
- 12. Competitive Analysis
- 12.1. Company Profiles
- 12.1.1 Becton Dickinson and Company
- 12.1.1.1. Company Overview
- 12.1.1.2. Products
- 12.1.1.3. Company Financials
- 12.1.1.4. SWOT Analysis
- 12.1.2 NU Skin Enterprises
- 12.1.2.1. Company Overview
- 12.1.2.2. Products
- 12.1.2.3. Company Financials
- 12.1.2.4. SWOT Analysis
- 12.1.3 PerkinElmer
- 12.1.3.1. Company Overview
- 12.1.3.2. Products
- 12.1.3.3. Company Financials
- 12.1.3.4. SWOT Analysis
- 12.1.4 Hamamatsu Photonics KK
- 12.1.4.1. Company Overview
- 12.1.4.2. Products
- 12.1.4.3. Company Financials
- 12.1.4.4. SWOT Analysis
- 12.1.5 Zenalux Biomedical Inc
- 12.1.5.1. Company Overview
- 12.1.5.2. Products
- 12.1.5.3. Company Financials
- 12.1.5.4. SWOT Analysis
- 12.1.6 Glenbrook Technologies
- 12.1.6.1. Company Overview
- 12.1.6.2. Products
- 12.1.6.3. Company Financials
- 12.1.6.4. SWOT Analysis
- 12.1.7 Oxford Instruments PLC
- 12.1.7.1. Company Overview
- 12.1.7.2. Products
- 12.1.7.3. Company Financials
- 12.1.7.4. SWOT Analysis
- 12.1.8 Carl Zeiss AG
- 12.1.8.1. Company Overview
- 12.1.8.2. Products
- 12.1.8.3. Company Financials
- 12.1.8.4. SWOT Analysis
- 12.1.9 Olympus Corporation
- 12.1.9.1. Company Overview
- 12.1.9.2. Products
- 12.1.9.3. Company Financials
- 12.1.9.4. SWOT Analysis
- 12.1.10 Thermo Fisher Scientific
- 12.1.10.1. Company Overview
- 12.1.10.2. Products
- 12.1.10.3. Company Financials
- 12.1.10.4. SWOT Analysis
- 12.1.1 Becton Dickinson and Company
- 12.2. Market Entropy
- 12.2.1 Company's Key Areas Served
- 12.2.2 Recent Developments
- 12.3. Company Market Share Analysis 2025
- 12.3.1 Top 5 Companies Market Share Analysis
- 12.3.2 Top 3 Companies Market Share Analysis
- 12.4. List of Potential Customers
- 13. Research Methodology
List of Figures
- Figure 1: Global Bio photonics Industry Revenue Breakdown (billion, %) by Region 2025 & 2033
- Figure 2: Global Bio photonics Industry Volume Breakdown (K Unit, %) by Region 2025 & 2033
- Figure 3: North America Bio photonics Industry Revenue (billion), by Technology 2025 & 2033
- Figure 4: North America Bio photonics Industry Volume (K Unit), by Technology 2025 & 2033
- Figure 5: North America Bio photonics Industry Revenue Share (%), by Technology 2025 & 2033
- Figure 6: North America Bio photonics Industry Volume Share (%), by Technology 2025 & 2033
- Figure 7: North America Bio photonics Industry Revenue (billion), by Application 2025 & 2033
- Figure 8: North America Bio photonics Industry Volume (K Unit), by Application 2025 & 2033
- Figure 9: North America Bio photonics Industry Revenue Share (%), by Application 2025 & 2033
- Figure 10: North America Bio photonics Industry Volume Share (%), by Application 2025 & 2033
- Figure 11: North America Bio photonics Industry Revenue (billion), by Country 2025 & 2033
- Figure 12: North America Bio photonics Industry Volume (K Unit), by Country 2025 & 2033
- Figure 13: North America Bio photonics Industry Revenue Share (%), by Country 2025 & 2033
- Figure 14: North America Bio photonics Industry Volume Share (%), by Country 2025 & 2033
- Figure 15: Europe Bio photonics Industry Revenue (billion), by Technology 2025 & 2033
- Figure 16: Europe Bio photonics Industry Volume (K Unit), by Technology 2025 & 2033
- Figure 17: Europe Bio photonics Industry Revenue Share (%), by Technology 2025 & 2033
- Figure 18: Europe Bio photonics Industry Volume Share (%), by Technology 2025 & 2033
- Figure 19: Europe Bio photonics Industry Revenue (billion), by Application 2025 & 2033
- Figure 20: Europe Bio photonics Industry Volume (K Unit), by Application 2025 & 2033
- Figure 21: Europe Bio photonics Industry Revenue Share (%), by Application 2025 & 2033
- Figure 22: Europe Bio photonics Industry Volume Share (%), by Application 2025 & 2033
- Figure 23: Europe Bio photonics Industry Revenue (billion), by Country 2025 & 2033
- Figure 24: Europe Bio photonics Industry Volume (K Unit), by Country 2025 & 2033
- Figure 25: Europe Bio photonics Industry Revenue Share (%), by Country 2025 & 2033
- Figure 26: Europe Bio photonics Industry Volume Share (%), by Country 2025 & 2033
- Figure 27: Asia Pacific Bio photonics Industry Revenue (billion), by Technology 2025 & 2033
- Figure 28: Asia Pacific Bio photonics Industry Volume (K Unit), by Technology 2025 & 2033
- Figure 29: Asia Pacific Bio photonics Industry Revenue Share (%), by Technology 2025 & 2033
- Figure 30: Asia Pacific Bio photonics Industry Volume Share (%), by Technology 2025 & 2033
- Figure 31: Asia Pacific Bio photonics Industry Revenue (billion), by Application 2025 & 2033
- Figure 32: Asia Pacific Bio photonics Industry Volume (K Unit), by Application 2025 & 2033
- Figure 33: Asia Pacific Bio photonics Industry Revenue Share (%), by Application 2025 & 2033
- Figure 34: Asia Pacific Bio photonics Industry Volume Share (%), by Application 2025 & 2033
- Figure 35: Asia Pacific Bio photonics Industry Revenue (billion), by Country 2025 & 2033
- Figure 36: Asia Pacific Bio photonics Industry Volume (K Unit), by Country 2025 & 2033
- Figure 37: Asia Pacific Bio photonics Industry Revenue Share (%), by Country 2025 & 2033
- Figure 38: Asia Pacific Bio photonics Industry Volume Share (%), by Country 2025 & 2033
- Figure 39: Middle East and Africa Bio photonics Industry Revenue (billion), by Technology 2025 & 2033
- Figure 40: Middle East and Africa Bio photonics Industry Volume (K Unit), by Technology 2025 & 2033
- Figure 41: Middle East and Africa Bio photonics Industry Revenue Share (%), by Technology 2025 & 2033
- Figure 42: Middle East and Africa Bio photonics Industry Volume Share (%), by Technology 2025 & 2033
- Figure 43: Middle East and Africa Bio photonics Industry Revenue (billion), by Application 2025 & 2033
- Figure 44: Middle East and Africa Bio photonics Industry Volume (K Unit), by Application 2025 & 2033
- Figure 45: Middle East and Africa Bio photonics Industry Revenue Share (%), by Application 2025 & 2033
- Figure 46: Middle East and Africa Bio photonics Industry Volume Share (%), by Application 2025 & 2033
- Figure 47: Middle East and Africa Bio photonics Industry Revenue (billion), by Country 2025 & 2033
- Figure 48: Middle East and Africa Bio photonics Industry Volume (K Unit), by Country 2025 & 2033
- Figure 49: Middle East and Africa Bio photonics Industry Revenue Share (%), by Country 2025 & 2033
- Figure 50: Middle East and Africa Bio photonics Industry Volume Share (%), by Country 2025 & 2033
- Figure 51: South America Bio photonics Industry Revenue (billion), by Technology 2025 & 2033
- Figure 52: South America Bio photonics Industry Volume (K Unit), by Technology 2025 & 2033
- Figure 53: South America Bio photonics Industry Revenue Share (%), by Technology 2025 & 2033
- Figure 54: South America Bio photonics Industry Volume Share (%), by Technology 2025 & 2033
- Figure 55: South America Bio photonics Industry Revenue (billion), by Application 2025 & 2033
- Figure 56: South America Bio photonics Industry Volume (K Unit), by Application 2025 & 2033
- Figure 57: South America Bio photonics Industry Revenue Share (%), by Application 2025 & 2033
- Figure 58: South America Bio photonics Industry Volume Share (%), by Application 2025 & 2033
- Figure 59: South America Bio photonics Industry Revenue (billion), by Country 2025 & 2033
- Figure 60: South America Bio photonics Industry Volume (K Unit), by Country 2025 & 2033
- Figure 61: South America Bio photonics Industry Revenue Share (%), by Country 2025 & 2033
- Figure 62: South America Bio photonics Industry Volume Share (%), by Country 2025 & 2033
List of Tables
- Table 1: Global Bio photonics Industry Revenue billion Forecast, by Technology 2020 & 2033
- Table 2: Global Bio photonics Industry Volume K Unit Forecast, by Technology 2020 & 2033
- Table 3: Global Bio photonics Industry Revenue billion Forecast, by Application 2020 & 2033
- Table 4: Global Bio photonics Industry Volume K Unit Forecast, by Application 2020 & 2033
- Table 5: Global Bio photonics Industry Revenue billion Forecast, by Region 2020 & 2033
- Table 6: Global Bio photonics Industry Volume K Unit Forecast, by Region 2020 & 2033
- Table 7: Global Bio photonics Industry Revenue billion Forecast, by Technology 2020 & 2033
- Table 8: Global Bio photonics Industry Volume K Unit Forecast, by Technology 2020 & 2033
- Table 9: Global Bio photonics Industry Revenue billion Forecast, by Application 2020 & 2033
- Table 10: Global Bio photonics Industry Volume K Unit Forecast, by Application 2020 & 2033
- Table 11: Global Bio photonics Industry Revenue billion Forecast, by Country 2020 & 2033
- Table 12: Global Bio photonics Industry Volume K Unit Forecast, by Country 2020 & 2033
- Table 13: United States Bio photonics Industry Revenue (billion) Forecast, by Application 2020 & 2033
- Table 14: United States Bio photonics Industry Volume (K Unit) Forecast, by Application 2020 & 2033
- Table 15: Canada Bio photonics Industry Revenue (billion) Forecast, by Application 2020 & 2033
- Table 16: Canada Bio photonics Industry Volume (K Unit) Forecast, by Application 2020 & 2033
- Table 17: Mexico Bio photonics Industry Revenue (billion) Forecast, by Application 2020 & 2033
- Table 18: Mexico Bio photonics Industry Volume (K Unit) Forecast, by Application 2020 & 2033
- Table 19: Global Bio photonics Industry Revenue billion Forecast, by Technology 2020 & 2033
- Table 20: Global Bio photonics Industry Volume K Unit Forecast, by Technology 2020 & 2033
- Table 21: Global Bio photonics Industry Revenue billion Forecast, by Application 2020 & 2033
- Table 22: Global Bio photonics Industry Volume K Unit Forecast, by Application 2020 & 2033
- Table 23: Global Bio photonics Industry Revenue billion Forecast, by Country 2020 & 2033
- Table 24: Global Bio photonics Industry Volume K Unit Forecast, by Country 2020 & 2033
- Table 25: Germany Bio photonics Industry Revenue (billion) Forecast, by Application 2020 & 2033
- Table 26: Germany Bio photonics Industry Volume (K Unit) Forecast, by Application 2020 & 2033
- Table 27: United Kingdom Bio photonics Industry Revenue (billion) Forecast, by Application 2020 & 2033
- Table 28: United Kingdom Bio photonics Industry Volume (K Unit) Forecast, by Application 2020 & 2033
- Table 29: France Bio photonics Industry Revenue (billion) Forecast, by Application 2020 & 2033
- Table 30: France Bio photonics Industry Volume (K Unit) Forecast, by Application 2020 & 2033
- Table 31: Italy Bio photonics Industry Revenue (billion) Forecast, by Application 2020 & 2033
- Table 32: Italy Bio photonics Industry Volume (K Unit) Forecast, by Application 2020 & 2033
- Table 33: Spain Bio photonics Industry Revenue (billion) Forecast, by Application 2020 & 2033
- Table 34: Spain Bio photonics Industry Volume (K Unit) Forecast, by Application 2020 & 2033
- Table 35: Rest of Europe Bio photonics Industry Revenue (billion) Forecast, by Application 2020 & 2033
- Table 36: Rest of Europe Bio photonics Industry Volume (K Unit) Forecast, by Application 2020 & 2033
- Table 37: Global Bio photonics Industry Revenue billion Forecast, by Technology 2020 & 2033
- Table 38: Global Bio photonics Industry Volume K Unit Forecast, by Technology 2020 & 2033
- Table 39: Global Bio photonics Industry Revenue billion Forecast, by Application 2020 & 2033
- Table 40: Global Bio photonics Industry Volume K Unit Forecast, by Application 2020 & 2033
- Table 41: Global Bio photonics Industry Revenue billion Forecast, by Country 2020 & 2033
- Table 42: Global Bio photonics Industry Volume K Unit Forecast, by Country 2020 & 2033
- Table 43: China Bio photonics Industry Revenue (billion) Forecast, by Application 2020 & 2033
- Table 44: China Bio photonics Industry Volume (K Unit) Forecast, by Application 2020 & 2033
- Table 45: Japan Bio photonics Industry Revenue (billion) Forecast, by Application 2020 & 2033
- Table 46: Japan Bio photonics Industry Volume (K Unit) Forecast, by Application 2020 & 2033
- Table 47: India Bio photonics Industry Revenue (billion) Forecast, by Application 2020 & 2033
- Table 48: India Bio photonics Industry Volume (K Unit) Forecast, by Application 2020 & 2033
- Table 49: Australia Bio photonics Industry Revenue (billion) Forecast, by Application 2020 & 2033
- Table 50: Australia Bio photonics Industry Volume (K Unit) Forecast, by Application 2020 & 2033
- Table 51: South Korea Bio photonics Industry Revenue (billion) Forecast, by Application 2020 & 2033
- Table 52: South Korea Bio photonics Industry Volume (K Unit) Forecast, by Application 2020 & 2033
- Table 53: Rest of Asia Pacific Bio photonics Industry Revenue (billion) Forecast, by Application 2020 & 2033
- Table 54: Rest of Asia Pacific Bio photonics Industry Volume (K Unit) Forecast, by Application 2020 & 2033
- Table 55: Global Bio photonics Industry Revenue billion Forecast, by Technology 2020 & 2033
- Table 56: Global Bio photonics Industry Volume K Unit Forecast, by Technology 2020 & 2033
- Table 57: Global Bio photonics Industry Revenue billion Forecast, by Application 2020 & 2033
- Table 58: Global Bio photonics Industry Volume K Unit Forecast, by Application 2020 & 2033
- Table 59: Global Bio photonics Industry Revenue billion Forecast, by Country 2020 & 2033
- Table 60: Global Bio photonics Industry Volume K Unit Forecast, by Country 2020 & 2033
- Table 61: GCC Bio photonics Industry Revenue (billion) Forecast, by Application 2020 & 2033
- Table 62: GCC Bio photonics Industry Volume (K Unit) Forecast, by Application 2020 & 2033
- Table 63: South Africa Bio photonics Industry Revenue (billion) Forecast, by Application 2020 & 2033
- Table 64: South Africa Bio photonics Industry Volume (K Unit) Forecast, by Application 2020 & 2033
- Table 65: Rest of Middle East and Africa Bio photonics Industry Revenue (billion) Forecast, by Application 2020 & 2033
- Table 66: Rest of Middle East and Africa Bio photonics Industry Volume (K Unit) Forecast, by Application 2020 & 2033
- Table 67: Global Bio photonics Industry Revenue billion Forecast, by Technology 2020 & 2033
- Table 68: Global Bio photonics Industry Volume K Unit Forecast, by Technology 2020 & 2033
- Table 69: Global Bio photonics Industry Revenue billion Forecast, by Application 2020 & 2033
- Table 70: Global Bio photonics Industry Volume K Unit Forecast, by Application 2020 & 2033
- Table 71: Global Bio photonics Industry Revenue billion Forecast, by Country 2020 & 2033
- Table 72: Global Bio photonics Industry Volume K Unit Forecast, by Country 2020 & 2033
- Table 73: Brazil Bio photonics Industry Revenue (billion) Forecast, by Application 2020 & 2033
- Table 74: Brazil Bio photonics Industry Volume (K Unit) Forecast, by Application 2020 & 2033
- Table 75: Argentina Bio photonics Industry Revenue (billion) Forecast, by Application 2020 & 2033
- Table 76: Argentina Bio photonics Industry Volume (K Unit) Forecast, by Application 2020 & 2033
- Table 77: Rest of South America Bio photonics Industry Revenue (billion) Forecast, by Application 2020 & 2033
- Table 78: Rest of South America Bio photonics Industry Volume (K Unit) Forecast, by Application 2020 & 2033
Frequently Asked Questions
1. What is the projected Compound Annual Growth Rate (CAGR) of the Bio photonics Industry?
The projected CAGR is approximately 11.3%.
2. Which companies are prominent players in the Bio photonics Industry?
Key companies in the market include Becton Dickinson and Company, NU Skin Enterprises, PerkinElmer, Hamamatsu Photonics KK, Zenalux Biomedical Inc, Glenbrook Technologies, Oxford Instruments PLC, Carl Zeiss AG, Olympus Corporation, Thermo Fisher Scientific.
3. What are the main segments of the Bio photonics Industry?
The market segments include Technology, Application.
4. Can you provide details about the market size?
The market size is estimated to be USD 76.1 billion as of 2022.
5. What are some drivers contributing to market growth?
Growing Geriatric Population; Increasing Use of Biophotonics in Cell and Tissue Diagnostics; Emergence of Nanotechnology in Biophotonics; Development of Novel Photoacoustic Tomography (PAT) System.
6. What are the notable trends driving market growth?
Inside Imaging (Endoscopy) Segment is Expected to Witness Growth Over the Forecast Period.
7. Are there any restraints impacting market growth?
Lack of Awareness of Biophotonics Technology and Skilled Personnel; High Cost of Technology.
8. Can you provide examples of recent developments in the market?
In March 2021, Zeiss expanded its presence in North America by launching new research and development, production, sales, and customer service center in the United States with an investment of USD 180 million. The new site will incorporate the X-ray Microscopy business, along with the ZEISS Microscopy Customer Center, to provide support for the opportunities in materials research, life sciences, and industrial applications.
9. What pricing options are available for accessing the report?
Pricing options include single-user, multi-user, and enterprise licenses priced at USD 4750, USD 5250, and USD 8750 respectively.
10. Is the market size provided in terms of value or volume?
The market size is provided in terms of value, measured in billion and volume, measured in K Unit.
11. Are there any specific market keywords associated with the report?
Yes, the market keyword associated with the report is "Bio photonics Industry," which aids in identifying and referencing the specific market segment covered.
12. How do I determine which pricing option suits my needs best?
The pricing options vary based on user requirements and access needs. Individual users may opt for single-user licenses, while businesses requiring broader access may choose multi-user or enterprise licenses for cost-effective access to the report.
13. Are there any additional resources or data provided in the Bio photonics Industry report?
While the report offers comprehensive insights, it's advisable to review the specific contents or supplementary materials provided to ascertain if additional resources or data are available.
14. How can I stay updated on further developments or reports in the Bio photonics Industry?
To stay informed about further developments, trends, and reports in the Bio photonics Industry, consider subscribing to industry newsletters, following relevant companies and organizations, or regularly checking reputable industry news sources and publications.
Methodology
Step 1 - Identification of Relevant Samples Size from Population Database


Step 2 - Approaches for Defining Global Market Size (Value, Volume* & Price*)

Note*: In applicable scenarios
Step 3 - Data Sources
Primary Research
- Web Analytics
- Survey Reports
- Research Institute
- Latest Research Reports
- Opinion Leaders
Secondary Research
- Annual Reports
- White Paper
- Latest Press Release
- Industry Association
- Paid Database
- Investor Presentations

Step 4 - Data Triangulation
Involves using different sources of information in order to increase the validity of a study
These sources are likely to be stakeholders in a program - participants, other researchers, program staff, other community members, and so on.
Then we put all data in single framework & apply various statistical tools to find out the dynamic on the market.
During the analysis stage, feedback from the stakeholder groups would be compared to determine areas of agreement as well as areas of divergence