

Key Insights
The global cancer software market is experiencing robust growth, driven by the increasing prevalence of cancer, advancements in cancer research and treatment, and the rising adoption of electronic health records (EHRs). The market's compound annual growth rate (CAGR) of 10.30% from 2019 to 2024 indicates significant expansion, projected to continue throughout the forecast period (2025-2033). Key market drivers include the need for efficient data management and analysis to support personalized cancer care, improved diagnostic accuracy through AI-powered tools, and the increasing demand for remote patient monitoring solutions. The shift towards cloud-based solutions enhances accessibility and scalability, fueling market growth across segments. While data security and privacy concerns pose a challenge, the benefits of streamlined workflows and improved patient outcomes are outweighing these concerns, particularly in sectors such as hospitals, medical practices, and government agencies. The market is segmented by deployment model (on-premise and cloud-based), database type (commercial and public), and end-use (government & third-party, private payers, hospitals & medical practices, and others). North America currently holds a significant market share due to advanced healthcare infrastructure and high adoption rates of innovative technologies. However, Asia-Pacific is projected to exhibit considerable growth in the coming years, fueled by rising healthcare expenditure and a growing population. Leading players in this market, including IBM Corporation, McKesson Corporation, and Siemens Healthineers, are focusing on strategic partnerships, acquisitions, and product innovations to strengthen their market presence and capitalize on emerging opportunities.
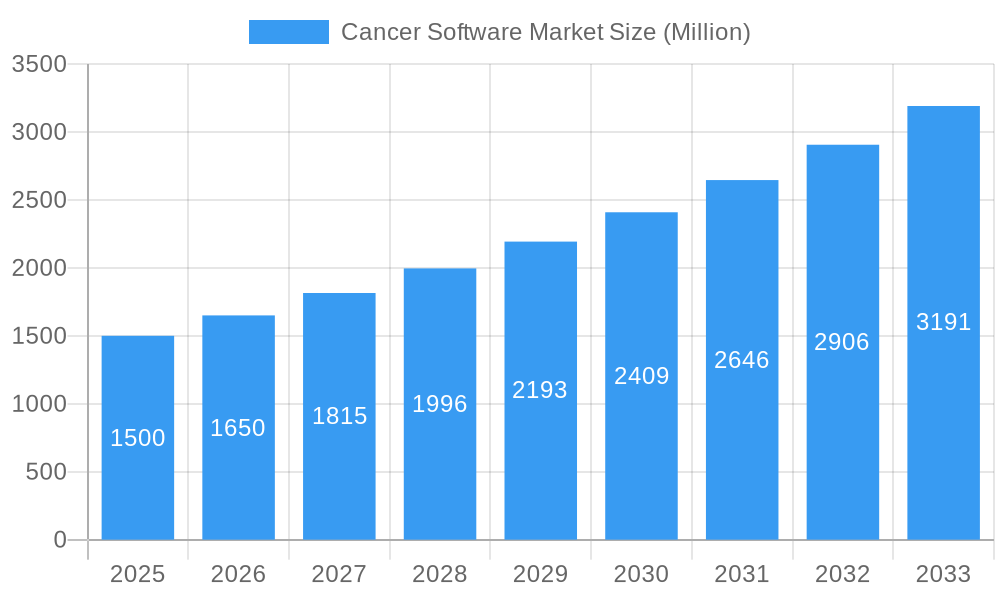
Cancer Software Market Market Size (In Billion)
The competitive landscape is dynamic, with established players and emerging technology firms vying for market share. The success of individual companies will hinge on their ability to offer robust, user-friendly software solutions that integrate seamlessly with existing healthcare IT infrastructure, address data privacy concerns effectively, and demonstrate a clear return on investment for healthcare providers. Future growth will likely be fueled by advancements in artificial intelligence (AI), machine learning (ML), and big data analytics, enabling more precise cancer diagnostics, personalized treatment planning, and improved patient outcomes. The integration of these technologies with wearable sensors and remote monitoring tools will further expand the market's reach and potential. The ongoing research and development in cancer treatment methodologies will also continue to act as a significant driver for this market. The increasing focus on value-based care and the need for improved operational efficiency in oncology practices will also contribute positively to the overall market growth.
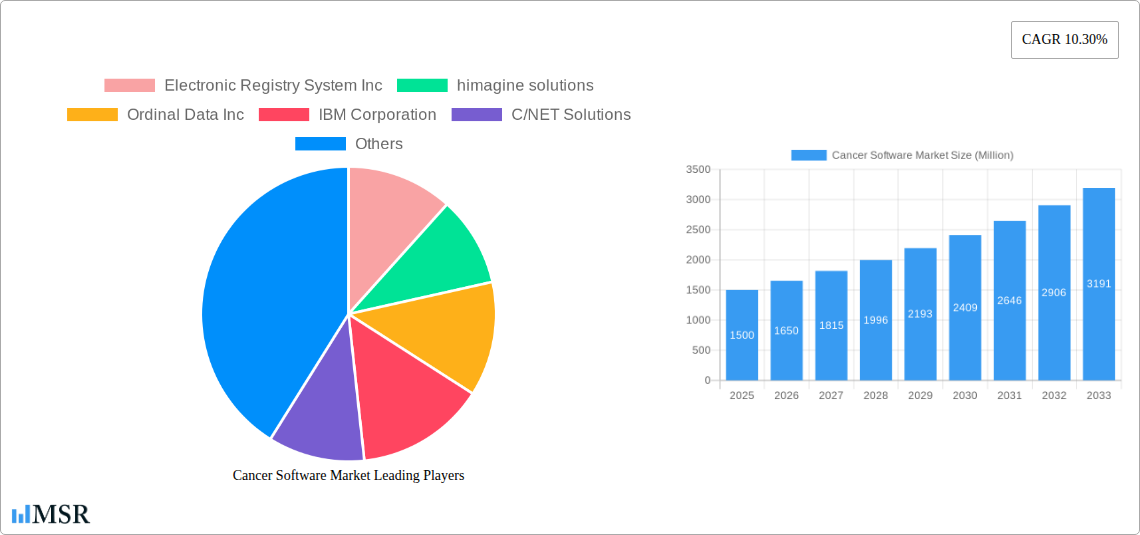
Cancer Software Market Company Market Share
Cancer Software Market Report: 2019-2033 Forecast
This comprehensive report provides a detailed analysis of the Cancer Software Market, offering valuable insights for stakeholders across the healthcare technology landscape. With a study period spanning 2019-2033, a base year of 2025, and a forecast period of 2025-2033, this report covers market size, segmentation, key players, and future growth projections. The report uses a combination of qualitative and quantitative analysis, incorporating real-world data and expert projections to deliver actionable intelligence. The market is expected to reach xx Million by 2033, exhibiting a CAGR of xx% during the forecast period.
Cancer Software Market Concentration & Dynamics
The Cancer Software Market exhibits a moderately consolidated structure, with several key players holding significant market share. While precise market share figures for each company are proprietary, IBM Corporation, McKesson Corporation, and Siemens Healthineers are prominent players, alongside Electronic Registry System Inc, imagine solutions, Ordinal Data Inc, C/NET Solutions, Rocky Mountain Cancer Data Systems, Conduent Inc, NeuralFrame Inc, Onco Inc, and Elekta. The market is characterized by a dynamic innovation ecosystem, with ongoing development of AI-powered diagnostic tools, personalized treatment planning software, and advanced data analytics platforms.
Regulatory frameworks, such as HIPAA and GDPR, significantly influence market dynamics, impacting data security and privacy. Substitute products, including traditional manual record-keeping systems, are gradually being replaced by more efficient and data-rich software solutions. End-user trends, such as the growing adoption of cloud-based solutions and the increasing demand for interoperability, are driving market growth. The number of M&A deals in the sector has been steadily increasing, reflecting the consolidation trend within the industry and an estimated xx M&A deals occurred in the last 5 years.
Cancer Software Market Industry Insights & Trends
The Cancer Software Market is experiencing robust growth, driven by several key factors. The rising prevalence of cancer globally, coupled with the increasing need for efficient and accurate cancer care management, is a major catalyst. Technological advancements, including the integration of artificial intelligence (AI) and machine learning (ML) in diagnostic tools and treatment planning, are significantly impacting market growth. Furthermore, the shift towards personalized medicine and the growing adoption of cloud-based solutions are creating new opportunities.
Consumer behavior is also evolving, with patients and healthcare providers demanding more convenient and accessible healthcare solutions. This increasing demand for digital health tools is fueling the adoption of cancer software solutions. The market size in 2025 is estimated at xx Million, exhibiting a Compound Annual Growth Rate (CAGR) of xx% during the historical period (2019-2024). The increasing emphasis on data security and regulatory compliance further fuels market growth and pushes the improvement of the industry software.
Key Markets & Segments Leading Cancer Software Market
By Deployment Model: The cloud-based segment dominates the market due to its scalability, accessibility, and cost-effectiveness. The on-premise segment continues to retain a significant share among traditional providers that rely on local infrastructure.
By Database Type: Commercial databases currently hold a larger market share due to their advanced features and robust security measures. However, the public database segment is experiencing growth as data sharing and collaborative research initiatives gain momentum.
By End Use: Hospital & Medical Practices represent the largest segment, driven by the high volume of cancer patients and the need for efficient patient management. Private payers are also contributing significantly to market growth, as they seek to optimize healthcare costs and improve treatment outcomes. Government & third-party segments are also developing consistently.
The North American market currently holds the largest share, driven by advanced healthcare infrastructure, high adoption rates of digital health technologies, and robust funding for cancer research. Economic growth and government initiatives supporting digital healthcare have accelerated market adoption. However, the European and Asia-Pacific regions are also exhibiting strong growth potential, fueled by increasing healthcare expenditure and rising cancer prevalence.
Cancer Software Market Product Developments
Recent product innovations in the cancer software market include the integration of AI for early cancer detection, advanced analytics for personalized treatment planning, and improved data visualization tools for enhanced clinical decision-making. These advancements are providing significant competitive edges to companies that leverage these technologies, increasing their efficiency and the accuracy of their cancer treatment.
Challenges in the Cancer Software Market Market
The Cancer Software Market faces challenges such as high initial investment costs for implementation, the need for skilled professionals to manage the software, and the complex regulatory landscape around data privacy and security. Data integration issues and interoperability challenges across different healthcare systems also pose obstacles, slowing the market adoption of sophisticated software solutions. The stringent regulatory compliance requirements, specifically in the healthcare sector, represent a significant barrier for many companies.
Forces Driving Cancer Software Market Growth
Technological advancements, particularly in AI and ML, are pivotal in driving market growth. The increasing prevalence of cancer and the rising demand for personalized medicine are creating opportunities. Furthermore, favorable government policies and initiatives supporting the adoption of digital health solutions are accelerating market expansion.
Long-Term Growth Catalysts in Cancer Software Market
Long-term growth will be fueled by continuous innovation in software capabilities, strategic partnerships between technology companies and healthcare providers, and the expansion into new geographic markets, particularly in developing countries with increasing cancer rates. The growing emphasis on remote patient monitoring and telemedicine also offers significant expansion opportunities.
Emerging Opportunities in Cancer Software Market
Emerging opportunities include the development of innovative solutions for remote patient monitoring, the integration of wearable sensors for real-time health data collection, and the use of blockchain technology to enhance data security and interoperability. The growing focus on precision oncology and the increasing demand for data-driven insights will also shape future market opportunities.
Leading Players in the Cancer Software Market Sector
- Electronic Registry System Inc
- imagine solutions
- Ordinal Data Inc
- IBM Corporation
- C/NET Solutions
- Rocky Mountain Cancer Data Systems
- Conduent Inc
- NeuralFrame Inc
- Onco Inc
- Elekta
- McKesson Corporation
- Siemens Healthineers
- List Not Exhaustive
Key Milestones in Cancer Software Market Industry
May 2022: Kaiku Health and Roche partnered to deploy digital tools for real-time symptom management and personalized cancer care. This significantly boosted the adoption of digital patient monitoring and management (DPMM) solutions.
March 2022: Elekta's ProKnow software received a significant order from the NHSSC, expanding its reach within the UK's healthcare system and validating its market position. This highlighted the growing demand for secure and scalable radiotherapy data management solutions.
Strategic Outlook for Cancer Software Market Market
The Cancer Software Market presents significant growth potential, driven by technological innovation, increasing healthcare expenditure, and the growing focus on personalized medicine. Strategic partnerships, mergers and acquisitions, and expansion into new geographic markets will be crucial for companies to capitalize on future opportunities and secure a leading position in this rapidly evolving sector.
Cancer Software Market Segmentation
-
1. Deployment Model
- 1.1. On-Premise
- 1.2. Cloud-based
-
2. Database Type
- 2.1. Commercial Database
- 2.2. Public Database
-
3. End Use
- 3.1. Government & Third Party
- 3.2. Private Payers
- 3.3. Hospital & Medical Practice
- 3.4. Others
Cancer Software Market Segmentation By Geography
-
1. North America
- 1.1. United States
- 1.2. Canada
- 1.3. Mexico
-
2. Europe
- 2.1. Germany
- 2.2. United Kingdom
- 2.3. France
- 2.4. Italy
- 2.5. Spain
- 2.6. Rest of Europe
-
3. Asia Pacific
- 3.1. China
- 3.2. Japan
- 3.3. India
- 3.4. Australia
- 3.5. South Korea
- 3.6. Rest of Asia Pacific
-
4. Middle East and Africa
- 4.1. GCC
- 4.2. South Africa
- 4.3. Rest of Middle East and Africa
-
5. South America
- 5.1. Brazil
- 5.2. Argentina
- 5.3. Rest of South America
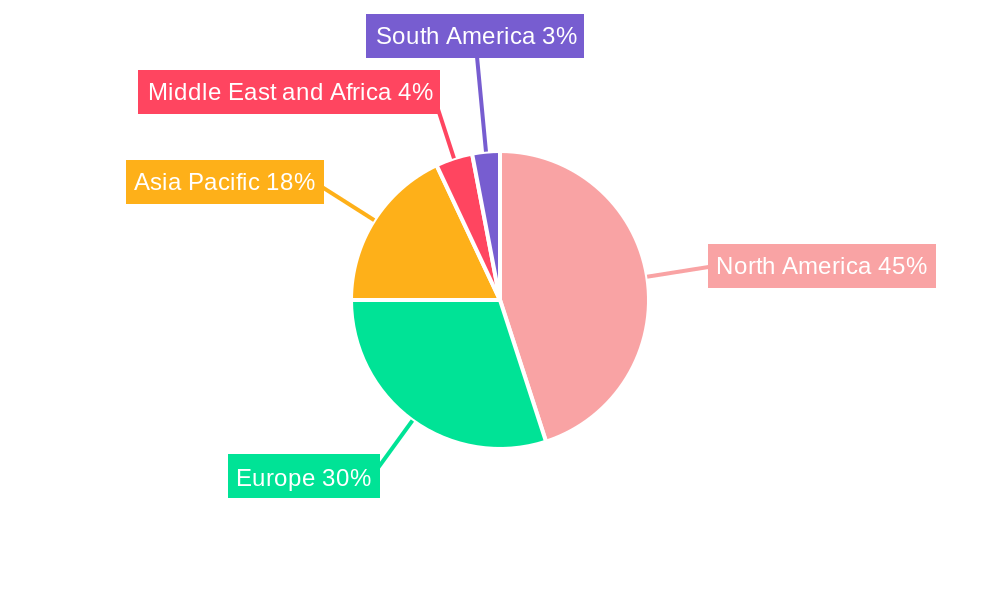
Cancer Software Market Regional Market Share
Geographic Coverage of Cancer Software Market
Cancer Software Market REPORT HIGHLIGHTS
| Aspects | Details |
|---|---|
| Study Period | 2020-2034 |
| Base Year | 2025 |
| Estimated Year | 2026 |
| Forecast Period | 2026-2034 |
| Historical Period | 2020-2025 |
| Growth Rate | CAGR of 10.30% from 2020-2034 |
| Segmentation |
|
Table of Contents
- 1. Introduction
- 1.1. Research Scope
- 1.2. Market Segmentation
- 1.3. Research Objective
- 1.4. Definitions and Assumptions
- 2. Executive Summary
- 2.1. Market Snapshot
- 3. Market Dynamics
- 3.1. Market Drivers
- 3.2. Market Restrains
- 3.3. Market Trends
- 3.4. Market Opportunities
- 4. Market Factor Analysis
- 4.1. Porters Five Forces
- 4.1.1. Bargaining Power of Suppliers
- 4.1.2. Bargaining Power of Buyers
- 4.1.3. Threat of New Entrants
- 4.1.4. Threat of Substitutes
- 4.1.5. Competitive Rivalry
- 4.2. PESTEL analysis
- 4.3. BCG Analysis
- 4.3.1. Stars (High Growth, High Market Share)
- 4.3.2. Cash Cows (Low Growth, High Market Share)
- 4.3.3. Question Mark (High Growth, Low Market Share)
- 4.3.4. Dogs (Low Growth, Low Market Share)
- 4.4. Ansoff Matrix Analysis
- 4.5. Supply Chain Analysis
- 4.6. Regulatory Landscape
- 4.7. Current Market Potential and Opportunity Assessment (TAM–SAM–SOM Framework)
- 4.8. MSR Analyst Note
- 4.1. Porters Five Forces
- 5. Market Analysis, Insights and Forecast 2021-2033
- 5.1. Market Analysis, Insights and Forecast - by Deployment Model
- 5.1.1. On-Premise
- 5.1.2. Cloud-based
- 5.2. Market Analysis, Insights and Forecast - by Database Type
- 5.2.1. Commercial Database
- 5.2.2. Public Database
- 5.3. Market Analysis, Insights and Forecast - by End Use
- 5.3.1. Government & Third Party
- 5.3.2. Private Payers
- 5.3.3. Hospital & Medical Practice
- 5.3.4. Others
- 5.4. Market Analysis, Insights and Forecast - by Region
- 5.4.1. North America
- 5.4.2. Europe
- 5.4.3. Asia Pacific
- 5.4.4. Middle East and Africa
- 5.4.5. South America
- 5.1. Market Analysis, Insights and Forecast - by Deployment Model
- 6. Global Cancer Software Market Analysis, Insights and Forecast, 2021-2033
- 6.1. Market Analysis, Insights and Forecast - by Deployment Model
- 6.1.1. On-Premise
- 6.1.2. Cloud-based
- 6.2. Market Analysis, Insights and Forecast - by Database Type
- 6.2.1. Commercial Database
- 6.2.2. Public Database
- 6.3. Market Analysis, Insights and Forecast - by End Use
- 6.3.1. Government & Third Party
- 6.3.2. Private Payers
- 6.3.3. Hospital & Medical Practice
- 6.3.4. Others
- 6.1. Market Analysis, Insights and Forecast - by Deployment Model
- 7. North America Cancer Software Market Analysis, Insights and Forecast, 2020-2032
- 7.1. Market Analysis, Insights and Forecast - by Deployment Model
- 7.1.1. On-Premise
- 7.1.2. Cloud-based
- 7.2. Market Analysis, Insights and Forecast - by Database Type
- 7.2.1. Commercial Database
- 7.2.2. Public Database
- 7.3. Market Analysis, Insights and Forecast - by End Use
- 7.3.1. Government & Third Party
- 7.3.2. Private Payers
- 7.3.3. Hospital & Medical Practice
- 7.3.4. Others
- 7.1. Market Analysis, Insights and Forecast - by Deployment Model
- 8. Europe Cancer Software Market Analysis, Insights and Forecast, 2020-2032
- 8.1. Market Analysis, Insights and Forecast - by Deployment Model
- 8.1.1. On-Premise
- 8.1.2. Cloud-based
- 8.2. Market Analysis, Insights and Forecast - by Database Type
- 8.2.1. Commercial Database
- 8.2.2. Public Database
- 8.3. Market Analysis, Insights and Forecast - by End Use
- 8.3.1. Government & Third Party
- 8.3.2. Private Payers
- 8.3.3. Hospital & Medical Practice
- 8.3.4. Others
- 8.1. Market Analysis, Insights and Forecast - by Deployment Model
- 9. Asia Pacific Cancer Software Market Analysis, Insights and Forecast, 2020-2032
- 9.1. Market Analysis, Insights and Forecast - by Deployment Model
- 9.1.1. On-Premise
- 9.1.2. Cloud-based
- 9.2. Market Analysis, Insights and Forecast - by Database Type
- 9.2.1. Commercial Database
- 9.2.2. Public Database
- 9.3. Market Analysis, Insights and Forecast - by End Use
- 9.3.1. Government & Third Party
- 9.3.2. Private Payers
- 9.3.3. Hospital & Medical Practice
- 9.3.4. Others
- 9.1. Market Analysis, Insights and Forecast - by Deployment Model
- 10. Middle East and Africa Cancer Software Market Analysis, Insights and Forecast, 2020-2032
- 10.1. Market Analysis, Insights and Forecast - by Deployment Model
- 10.1.1. On-Premise
- 10.1.2. Cloud-based
- 10.2. Market Analysis, Insights and Forecast - by Database Type
- 10.2.1. Commercial Database
- 10.2.2. Public Database
- 10.3. Market Analysis, Insights and Forecast - by End Use
- 10.3.1. Government & Third Party
- 10.3.2. Private Payers
- 10.3.3. Hospital & Medical Practice
- 10.3.4. Others
- 10.1. Market Analysis, Insights and Forecast - by Deployment Model
- 11. South America Cancer Software Market Analysis, Insights and Forecast, 2020-2032
- 11.1. Market Analysis, Insights and Forecast - by Deployment Model
- 11.1.1. On-Premise
- 11.1.2. Cloud-based
- 11.2. Market Analysis, Insights and Forecast - by Database Type
- 11.2.1. Commercial Database
- 11.2.2. Public Database
- 11.3. Market Analysis, Insights and Forecast - by End Use
- 11.3.1. Government & Third Party
- 11.3.2. Private Payers
- 11.3.3. Hospital & Medical Practice
- 11.3.4. Others
- 11.1. Market Analysis, Insights and Forecast - by Deployment Model
- 12. Competitive Analysis
- 12.1. Company Profiles
- 12.1.1 Electronic Registry System Inc
- 12.1.1.1. Company Overview
- 12.1.1.2. Products
- 12.1.1.3. Company Financials
- 12.1.1.4. SWOT Analysis
- 12.1.2 himagine solutions
- 12.1.2.1. Company Overview
- 12.1.2.2. Products
- 12.1.2.3. Company Financials
- 12.1.2.4. SWOT Analysis
- 12.1.3 Ordinal Data Inc
- 12.1.3.1. Company Overview
- 12.1.3.2. Products
- 12.1.3.3. Company Financials
- 12.1.3.4. SWOT Analysis
- 12.1.4 IBM Corporation
- 12.1.4.1. Company Overview
- 12.1.4.2. Products
- 12.1.4.3. Company Financials
- 12.1.4.4. SWOT Analysis
- 12.1.5 C/NET Solutions
- 12.1.5.1. Company Overview
- 12.1.5.2. Products
- 12.1.5.3. Company Financials
- 12.1.5.4. SWOT Analysis
- 12.1.6 Rocky Mountain Cancer Data Systems
- 12.1.6.1. Company Overview
- 12.1.6.2. Products
- 12.1.6.3. Company Financials
- 12.1.6.4. SWOT Analysis
- 12.1.7 Conduent Inc
- 12.1.7.1. Company Overview
- 12.1.7.2. Products
- 12.1.7.3. Company Financials
- 12.1.7.4. SWOT Analysis
- 12.1.8 NeuralFrame Inc
- 12.1.8.1. Company Overview
- 12.1.8.2. Products
- 12.1.8.3. Company Financials
- 12.1.8.4. SWOT Analysis
- 12.1.9 Onco Inc
- 12.1.9.1. Company Overview
- 12.1.9.2. Products
- 12.1.9.3. Company Financials
- 12.1.9.4. SWOT Analysis
- 12.1.10 Elekta
- 12.1.10.1. Company Overview
- 12.1.10.2. Products
- 12.1.10.3. Company Financials
- 12.1.10.4. SWOT Analysis
- 12.1.11 McKesson Corporation
- 12.1.11.1. Company Overview
- 12.1.11.2. Products
- 12.1.11.3. Company Financials
- 12.1.11.4. SWOT Analysis
- 12.1.12 Siemens Healthineers*List Not Exhaustive
- 12.1.12.1. Company Overview
- 12.1.12.2. Products
- 12.1.12.3. Company Financials
- 12.1.12.4. SWOT Analysis
- 12.1.1 Electronic Registry System Inc
- 12.2. Market Entropy
- 12.2.1 Company's Key Areas Served
- 12.2.2 Recent Developments
- 12.3. Company Market Share Analysis 2025
- 12.3.1 Top 5 Companies Market Share Analysis
- 12.3.2 Top 3 Companies Market Share Analysis
- 12.4. List of Potential Customers
- 13. Research Methodology
List of Figures
- Figure 1: Global Cancer Software Market Revenue Breakdown (Million, %) by Region 2025 & 2033
- Figure 2: North America Cancer Software Market Revenue (Million), by Deployment Model 2025 & 2033
- Figure 3: North America Cancer Software Market Revenue Share (%), by Deployment Model 2025 & 2033
- Figure 4: North America Cancer Software Market Revenue (Million), by Database Type 2025 & 2033
- Figure 5: North America Cancer Software Market Revenue Share (%), by Database Type 2025 & 2033
- Figure 6: North America Cancer Software Market Revenue (Million), by End Use 2025 & 2033
- Figure 7: North America Cancer Software Market Revenue Share (%), by End Use 2025 & 2033
- Figure 8: North America Cancer Software Market Revenue (Million), by Country 2025 & 2033
- Figure 9: North America Cancer Software Market Revenue Share (%), by Country 2025 & 2033
- Figure 10: Europe Cancer Software Market Revenue (Million), by Deployment Model 2025 & 2033
- Figure 11: Europe Cancer Software Market Revenue Share (%), by Deployment Model 2025 & 2033
- Figure 12: Europe Cancer Software Market Revenue (Million), by Database Type 2025 & 2033
- Figure 13: Europe Cancer Software Market Revenue Share (%), by Database Type 2025 & 2033
- Figure 14: Europe Cancer Software Market Revenue (Million), by End Use 2025 & 2033
- Figure 15: Europe Cancer Software Market Revenue Share (%), by End Use 2025 & 2033
- Figure 16: Europe Cancer Software Market Revenue (Million), by Country 2025 & 2033
- Figure 17: Europe Cancer Software Market Revenue Share (%), by Country 2025 & 2033
- Figure 18: Asia Pacific Cancer Software Market Revenue (Million), by Deployment Model 2025 & 2033
- Figure 19: Asia Pacific Cancer Software Market Revenue Share (%), by Deployment Model 2025 & 2033
- Figure 20: Asia Pacific Cancer Software Market Revenue (Million), by Database Type 2025 & 2033
- Figure 21: Asia Pacific Cancer Software Market Revenue Share (%), by Database Type 2025 & 2033
- Figure 22: Asia Pacific Cancer Software Market Revenue (Million), by End Use 2025 & 2033
- Figure 23: Asia Pacific Cancer Software Market Revenue Share (%), by End Use 2025 & 2033
- Figure 24: Asia Pacific Cancer Software Market Revenue (Million), by Country 2025 & 2033
- Figure 25: Asia Pacific Cancer Software Market Revenue Share (%), by Country 2025 & 2033
- Figure 26: Middle East and Africa Cancer Software Market Revenue (Million), by Deployment Model 2025 & 2033
- Figure 27: Middle East and Africa Cancer Software Market Revenue Share (%), by Deployment Model 2025 & 2033
- Figure 28: Middle East and Africa Cancer Software Market Revenue (Million), by Database Type 2025 & 2033
- Figure 29: Middle East and Africa Cancer Software Market Revenue Share (%), by Database Type 2025 & 2033
- Figure 30: Middle East and Africa Cancer Software Market Revenue (Million), by End Use 2025 & 2033
- Figure 31: Middle East and Africa Cancer Software Market Revenue Share (%), by End Use 2025 & 2033
- Figure 32: Middle East and Africa Cancer Software Market Revenue (Million), by Country 2025 & 2033
- Figure 33: Middle East and Africa Cancer Software Market Revenue Share (%), by Country 2025 & 2033
- Figure 34: South America Cancer Software Market Revenue (Million), by Deployment Model 2025 & 2033
- Figure 35: South America Cancer Software Market Revenue Share (%), by Deployment Model 2025 & 2033
- Figure 36: South America Cancer Software Market Revenue (Million), by Database Type 2025 & 2033
- Figure 37: South America Cancer Software Market Revenue Share (%), by Database Type 2025 & 2033
- Figure 38: South America Cancer Software Market Revenue (Million), by End Use 2025 & 2033
- Figure 39: South America Cancer Software Market Revenue Share (%), by End Use 2025 & 2033
- Figure 40: South America Cancer Software Market Revenue (Million), by Country 2025 & 2033
- Figure 41: South America Cancer Software Market Revenue Share (%), by Country 2025 & 2033
List of Tables
- Table 1: Global Cancer Software Market Revenue Million Forecast, by Deployment Model 2020 & 2033
- Table 2: Global Cancer Software Market Revenue Million Forecast, by Database Type 2020 & 2033
- Table 3: Global Cancer Software Market Revenue Million Forecast, by End Use 2020 & 2033
- Table 4: Global Cancer Software Market Revenue Million Forecast, by Region 2020 & 2033
- Table 5: Global Cancer Software Market Revenue Million Forecast, by Deployment Model 2020 & 2033
- Table 6: Global Cancer Software Market Revenue Million Forecast, by Database Type 2020 & 2033
- Table 7: Global Cancer Software Market Revenue Million Forecast, by End Use 2020 & 2033
- Table 8: Global Cancer Software Market Revenue Million Forecast, by Country 2020 & 2033
- Table 9: United States Cancer Software Market Revenue (Million) Forecast, by Application 2020 & 2033
- Table 10: Canada Cancer Software Market Revenue (Million) Forecast, by Application 2020 & 2033
- Table 11: Mexico Cancer Software Market Revenue (Million) Forecast, by Application 2020 & 2033
- Table 12: Global Cancer Software Market Revenue Million Forecast, by Deployment Model 2020 & 2033
- Table 13: Global Cancer Software Market Revenue Million Forecast, by Database Type 2020 & 2033
- Table 14: Global Cancer Software Market Revenue Million Forecast, by End Use 2020 & 2033
- Table 15: Global Cancer Software Market Revenue Million Forecast, by Country 2020 & 2033
- Table 16: Germany Cancer Software Market Revenue (Million) Forecast, by Application 2020 & 2033
- Table 17: United Kingdom Cancer Software Market Revenue (Million) Forecast, by Application 2020 & 2033
- Table 18: France Cancer Software Market Revenue (Million) Forecast, by Application 2020 & 2033
- Table 19: Italy Cancer Software Market Revenue (Million) Forecast, by Application 2020 & 2033
- Table 20: Spain Cancer Software Market Revenue (Million) Forecast, by Application 2020 & 2033
- Table 21: Rest of Europe Cancer Software Market Revenue (Million) Forecast, by Application 2020 & 2033
- Table 22: Global Cancer Software Market Revenue Million Forecast, by Deployment Model 2020 & 2033
- Table 23: Global Cancer Software Market Revenue Million Forecast, by Database Type 2020 & 2033
- Table 24: Global Cancer Software Market Revenue Million Forecast, by End Use 2020 & 2033
- Table 25: Global Cancer Software Market Revenue Million Forecast, by Country 2020 & 2033
- Table 26: China Cancer Software Market Revenue (Million) Forecast, by Application 2020 & 2033
- Table 27: Japan Cancer Software Market Revenue (Million) Forecast, by Application 2020 & 2033
- Table 28: India Cancer Software Market Revenue (Million) Forecast, by Application 2020 & 2033
- Table 29: Australia Cancer Software Market Revenue (Million) Forecast, by Application 2020 & 2033
- Table 30: South Korea Cancer Software Market Revenue (Million) Forecast, by Application 2020 & 2033
- Table 31: Rest of Asia Pacific Cancer Software Market Revenue (Million) Forecast, by Application 2020 & 2033
- Table 32: Global Cancer Software Market Revenue Million Forecast, by Deployment Model 2020 & 2033
- Table 33: Global Cancer Software Market Revenue Million Forecast, by Database Type 2020 & 2033
- Table 34: Global Cancer Software Market Revenue Million Forecast, by End Use 2020 & 2033
- Table 35: Global Cancer Software Market Revenue Million Forecast, by Country 2020 & 2033
- Table 36: GCC Cancer Software Market Revenue (Million) Forecast, by Application 2020 & 2033
- Table 37: South Africa Cancer Software Market Revenue (Million) Forecast, by Application 2020 & 2033
- Table 38: Rest of Middle East and Africa Cancer Software Market Revenue (Million) Forecast, by Application 2020 & 2033
- Table 39: Global Cancer Software Market Revenue Million Forecast, by Deployment Model 2020 & 2033
- Table 40: Global Cancer Software Market Revenue Million Forecast, by Database Type 2020 & 2033
- Table 41: Global Cancer Software Market Revenue Million Forecast, by End Use 2020 & 2033
- Table 42: Global Cancer Software Market Revenue Million Forecast, by Country 2020 & 2033
- Table 43: Brazil Cancer Software Market Revenue (Million) Forecast, by Application 2020 & 2033
- Table 44: Argentina Cancer Software Market Revenue (Million) Forecast, by Application 2020 & 2033
- Table 45: Rest of South America Cancer Software Market Revenue (Million) Forecast, by Application 2020 & 2033
Frequently Asked Questions
1. What is the projected Compound Annual Growth Rate (CAGR) of the Cancer Software Market?
The projected CAGR is approximately 10.30%.
2. Which companies are prominent players in the Cancer Software Market?
Key companies in the market include Electronic Registry System Inc, himagine solutions, Ordinal Data Inc, IBM Corporation, C/NET Solutions, Rocky Mountain Cancer Data Systems, Conduent Inc, NeuralFrame Inc, Onco Inc, Elekta, McKesson Corporation, Siemens Healthineers*List Not Exhaustive.
3. What are the main segments of the Cancer Software Market?
The market segments include Deployment Model, Database Type, End Use.
4. Can you provide details about the market size?
The market size is estimated to be USD XX Million as of 2022.
5. What are some drivers contributing to market growth?
Increasing Prevalence of Cancer; Improving Quality of Care and Reducing Healthcare Costs.
6. What are the notable trends driving market growth?
Hospital & Medical Practice are Expected to Hold a Significant Market Share Over the Forecast Period.
7. Are there any restraints impacting market growth?
Privacy and Security Concerns for Patient Data.
8. Can you provide examples of recent developments in the market?
In May 2022, Kaiku Health and Roche entered into a strategic partnership in digital patient monitoring and management (DPMM). Kaiku Health and Roche aim to deploy digital tools to provide real-time symptom management by patients and Health Care Providers (HCPs), improve patient support, and provide personalized cancer care to cancer clinics and patients globally.
9. What pricing options are available for accessing the report?
Pricing options include single-user, multi-user, and enterprise licenses priced at USD 4750, USD 5250, and USD 8750 respectively.
10. Is the market size provided in terms of value or volume?
The market size is provided in terms of value, measured in Million.
11. Are there any specific market keywords associated with the report?
Yes, the market keyword associated with the report is "Cancer Software Market," which aids in identifying and referencing the specific market segment covered.
12. How do I determine which pricing option suits my needs best?
The pricing options vary based on user requirements and access needs. Individual users may opt for single-user licenses, while businesses requiring broader access may choose multi-user or enterprise licenses for cost-effective access to the report.
13. Are there any additional resources or data provided in the Cancer Software Market report?
While the report offers comprehensive insights, it's advisable to review the specific contents or supplementary materials provided to ascertain if additional resources or data are available.
14. How can I stay updated on further developments or reports in the Cancer Software Market?
To stay informed about further developments, trends, and reports in the Cancer Software Market, consider subscribing to industry newsletters, following relevant companies and organizations, or regularly checking reputable industry news sources and publications.
Methodology
Step 1 - Identification of Relevant Samples Size from Population Database


Step 2 - Approaches for Defining Global Market Size (Value, Volume* & Price*)

Note*: In applicable scenarios
Step 3 - Data Sources
Primary Research
- Web Analytics
- Survey Reports
- Research Institute
- Latest Research Reports
- Opinion Leaders
Secondary Research
- Annual Reports
- White Paper
- Latest Press Release
- Industry Association
- Paid Database
- Investor Presentations

Step 4 - Data Triangulation
Involves using different sources of information in order to increase the validity of a study
These sources are likely to be stakeholders in a program - participants, other researchers, program staff, other community members, and so on.
Then we put all data in single framework & apply various statistical tools to find out the dynamic on the market.
During the analysis stage, feedback from the stakeholder groups would be compared to determine areas of agreement as well as areas of divergence