

Key Insights
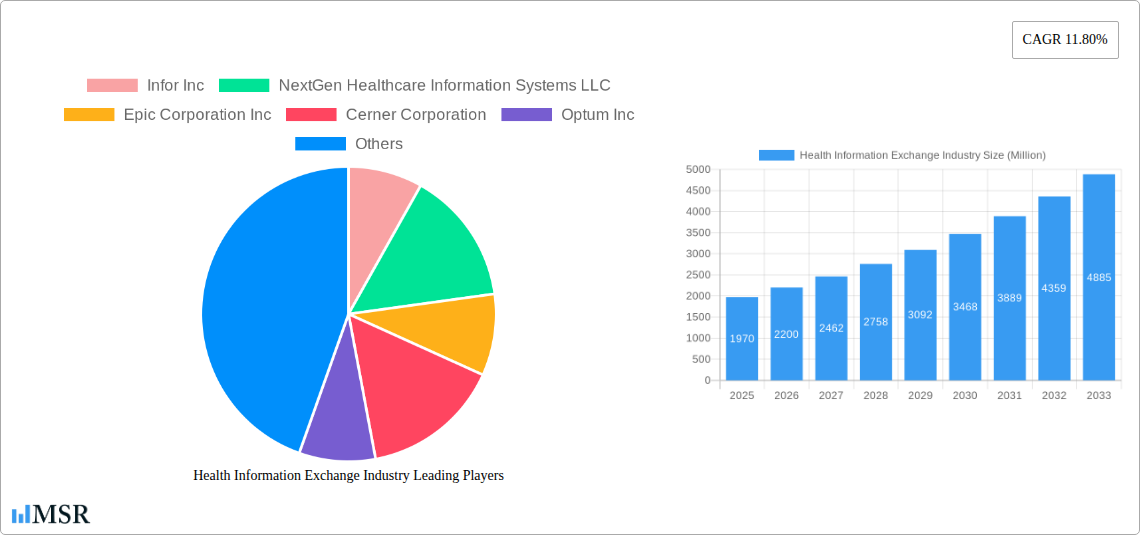
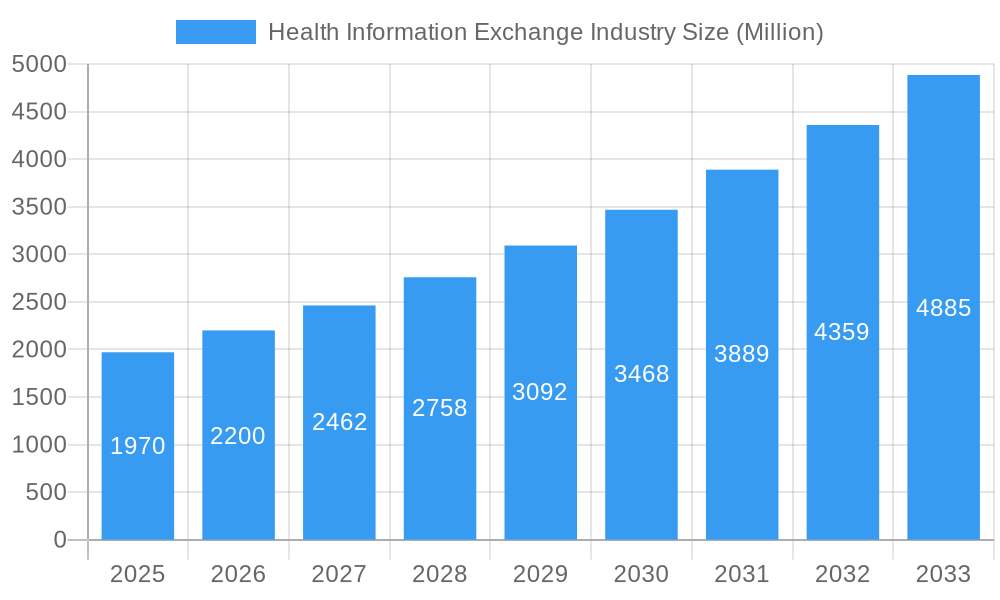
The Health Information Exchange (HIE) market is experiencing robust growth, projected to reach $1.97 billion in 2025 and maintain a Compound Annual Growth Rate (CAGR) of 11.80% from 2025 to 2033. This expansion is fueled by several key drivers. Increasing government mandates for interoperability and data sharing, coupled with the rising adoption of electronic health records (EHRs), are creating significant demand for HIE solutions. Furthermore, the need for improved patient care coordination, enhanced population health management, and reduced healthcare costs are accelerating market adoption. The market is segmented by implementation model (centralized, decentralized/federated, hybrid), setup type (private, public), application (internal interfacing, secure messaging, workflow management, web portal development, others), exchange type (direct, query-based, consumer-mediated), and component (EMPI, HPD, RLS, clinical data repository, others). Key players such as Infor, NextGen Healthcare, Epic, Cerner, and Optum are actively shaping the market landscape through innovation and strategic partnerships. North America currently holds a significant market share due to advanced healthcare infrastructure and regulatory support, but the Asia-Pacific region is expected to witness substantial growth in the coming years driven by increasing healthcare expenditure and technological advancements.
Health Information Exchange Industry Market Size (In Billion)
The diverse applications of HIE solutions across various healthcare settings contribute to its market expansion. Secure messaging capabilities are crucial for confidential communication between providers, while workflow management tools streamline operational efficiencies. Web portal development facilitates patient engagement and access to their health information, further driving adoption. The continued development of advanced analytics capabilities within HIE platforms promises to unlock even greater value in terms of predictive modeling, disease surveillance, and population health management. While challenges remain, including data security concerns and interoperability issues across different systems, the overall market outlook remains positive, supported by the ongoing focus on improving healthcare quality and efficiency. The ongoing trend towards value-based care further underscores the importance of seamless data exchange, solidifying the long-term growth potential of the HIE market.
Health Information Exchange Industry Company Market Share
Health Information Exchange (HIE) Industry: A Comprehensive Market Report (2019-2033)
This comprehensive report provides an in-depth analysis of the Health Information Exchange (HIE) industry, offering invaluable insights for stakeholders, investors, and industry professionals. The study period covers 2019-2033, with a base year of 2025 and a forecast period of 2025-2033. The report leverages rigorous market research methodologies to deliver actionable intelligence on market size, growth drivers, key segments, leading players, and emerging trends. The global HIE market is projected to reach xx Million by 2033, exhibiting a CAGR of xx% during the forecast period.
Health Information Exchange Industry Market Concentration & Dynamics
The HIE market exhibits a moderately concentrated landscape, with several major players holding significant market share. Infor Inc, NextGen Healthcare Information Systems LLC, Epic Corporation Inc, Cerner Corporation, and Optum Inc are among the leading vendors, collectively accounting for an estimated xx% of the market in 2025. However, the market also includes numerous smaller, specialized players, particularly in niche segments.
The industry's innovation ecosystem is dynamic, driven by advancements in cloud computing, artificial intelligence (AI), and big data analytics. Regulatory frameworks, such as HIPAA in the US and similar regulations globally, significantly impact market dynamics, creating both opportunities and challenges. Substitute products, such as standalone electronic health record (EHR) systems, pose some competition, while the increasing adoption of interoperability standards is driving HIE adoption. Mergers and acquisitions (M&A) are frequent, with xx M&A deals recorded between 2019 and 2024, indicating a consolidating market. End-user trends show a clear shift towards cloud-based HIE solutions and a growing demand for enhanced data security and interoperability.
- Market Share (2025): Top 5 players: xx%
- M&A Deal Count (2019-2024): xx
Health Information Exchange Industry Insights & Trends
The HIE market is experiencing robust growth, driven primarily by increasing government mandates for interoperability, rising healthcare costs, and the growing need for improved patient care coordination. Technological advancements, such as the increasing adoption of cloud-based solutions and AI-powered analytics, are further fueling market expansion. Evolving consumer behaviors, including increasing patient engagement and demand for personalized healthcare, are creating new opportunities for HIE providers. The global market size was valued at xx Million in 2025 and is projected to reach xx Million by 2033, driven by a compound annual growth rate (CAGR) of xx%. Challenges remain in addressing data security concerns and ensuring seamless data exchange across diverse healthcare systems.
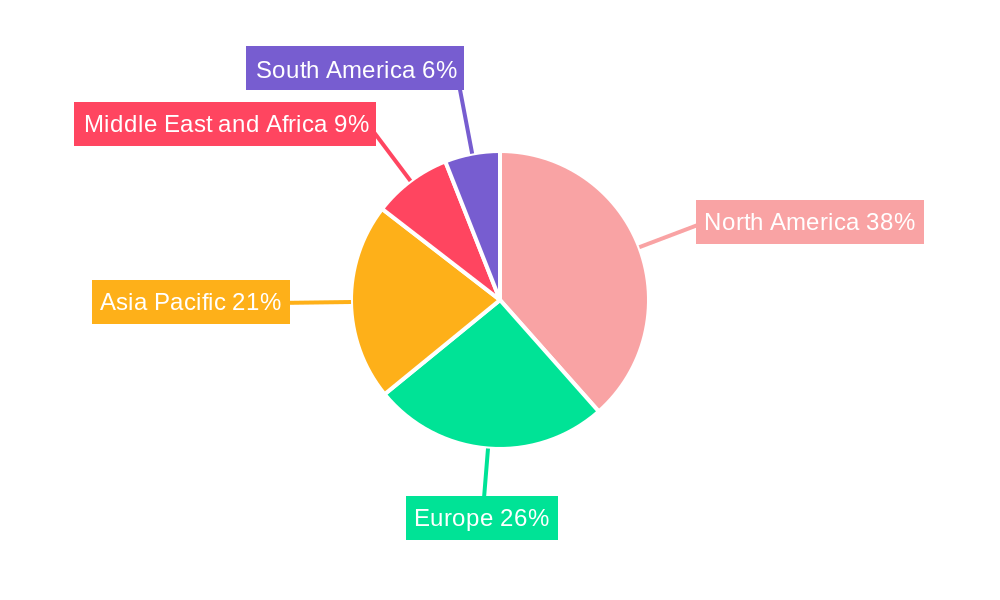
Key Markets & Segments Leading Health Information Exchange Industry
The North American region currently dominates the HIE market, driven by high healthcare expenditure, robust healthcare infrastructure, and advanced technological adoption. However, Asia-Pacific and Europe are experiencing significant growth, fuelled by increasing government initiatives and rising healthcare IT spending.
Leading Segments:
- Implementation Model: Decentralized/Federated models are gaining traction due to their flexibility and scalability.
- Setup Type: Private HIEs remain dominant, although public HIEs are growing in significance.
- Application: Secure messaging and workflow management are major application areas, followed by internal interfacing and web portal development.
- Exchange Type: Direct exchange is the most prevalent type, with query-based exchange growing in popularity.
- Component: Enterprise Master Person Index (EMPI) and Healthcare Provider Directory (HPD) are critical components, followed by Record Locator Service (RLS) and Clinical Data Repository.
- End User: Healthcare providers are the primary end users, followed by public health agencies.
Drivers:
- Strong government support and regulatory mandates for interoperability.
- Increasing healthcare costs and the need for cost-effective solutions.
- Growing demand for improved patient care coordination and data sharing.
- Technological advancements in cloud computing, AI, and big data analytics.
- Rising adoption of value-based care models.
Health Information Exchange Industry Product Developments
Recent product innovations focus on enhancing data security, improving interoperability through the use of FHIR standards, and incorporating advanced analytics capabilities. Cloud-based solutions with enhanced user interfaces and improved data visualization tools are gaining popularity. These advancements provide competitive edges by improving efficiency, reducing costs, and enhancing patient care.
Challenges in the Health Information Exchange Industry Market
Significant challenges include ensuring data security and privacy, addressing interoperability issues across different healthcare systems, complying with stringent regulatory requirements, and managing the complexity of data integration. These challenges impact market growth by slowing down adoption rates and increasing costs. For instance, the need for enhanced cybersecurity measures is estimated to increase costs by approximately xx Million annually.
Forces Driving Health Information Exchange Industry Growth
Key growth drivers include increasing government investments in healthcare IT, rising demand for improved patient outcomes, advancements in data analytics capabilities, and the growing adoption of cloud-based solutions. The increasing focus on value-based care and the need for better care coordination are also major growth catalysts.
Long-Term Growth Catalysts in the Health Information Exchange Industry
Long-term growth will be driven by innovations in AI-powered analytics for predictive healthcare, strategic partnerships between technology providers and healthcare organizations, and expansion into emerging markets with growing healthcare IT spending. The development of standardized APIs and integration platforms will further enhance interoperability and drive adoption.
Emerging Opportunities in Health Information Exchange Industry
Emerging opportunities lie in the development of innovative applications, such as personalized medicine and population health management, leveraging HIE data. Expansion into underserved markets and the integration of telehealth platforms with HIE systems offer significant potential. The development of blockchain-based solutions for secure data sharing represents a promising emerging trend.
Leading Players in the Health Information Exchange Industry Sector
Key Milestones in Health Information Exchange Industry Industry
- 2020: Increased adoption of FHIR standards for improved interoperability.
- 2021: Significant investments in AI and machine learning for HIE analytics.
- 2022: Launch of several cloud-based HIE solutions.
- 2023: Increased focus on data security and privacy regulations.
- 2024: Several mergers and acquisitions among HIE providers.
Strategic Outlook for Health Information Exchange Industry Market
The HIE market is poised for continued strong growth, driven by technological advancements and increasing demand for interoperable healthcare systems. Strategic opportunities lie in developing innovative solutions that address the evolving needs of healthcare providers and patients, focusing on data security, interoperability, and advanced analytics. The market's future potential is significant, with substantial growth expected in emerging markets and new application areas.
Health Information Exchange Industry Segmentation
-
1. Implementation Model
- 1.1. Centralized /Consolidated Models
- 1.2. Decentralized / Federated Models
- 1.3. Hybrid Model
-
2. Setup Type
- 2.1. Private
- 2.2. Public
-
3. Application
- 3.1. Internal Interfacing
- 3.2. Secure Messaging
- 3.3. Work Flow Management
- 3.4. Web portal Development
- 3.5. Other Applications
-
4. Exchange Type
- 4.1. Direct Exchange
- 4.2. Query-based Exchange
- 4.3. Consumer Mediated Exchange
-
5. Component
- 5.1. Enterprise Master Person Index (EMPI)
- 5.2. Healthcare Provider Directory (HPD)
- 5.3. Record Locator Service (RLS)
- 5.4. Clinical Data Repository
- 5.5. Other Components
-
6. End User
- 6.1. Public Health Agencies
- 6.2. Healthcare Providers
- 6.3. Others
Health Information Exchange Industry Segmentation By Geography
-
1. North America
- 1.1. United States
- 1.2. Canada
- 1.3. Mexico
-
2. Europe
- 2.1. Germany
- 2.2. United Kingdom
- 2.3. France
- 2.4. Italy
- 2.5. Spain
- 2.6. Rest of Europe
-
3. Asia Pacific
- 3.1. China
- 3.2. Japan
- 3.3. India
- 3.4. Australia
- 3.5. South Korea
- 3.6. Rest of Asia Pacific
-
4. Middle East and Africa
- 4.1. GCC
- 4.2. South Africa
- 4.3. Rest of Middle East and Africa
-
5. South America
- 5.1. Brazil
- 5.2. Argentina
- 5.3. Rest of South America
Health Information Exchange Industry Regional Market Share
Geographic Coverage of Health Information Exchange Industry
Health Information Exchange Industry REPORT HIGHLIGHTS
| Aspects | Details |
|---|---|
| Study Period | 2020-2034 |
| Base Year | 2025 |
| Estimated Year | 2026 |
| Forecast Period | 2026-2034 |
| Historical Period | 2020-2025 |
| Growth Rate | CAGR of 11.80% from 2020-2034 |
| Segmentation |
|
Table of Contents
- 1. Introduction
- 1.1. Research Scope
- 1.2. Market Segmentation
- 1.3. Research Objective
- 1.4. Definitions and Assumptions
- 2. Executive Summary
- 2.1. Market Snapshot
- 3. Market Dynamics
- 3.1. Market Drivers
- 3.2. Market Restrains
- 3.3. Market Trends
- 3.4. Market Opportunities
- 4. Market Factor Analysis
- 4.1. Porters Five Forces
- 4.1.1. Bargaining Power of Suppliers
- 4.1.2. Bargaining Power of Buyers
- 4.1.3. Threat of New Entrants
- 4.1.4. Threat of Substitutes
- 4.1.5. Competitive Rivalry
- 4.2. PESTEL analysis
- 4.3. BCG Analysis
- 4.3.1. Stars (High Growth, High Market Share)
- 4.3.2. Cash Cows (Low Growth, High Market Share)
- 4.3.3. Question Mark (High Growth, Low Market Share)
- 4.3.4. Dogs (Low Growth, Low Market Share)
- 4.4. Ansoff Matrix Analysis
- 4.5. Supply Chain Analysis
- 4.6. Regulatory Landscape
- 4.7. Current Market Potential and Opportunity Assessment (TAM–SAM–SOM Framework)
- 4.8. MSR Analyst Note
- 4.1. Porters Five Forces
- 5. Market Analysis, Insights and Forecast 2021-2033
- 5.1. Market Analysis, Insights and Forecast - by Implementation Model
- 5.1.1. Centralized /Consolidated Models
- 5.1.2. Decentralized / Federated Models
- 5.1.3. Hybrid Model
- 5.2. Market Analysis, Insights and Forecast - by Setup Type
- 5.2.1. Private
- 5.2.2. Public
- 5.3. Market Analysis, Insights and Forecast - by Application
- 5.3.1. Internal Interfacing
- 5.3.2. Secure Messaging
- 5.3.3. Work Flow Management
- 5.3.4. Web portal Development
- 5.3.5. Other Applications
- 5.4. Market Analysis, Insights and Forecast - by Exchange Type
- 5.4.1. Direct Exchange
- 5.4.2. Query-based Exchange
- 5.4.3. Consumer Mediated Exchange
- 5.5. Market Analysis, Insights and Forecast - by Component
- 5.5.1. Enterprise Master Person Index (EMPI)
- 5.5.2. Healthcare Provider Directory (HPD)
- 5.5.3. Record Locator Service (RLS)
- 5.5.4. Clinical Data Repository
- 5.5.5. Other Components
- 5.6. Market Analysis, Insights and Forecast - by End User
- 5.6.1. Public Health Agencies
- 5.6.2. Healthcare Providers
- 5.6.3. Others
- 5.7. Market Analysis, Insights and Forecast - by Region
- 5.7.1. North America
- 5.7.2. Europe
- 5.7.3. Asia Pacific
- 5.7.4. Middle East and Africa
- 5.7.5. South America
- 5.1. Market Analysis, Insights and Forecast - by Implementation Model
- 6. Global Health Information Exchange Industry Analysis, Insights and Forecast, 2021-2033
- 6.1. Market Analysis, Insights and Forecast - by Implementation Model
- 6.1.1. Centralized /Consolidated Models
- 6.1.2. Decentralized / Federated Models
- 6.1.3. Hybrid Model
- 6.2. Market Analysis, Insights and Forecast - by Setup Type
- 6.2.1. Private
- 6.2.2. Public
- 6.3. Market Analysis, Insights and Forecast - by Application
- 6.3.1. Internal Interfacing
- 6.3.2. Secure Messaging
- 6.3.3. Work Flow Management
- 6.3.4. Web portal Development
- 6.3.5. Other Applications
- 6.4. Market Analysis, Insights and Forecast - by Exchange Type
- 6.4.1. Direct Exchange
- 6.4.2. Query-based Exchange
- 6.4.3. Consumer Mediated Exchange
- 6.5. Market Analysis, Insights and Forecast - by Component
- 6.5.1. Enterprise Master Person Index (EMPI)
- 6.5.2. Healthcare Provider Directory (HPD)
- 6.5.3. Record Locator Service (RLS)
- 6.5.4. Clinical Data Repository
- 6.5.5. Other Components
- 6.6. Market Analysis, Insights and Forecast - by End User
- 6.6.1. Public Health Agencies
- 6.6.2. Healthcare Providers
- 6.6.3. Others
- 6.1. Market Analysis, Insights and Forecast - by Implementation Model
- 7. North America Health Information Exchange Industry Analysis, Insights and Forecast, 2020-2032
- 7.1. Market Analysis, Insights and Forecast - by Implementation Model
- 7.1.1. Centralized /Consolidated Models
- 7.1.2. Decentralized / Federated Models
- 7.1.3. Hybrid Model
- 7.2. Market Analysis, Insights and Forecast - by Setup Type
- 7.2.1. Private
- 7.2.2. Public
- 7.3. Market Analysis, Insights and Forecast - by Application
- 7.3.1. Internal Interfacing
- 7.3.2. Secure Messaging
- 7.3.3. Work Flow Management
- 7.3.4. Web portal Development
- 7.3.5. Other Applications
- 7.4. Market Analysis, Insights and Forecast - by Exchange Type
- 7.4.1. Direct Exchange
- 7.4.2. Query-based Exchange
- 7.4.3. Consumer Mediated Exchange
- 7.5. Market Analysis, Insights and Forecast - by Component
- 7.5.1. Enterprise Master Person Index (EMPI)
- 7.5.2. Healthcare Provider Directory (HPD)
- 7.5.3. Record Locator Service (RLS)
- 7.5.4. Clinical Data Repository
- 7.5.5. Other Components
- 7.6. Market Analysis, Insights and Forecast - by End User
- 7.6.1. Public Health Agencies
- 7.6.2. Healthcare Providers
- 7.6.3. Others
- 7.1. Market Analysis, Insights and Forecast - by Implementation Model
- 8. Europe Health Information Exchange Industry Analysis, Insights and Forecast, 2020-2032
- 8.1. Market Analysis, Insights and Forecast - by Implementation Model
- 8.1.1. Centralized /Consolidated Models
- 8.1.2. Decentralized / Federated Models
- 8.1.3. Hybrid Model
- 8.2. Market Analysis, Insights and Forecast - by Setup Type
- 8.2.1. Private
- 8.2.2. Public
- 8.3. Market Analysis, Insights and Forecast - by Application
- 8.3.1. Internal Interfacing
- 8.3.2. Secure Messaging
- 8.3.3. Work Flow Management
- 8.3.4. Web portal Development
- 8.3.5. Other Applications
- 8.4. Market Analysis, Insights and Forecast - by Exchange Type
- 8.4.1. Direct Exchange
- 8.4.2. Query-based Exchange
- 8.4.3. Consumer Mediated Exchange
- 8.5. Market Analysis, Insights and Forecast - by Component
- 8.5.1. Enterprise Master Person Index (EMPI)
- 8.5.2. Healthcare Provider Directory (HPD)
- 8.5.3. Record Locator Service (RLS)
- 8.5.4. Clinical Data Repository
- 8.5.5. Other Components
- 8.6. Market Analysis, Insights and Forecast - by End User
- 8.6.1. Public Health Agencies
- 8.6.2. Healthcare Providers
- 8.6.3. Others
- 8.1. Market Analysis, Insights and Forecast - by Implementation Model
- 9. Asia Pacific Health Information Exchange Industry Analysis, Insights and Forecast, 2020-2032
- 9.1. Market Analysis, Insights and Forecast - by Implementation Model
- 9.1.1. Centralized /Consolidated Models
- 9.1.2. Decentralized / Federated Models
- 9.1.3. Hybrid Model
- 9.2. Market Analysis, Insights and Forecast - by Setup Type
- 9.2.1. Private
- 9.2.2. Public
- 9.3. Market Analysis, Insights and Forecast - by Application
- 9.3.1. Internal Interfacing
- 9.3.2. Secure Messaging
- 9.3.3. Work Flow Management
- 9.3.4. Web portal Development
- 9.3.5. Other Applications
- 9.4. Market Analysis, Insights and Forecast - by Exchange Type
- 9.4.1. Direct Exchange
- 9.4.2. Query-based Exchange
- 9.4.3. Consumer Mediated Exchange
- 9.5. Market Analysis, Insights and Forecast - by Component
- 9.5.1. Enterprise Master Person Index (EMPI)
- 9.5.2. Healthcare Provider Directory (HPD)
- 9.5.3. Record Locator Service (RLS)
- 9.5.4. Clinical Data Repository
- 9.5.5. Other Components
- 9.6. Market Analysis, Insights and Forecast - by End User
- 9.6.1. Public Health Agencies
- 9.6.2. Healthcare Providers
- 9.6.3. Others
- 9.1. Market Analysis, Insights and Forecast - by Implementation Model
- 10. Middle East and Africa Health Information Exchange Industry Analysis, Insights and Forecast, 2020-2032
- 10.1. Market Analysis, Insights and Forecast - by Implementation Model
- 10.1.1. Centralized /Consolidated Models
- 10.1.2. Decentralized / Federated Models
- 10.1.3. Hybrid Model
- 10.2. Market Analysis, Insights and Forecast - by Setup Type
- 10.2.1. Private
- 10.2.2. Public
- 10.3. Market Analysis, Insights and Forecast - by Application
- 10.3.1. Internal Interfacing
- 10.3.2. Secure Messaging
- 10.3.3. Work Flow Management
- 10.3.4. Web portal Development
- 10.3.5. Other Applications
- 10.4. Market Analysis, Insights and Forecast - by Exchange Type
- 10.4.1. Direct Exchange
- 10.4.2. Query-based Exchange
- 10.4.3. Consumer Mediated Exchange
- 10.5. Market Analysis, Insights and Forecast - by Component
- 10.5.1. Enterprise Master Person Index (EMPI)
- 10.5.2. Healthcare Provider Directory (HPD)
- 10.5.3. Record Locator Service (RLS)
- 10.5.4. Clinical Data Repository
- 10.5.5. Other Components
- 10.6. Market Analysis, Insights and Forecast - by End User
- 10.6.1. Public Health Agencies
- 10.6.2. Healthcare Providers
- 10.6.3. Others
- 10.1. Market Analysis, Insights and Forecast - by Implementation Model
- 11. South America Health Information Exchange Industry Analysis, Insights and Forecast, 2020-2032
- 11.1. Market Analysis, Insights and Forecast - by Implementation Model
- 11.1.1. Centralized /Consolidated Models
- 11.1.2. Decentralized / Federated Models
- 11.1.3. Hybrid Model
- 11.2. Market Analysis, Insights and Forecast - by Setup Type
- 11.2.1. Private
- 11.2.2. Public
- 11.3. Market Analysis, Insights and Forecast - by Application
- 11.3.1. Internal Interfacing
- 11.3.2. Secure Messaging
- 11.3.3. Work Flow Management
- 11.3.4. Web portal Development
- 11.3.5. Other Applications
- 11.4. Market Analysis, Insights and Forecast - by Exchange Type
- 11.4.1. Direct Exchange
- 11.4.2. Query-based Exchange
- 11.4.3. Consumer Mediated Exchange
- 11.5. Market Analysis, Insights and Forecast - by Component
- 11.5.1. Enterprise Master Person Index (EMPI)
- 11.5.2. Healthcare Provider Directory (HPD)
- 11.5.3. Record Locator Service (RLS)
- 11.5.4. Clinical Data Repository
- 11.5.5. Other Components
- 11.6. Market Analysis, Insights and Forecast - by End User
- 11.6.1. Public Health Agencies
- 11.6.2. Healthcare Providers
- 11.6.3. Others
- 11.1. Market Analysis, Insights and Forecast - by Implementation Model
- 12. Competitive Analysis
- 12.1. Company Profiles
- 12.1.1 Infor Inc
- 12.1.1.1. Company Overview
- 12.1.1.2. Products
- 12.1.1.3. Company Financials
- 12.1.1.4. SWOT Analysis
- 12.1.2 NextGen Healthcare Information Systems LLC
- 12.1.2.1. Company Overview
- 12.1.2.2. Products
- 12.1.2.3. Company Financials
- 12.1.2.4. SWOT Analysis
- 12.1.3 Epic Corporation Inc
- 12.1.3.1. Company Overview
- 12.1.3.2. Products
- 12.1.3.3. Company Financials
- 12.1.3.4. SWOT Analysis
- 12.1.4 Cerner Corporation
- 12.1.4.1. Company Overview
- 12.1.4.2. Products
- 12.1.4.3. Company Financials
- 12.1.4.4. SWOT Analysis
- 12.1.5 Optum Inc
- 12.1.5.1. Company Overview
- 12.1.5.2. Products
- 12.1.5.3. Company Financials
- 12.1.5.4. SWOT Analysis
- 12.1.6 Open Text Corporation
- 12.1.6.1. Company Overview
- 12.1.6.2. Products
- 12.1.6.3. Company Financials
- 12.1.6.4. SWOT Analysis
- 12.1.7 Allscripts Healthcare Solutions Inc
- 12.1.7.1. Company Overview
- 12.1.7.2. Products
- 12.1.7.3. Company Financials
- 12.1.7.4. SWOT Analysis
- 12.1.8 Conifer Health Solutions
- 12.1.8.1. Company Overview
- 12.1.8.2. Products
- 12.1.8.3. Company Financials
- 12.1.8.4. SWOT Analysis
- 12.1.9 Medicity Inc
- 12.1.9.1. Company Overview
- 12.1.9.2. Products
- 12.1.9.3. Company Financials
- 12.1.9.4. SWOT Analysis
- 12.1.10 Orion Health
- 12.1.10.1. Company Overview
- 12.1.10.2. Products
- 12.1.10.3. Company Financials
- 12.1.10.4. SWOT Analysis
- 12.1.1 Infor Inc
- 12.2. Market Entropy
- 12.2.1 Company's Key Areas Served
- 12.2.2 Recent Developments
- 12.3. Company Market Share Analysis 2025
- 12.3.1 Top 5 Companies Market Share Analysis
- 12.3.2 Top 3 Companies Market Share Analysis
- 12.4. List of Potential Customers
- 13. Research Methodology
List of Figures
- Figure 1: Global Health Information Exchange Industry Revenue Breakdown (Million, %) by Region 2025 & 2033
- Figure 2: Global Health Information Exchange Industry Volume Breakdown (K Unit, %) by Region 2025 & 2033
- Figure 3: North America Health Information Exchange Industry Revenue (Million), by Implementation Model 2025 & 2033
- Figure 4: North America Health Information Exchange Industry Volume (K Unit), by Implementation Model 2025 & 2033
- Figure 5: North America Health Information Exchange Industry Revenue Share (%), by Implementation Model 2025 & 2033
- Figure 6: North America Health Information Exchange Industry Volume Share (%), by Implementation Model 2025 & 2033
- Figure 7: North America Health Information Exchange Industry Revenue (Million), by Setup Type 2025 & 2033
- Figure 8: North America Health Information Exchange Industry Volume (K Unit), by Setup Type 2025 & 2033
- Figure 9: North America Health Information Exchange Industry Revenue Share (%), by Setup Type 2025 & 2033
- Figure 10: North America Health Information Exchange Industry Volume Share (%), by Setup Type 2025 & 2033
- Figure 11: North America Health Information Exchange Industry Revenue (Million), by Application 2025 & 2033
- Figure 12: North America Health Information Exchange Industry Volume (K Unit), by Application 2025 & 2033
- Figure 13: North America Health Information Exchange Industry Revenue Share (%), by Application 2025 & 2033
- Figure 14: North America Health Information Exchange Industry Volume Share (%), by Application 2025 & 2033
- Figure 15: North America Health Information Exchange Industry Revenue (Million), by Exchange Type 2025 & 2033
- Figure 16: North America Health Information Exchange Industry Volume (K Unit), by Exchange Type 2025 & 2033
- Figure 17: North America Health Information Exchange Industry Revenue Share (%), by Exchange Type 2025 & 2033
- Figure 18: North America Health Information Exchange Industry Volume Share (%), by Exchange Type 2025 & 2033
- Figure 19: North America Health Information Exchange Industry Revenue (Million), by Component 2025 & 2033
- Figure 20: North America Health Information Exchange Industry Volume (K Unit), by Component 2025 & 2033
- Figure 21: North America Health Information Exchange Industry Revenue Share (%), by Component 2025 & 2033
- Figure 22: North America Health Information Exchange Industry Volume Share (%), by Component 2025 & 2033
- Figure 23: North America Health Information Exchange Industry Revenue (Million), by End User 2025 & 2033
- Figure 24: North America Health Information Exchange Industry Volume (K Unit), by End User 2025 & 2033
- Figure 25: North America Health Information Exchange Industry Revenue Share (%), by End User 2025 & 2033
- Figure 26: North America Health Information Exchange Industry Volume Share (%), by End User 2025 & 2033
- Figure 27: North America Health Information Exchange Industry Revenue (Million), by Country 2025 & 2033
- Figure 28: North America Health Information Exchange Industry Volume (K Unit), by Country 2025 & 2033
- Figure 29: North America Health Information Exchange Industry Revenue Share (%), by Country 2025 & 2033
- Figure 30: North America Health Information Exchange Industry Volume Share (%), by Country 2025 & 2033
- Figure 31: Europe Health Information Exchange Industry Revenue (Million), by Implementation Model 2025 & 2033
- Figure 32: Europe Health Information Exchange Industry Volume (K Unit), by Implementation Model 2025 & 2033
- Figure 33: Europe Health Information Exchange Industry Revenue Share (%), by Implementation Model 2025 & 2033
- Figure 34: Europe Health Information Exchange Industry Volume Share (%), by Implementation Model 2025 & 2033
- Figure 35: Europe Health Information Exchange Industry Revenue (Million), by Setup Type 2025 & 2033
- Figure 36: Europe Health Information Exchange Industry Volume (K Unit), by Setup Type 2025 & 2033
- Figure 37: Europe Health Information Exchange Industry Revenue Share (%), by Setup Type 2025 & 2033
- Figure 38: Europe Health Information Exchange Industry Volume Share (%), by Setup Type 2025 & 2033
- Figure 39: Europe Health Information Exchange Industry Revenue (Million), by Application 2025 & 2033
- Figure 40: Europe Health Information Exchange Industry Volume (K Unit), by Application 2025 & 2033
- Figure 41: Europe Health Information Exchange Industry Revenue Share (%), by Application 2025 & 2033
- Figure 42: Europe Health Information Exchange Industry Volume Share (%), by Application 2025 & 2033
- Figure 43: Europe Health Information Exchange Industry Revenue (Million), by Exchange Type 2025 & 2033
- Figure 44: Europe Health Information Exchange Industry Volume (K Unit), by Exchange Type 2025 & 2033
- Figure 45: Europe Health Information Exchange Industry Revenue Share (%), by Exchange Type 2025 & 2033
- Figure 46: Europe Health Information Exchange Industry Volume Share (%), by Exchange Type 2025 & 2033
- Figure 47: Europe Health Information Exchange Industry Revenue (Million), by Component 2025 & 2033
- Figure 48: Europe Health Information Exchange Industry Volume (K Unit), by Component 2025 & 2033
- Figure 49: Europe Health Information Exchange Industry Revenue Share (%), by Component 2025 & 2033
- Figure 50: Europe Health Information Exchange Industry Volume Share (%), by Component 2025 & 2033
- Figure 51: Europe Health Information Exchange Industry Revenue (Million), by End User 2025 & 2033
- Figure 52: Europe Health Information Exchange Industry Volume (K Unit), by End User 2025 & 2033
- Figure 53: Europe Health Information Exchange Industry Revenue Share (%), by End User 2025 & 2033
- Figure 54: Europe Health Information Exchange Industry Volume Share (%), by End User 2025 & 2033
- Figure 55: Europe Health Information Exchange Industry Revenue (Million), by Country 2025 & 2033
- Figure 56: Europe Health Information Exchange Industry Volume (K Unit), by Country 2025 & 2033
- Figure 57: Europe Health Information Exchange Industry Revenue Share (%), by Country 2025 & 2033
- Figure 58: Europe Health Information Exchange Industry Volume Share (%), by Country 2025 & 2033
- Figure 59: Asia Pacific Health Information Exchange Industry Revenue (Million), by Implementation Model 2025 & 2033
- Figure 60: Asia Pacific Health Information Exchange Industry Volume (K Unit), by Implementation Model 2025 & 2033
- Figure 61: Asia Pacific Health Information Exchange Industry Revenue Share (%), by Implementation Model 2025 & 2033
- Figure 62: Asia Pacific Health Information Exchange Industry Volume Share (%), by Implementation Model 2025 & 2033
- Figure 63: Asia Pacific Health Information Exchange Industry Revenue (Million), by Setup Type 2025 & 2033
- Figure 64: Asia Pacific Health Information Exchange Industry Volume (K Unit), by Setup Type 2025 & 2033
- Figure 65: Asia Pacific Health Information Exchange Industry Revenue Share (%), by Setup Type 2025 & 2033
- Figure 66: Asia Pacific Health Information Exchange Industry Volume Share (%), by Setup Type 2025 & 2033
- Figure 67: Asia Pacific Health Information Exchange Industry Revenue (Million), by Application 2025 & 2033
- Figure 68: Asia Pacific Health Information Exchange Industry Volume (K Unit), by Application 2025 & 2033
- Figure 69: Asia Pacific Health Information Exchange Industry Revenue Share (%), by Application 2025 & 2033
- Figure 70: Asia Pacific Health Information Exchange Industry Volume Share (%), by Application 2025 & 2033
- Figure 71: Asia Pacific Health Information Exchange Industry Revenue (Million), by Exchange Type 2025 & 2033
- Figure 72: Asia Pacific Health Information Exchange Industry Volume (K Unit), by Exchange Type 2025 & 2033
- Figure 73: Asia Pacific Health Information Exchange Industry Revenue Share (%), by Exchange Type 2025 & 2033
- Figure 74: Asia Pacific Health Information Exchange Industry Volume Share (%), by Exchange Type 2025 & 2033
- Figure 75: Asia Pacific Health Information Exchange Industry Revenue (Million), by Component 2025 & 2033
- Figure 76: Asia Pacific Health Information Exchange Industry Volume (K Unit), by Component 2025 & 2033
- Figure 77: Asia Pacific Health Information Exchange Industry Revenue Share (%), by Component 2025 & 2033
- Figure 78: Asia Pacific Health Information Exchange Industry Volume Share (%), by Component 2025 & 2033
- Figure 79: Asia Pacific Health Information Exchange Industry Revenue (Million), by End User 2025 & 2033
- Figure 80: Asia Pacific Health Information Exchange Industry Volume (K Unit), by End User 2025 & 2033
- Figure 81: Asia Pacific Health Information Exchange Industry Revenue Share (%), by End User 2025 & 2033
- Figure 82: Asia Pacific Health Information Exchange Industry Volume Share (%), by End User 2025 & 2033
- Figure 83: Asia Pacific Health Information Exchange Industry Revenue (Million), by Country 2025 & 2033
- Figure 84: Asia Pacific Health Information Exchange Industry Volume (K Unit), by Country 2025 & 2033
- Figure 85: Asia Pacific Health Information Exchange Industry Revenue Share (%), by Country 2025 & 2033
- Figure 86: Asia Pacific Health Information Exchange Industry Volume Share (%), by Country 2025 & 2033
- Figure 87: Middle East and Africa Health Information Exchange Industry Revenue (Million), by Implementation Model 2025 & 2033
- Figure 88: Middle East and Africa Health Information Exchange Industry Volume (K Unit), by Implementation Model 2025 & 2033
- Figure 89: Middle East and Africa Health Information Exchange Industry Revenue Share (%), by Implementation Model 2025 & 2033
- Figure 90: Middle East and Africa Health Information Exchange Industry Volume Share (%), by Implementation Model 2025 & 2033
- Figure 91: Middle East and Africa Health Information Exchange Industry Revenue (Million), by Setup Type 2025 & 2033
- Figure 92: Middle East and Africa Health Information Exchange Industry Volume (K Unit), by Setup Type 2025 & 2033
- Figure 93: Middle East and Africa Health Information Exchange Industry Revenue Share (%), by Setup Type 2025 & 2033
- Figure 94: Middle East and Africa Health Information Exchange Industry Volume Share (%), by Setup Type 2025 & 2033
- Figure 95: Middle East and Africa Health Information Exchange Industry Revenue (Million), by Application 2025 & 2033
- Figure 96: Middle East and Africa Health Information Exchange Industry Volume (K Unit), by Application 2025 & 2033
- Figure 97: Middle East and Africa Health Information Exchange Industry Revenue Share (%), by Application 2025 & 2033
- Figure 98: Middle East and Africa Health Information Exchange Industry Volume Share (%), by Application 2025 & 2033
- Figure 99: Middle East and Africa Health Information Exchange Industry Revenue (Million), by Exchange Type 2025 & 2033
- Figure 100: Middle East and Africa Health Information Exchange Industry Volume (K Unit), by Exchange Type 2025 & 2033
- Figure 101: Middle East and Africa Health Information Exchange Industry Revenue Share (%), by Exchange Type 2025 & 2033
- Figure 102: Middle East and Africa Health Information Exchange Industry Volume Share (%), by Exchange Type 2025 & 2033
- Figure 103: Middle East and Africa Health Information Exchange Industry Revenue (Million), by Component 2025 & 2033
- Figure 104: Middle East and Africa Health Information Exchange Industry Volume (K Unit), by Component 2025 & 2033
- Figure 105: Middle East and Africa Health Information Exchange Industry Revenue Share (%), by Component 2025 & 2033
- Figure 106: Middle East and Africa Health Information Exchange Industry Volume Share (%), by Component 2025 & 2033
- Figure 107: Middle East and Africa Health Information Exchange Industry Revenue (Million), by End User 2025 & 2033
- Figure 108: Middle East and Africa Health Information Exchange Industry Volume (K Unit), by End User 2025 & 2033
- Figure 109: Middle East and Africa Health Information Exchange Industry Revenue Share (%), by End User 2025 & 2033
- Figure 110: Middle East and Africa Health Information Exchange Industry Volume Share (%), by End User 2025 & 2033
- Figure 111: Middle East and Africa Health Information Exchange Industry Revenue (Million), by Country 2025 & 2033
- Figure 112: Middle East and Africa Health Information Exchange Industry Volume (K Unit), by Country 2025 & 2033
- Figure 113: Middle East and Africa Health Information Exchange Industry Revenue Share (%), by Country 2025 & 2033
- Figure 114: Middle East and Africa Health Information Exchange Industry Volume Share (%), by Country 2025 & 2033
- Figure 115: South America Health Information Exchange Industry Revenue (Million), by Implementation Model 2025 & 2033
- Figure 116: South America Health Information Exchange Industry Volume (K Unit), by Implementation Model 2025 & 2033
- Figure 117: South America Health Information Exchange Industry Revenue Share (%), by Implementation Model 2025 & 2033
- Figure 118: South America Health Information Exchange Industry Volume Share (%), by Implementation Model 2025 & 2033
- Figure 119: South America Health Information Exchange Industry Revenue (Million), by Setup Type 2025 & 2033
- Figure 120: South America Health Information Exchange Industry Volume (K Unit), by Setup Type 2025 & 2033
- Figure 121: South America Health Information Exchange Industry Revenue Share (%), by Setup Type 2025 & 2033
- Figure 122: South America Health Information Exchange Industry Volume Share (%), by Setup Type 2025 & 2033
- Figure 123: South America Health Information Exchange Industry Revenue (Million), by Application 2025 & 2033
- Figure 124: South America Health Information Exchange Industry Volume (K Unit), by Application 2025 & 2033
- Figure 125: South America Health Information Exchange Industry Revenue Share (%), by Application 2025 & 2033
- Figure 126: South America Health Information Exchange Industry Volume Share (%), by Application 2025 & 2033
- Figure 127: South America Health Information Exchange Industry Revenue (Million), by Exchange Type 2025 & 2033
- Figure 128: South America Health Information Exchange Industry Volume (K Unit), by Exchange Type 2025 & 2033
- Figure 129: South America Health Information Exchange Industry Revenue Share (%), by Exchange Type 2025 & 2033
- Figure 130: South America Health Information Exchange Industry Volume Share (%), by Exchange Type 2025 & 2033
- Figure 131: South America Health Information Exchange Industry Revenue (Million), by Component 2025 & 2033
- Figure 132: South America Health Information Exchange Industry Volume (K Unit), by Component 2025 & 2033
- Figure 133: South America Health Information Exchange Industry Revenue Share (%), by Component 2025 & 2033
- Figure 134: South America Health Information Exchange Industry Volume Share (%), by Component 2025 & 2033
- Figure 135: South America Health Information Exchange Industry Revenue (Million), by End User 2025 & 2033
- Figure 136: South America Health Information Exchange Industry Volume (K Unit), by End User 2025 & 2033
- Figure 137: South America Health Information Exchange Industry Revenue Share (%), by End User 2025 & 2033
- Figure 138: South America Health Information Exchange Industry Volume Share (%), by End User 2025 & 2033
- Figure 139: South America Health Information Exchange Industry Revenue (Million), by Country 2025 & 2033
- Figure 140: South America Health Information Exchange Industry Volume (K Unit), by Country 2025 & 2033
- Figure 141: South America Health Information Exchange Industry Revenue Share (%), by Country 2025 & 2033
- Figure 142: South America Health Information Exchange Industry Volume Share (%), by Country 2025 & 2033
List of Tables
- Table 1: Global Health Information Exchange Industry Revenue Million Forecast, by Implementation Model 2020 & 2033
- Table 2: Global Health Information Exchange Industry Volume K Unit Forecast, by Implementation Model 2020 & 2033
- Table 3: Global Health Information Exchange Industry Revenue Million Forecast, by Setup Type 2020 & 2033
- Table 4: Global Health Information Exchange Industry Volume K Unit Forecast, by Setup Type 2020 & 2033
- Table 5: Global Health Information Exchange Industry Revenue Million Forecast, by Application 2020 & 2033
- Table 6: Global Health Information Exchange Industry Volume K Unit Forecast, by Application 2020 & 2033
- Table 7: Global Health Information Exchange Industry Revenue Million Forecast, by Exchange Type 2020 & 2033
- Table 8: Global Health Information Exchange Industry Volume K Unit Forecast, by Exchange Type 2020 & 2033
- Table 9: Global Health Information Exchange Industry Revenue Million Forecast, by Component 2020 & 2033
- Table 10: Global Health Information Exchange Industry Volume K Unit Forecast, by Component 2020 & 2033
- Table 11: Global Health Information Exchange Industry Revenue Million Forecast, by End User 2020 & 2033
- Table 12: Global Health Information Exchange Industry Volume K Unit Forecast, by End User 2020 & 2033
- Table 13: Global Health Information Exchange Industry Revenue Million Forecast, by Region 2020 & 2033
- Table 14: Global Health Information Exchange Industry Volume K Unit Forecast, by Region 2020 & 2033
- Table 15: Global Health Information Exchange Industry Revenue Million Forecast, by Implementation Model 2020 & 2033
- Table 16: Global Health Information Exchange Industry Volume K Unit Forecast, by Implementation Model 2020 & 2033
- Table 17: Global Health Information Exchange Industry Revenue Million Forecast, by Setup Type 2020 & 2033
- Table 18: Global Health Information Exchange Industry Volume K Unit Forecast, by Setup Type 2020 & 2033
- Table 19: Global Health Information Exchange Industry Revenue Million Forecast, by Application 2020 & 2033
- Table 20: Global Health Information Exchange Industry Volume K Unit Forecast, by Application 2020 & 2033
- Table 21: Global Health Information Exchange Industry Revenue Million Forecast, by Exchange Type 2020 & 2033
- Table 22: Global Health Information Exchange Industry Volume K Unit Forecast, by Exchange Type 2020 & 2033
- Table 23: Global Health Information Exchange Industry Revenue Million Forecast, by Component 2020 & 2033
- Table 24: Global Health Information Exchange Industry Volume K Unit Forecast, by Component 2020 & 2033
- Table 25: Global Health Information Exchange Industry Revenue Million Forecast, by End User 2020 & 2033
- Table 26: Global Health Information Exchange Industry Volume K Unit Forecast, by End User 2020 & 2033
- Table 27: Global Health Information Exchange Industry Revenue Million Forecast, by Country 2020 & 2033
- Table 28: Global Health Information Exchange Industry Volume K Unit Forecast, by Country 2020 & 2033
- Table 29: United States Health Information Exchange Industry Revenue (Million) Forecast, by Application 2020 & 2033
- Table 30: United States Health Information Exchange Industry Volume (K Unit) Forecast, by Application 2020 & 2033
- Table 31: Canada Health Information Exchange Industry Revenue (Million) Forecast, by Application 2020 & 2033
- Table 32: Canada Health Information Exchange Industry Volume (K Unit) Forecast, by Application 2020 & 2033
- Table 33: Mexico Health Information Exchange Industry Revenue (Million) Forecast, by Application 2020 & 2033
- Table 34: Mexico Health Information Exchange Industry Volume (K Unit) Forecast, by Application 2020 & 2033
- Table 35: Global Health Information Exchange Industry Revenue Million Forecast, by Implementation Model 2020 & 2033
- Table 36: Global Health Information Exchange Industry Volume K Unit Forecast, by Implementation Model 2020 & 2033
- Table 37: Global Health Information Exchange Industry Revenue Million Forecast, by Setup Type 2020 & 2033
- Table 38: Global Health Information Exchange Industry Volume K Unit Forecast, by Setup Type 2020 & 2033
- Table 39: Global Health Information Exchange Industry Revenue Million Forecast, by Application 2020 & 2033
- Table 40: Global Health Information Exchange Industry Volume K Unit Forecast, by Application 2020 & 2033
- Table 41: Global Health Information Exchange Industry Revenue Million Forecast, by Exchange Type 2020 & 2033
- Table 42: Global Health Information Exchange Industry Volume K Unit Forecast, by Exchange Type 2020 & 2033
- Table 43: Global Health Information Exchange Industry Revenue Million Forecast, by Component 2020 & 2033
- Table 44: Global Health Information Exchange Industry Volume K Unit Forecast, by Component 2020 & 2033
- Table 45: Global Health Information Exchange Industry Revenue Million Forecast, by End User 2020 & 2033
- Table 46: Global Health Information Exchange Industry Volume K Unit Forecast, by End User 2020 & 2033
- Table 47: Global Health Information Exchange Industry Revenue Million Forecast, by Country 2020 & 2033
- Table 48: Global Health Information Exchange Industry Volume K Unit Forecast, by Country 2020 & 2033
- Table 49: Germany Health Information Exchange Industry Revenue (Million) Forecast, by Application 2020 & 2033
- Table 50: Germany Health Information Exchange Industry Volume (K Unit) Forecast, by Application 2020 & 2033
- Table 51: United Kingdom Health Information Exchange Industry Revenue (Million) Forecast, by Application 2020 & 2033
- Table 52: United Kingdom Health Information Exchange Industry Volume (K Unit) Forecast, by Application 2020 & 2033
- Table 53: France Health Information Exchange Industry Revenue (Million) Forecast, by Application 2020 & 2033
- Table 54: France Health Information Exchange Industry Volume (K Unit) Forecast, by Application 2020 & 2033
- Table 55: Italy Health Information Exchange Industry Revenue (Million) Forecast, by Application 2020 & 2033
- Table 56: Italy Health Information Exchange Industry Volume (K Unit) Forecast, by Application 2020 & 2033
- Table 57: Spain Health Information Exchange Industry Revenue (Million) Forecast, by Application 2020 & 2033
- Table 58: Spain Health Information Exchange Industry Volume (K Unit) Forecast, by Application 2020 & 2033
- Table 59: Rest of Europe Health Information Exchange Industry Revenue (Million) Forecast, by Application 2020 & 2033
- Table 60: Rest of Europe Health Information Exchange Industry Volume (K Unit) Forecast, by Application 2020 & 2033
- Table 61: Global Health Information Exchange Industry Revenue Million Forecast, by Implementation Model 2020 & 2033
- Table 62: Global Health Information Exchange Industry Volume K Unit Forecast, by Implementation Model 2020 & 2033
- Table 63: Global Health Information Exchange Industry Revenue Million Forecast, by Setup Type 2020 & 2033
- Table 64: Global Health Information Exchange Industry Volume K Unit Forecast, by Setup Type 2020 & 2033
- Table 65: Global Health Information Exchange Industry Revenue Million Forecast, by Application 2020 & 2033
- Table 66: Global Health Information Exchange Industry Volume K Unit Forecast, by Application 2020 & 2033
- Table 67: Global Health Information Exchange Industry Revenue Million Forecast, by Exchange Type 2020 & 2033
- Table 68: Global Health Information Exchange Industry Volume K Unit Forecast, by Exchange Type 2020 & 2033
- Table 69: Global Health Information Exchange Industry Revenue Million Forecast, by Component 2020 & 2033
- Table 70: Global Health Information Exchange Industry Volume K Unit Forecast, by Component 2020 & 2033
- Table 71: Global Health Information Exchange Industry Revenue Million Forecast, by End User 2020 & 2033
- Table 72: Global Health Information Exchange Industry Volume K Unit Forecast, by End User 2020 & 2033
- Table 73: Global Health Information Exchange Industry Revenue Million Forecast, by Country 2020 & 2033
- Table 74: Global Health Information Exchange Industry Volume K Unit Forecast, by Country 2020 & 2033
- Table 75: China Health Information Exchange Industry Revenue (Million) Forecast, by Application 2020 & 2033
- Table 76: China Health Information Exchange Industry Volume (K Unit) Forecast, by Application 2020 & 2033
- Table 77: Japan Health Information Exchange Industry Revenue (Million) Forecast, by Application 2020 & 2033
- Table 78: Japan Health Information Exchange Industry Volume (K Unit) Forecast, by Application 2020 & 2033
- Table 79: India Health Information Exchange Industry Revenue (Million) Forecast, by Application 2020 & 2033
- Table 80: India Health Information Exchange Industry Volume (K Unit) Forecast, by Application 2020 & 2033
- Table 81: Australia Health Information Exchange Industry Revenue (Million) Forecast, by Application 2020 & 2033
- Table 82: Australia Health Information Exchange Industry Volume (K Unit) Forecast, by Application 2020 & 2033
- Table 83: South Korea Health Information Exchange Industry Revenue (Million) Forecast, by Application 2020 & 2033
- Table 84: South Korea Health Information Exchange Industry Volume (K Unit) Forecast, by Application 2020 & 2033
- Table 85: Rest of Asia Pacific Health Information Exchange Industry Revenue (Million) Forecast, by Application 2020 & 2033
- Table 86: Rest of Asia Pacific Health Information Exchange Industry Volume (K Unit) Forecast, by Application 2020 & 2033
- Table 87: Global Health Information Exchange Industry Revenue Million Forecast, by Implementation Model 2020 & 2033
- Table 88: Global Health Information Exchange Industry Volume K Unit Forecast, by Implementation Model 2020 & 2033
- Table 89: Global Health Information Exchange Industry Revenue Million Forecast, by Setup Type 2020 & 2033
- Table 90: Global Health Information Exchange Industry Volume K Unit Forecast, by Setup Type 2020 & 2033
- Table 91: Global Health Information Exchange Industry Revenue Million Forecast, by Application 2020 & 2033
- Table 92: Global Health Information Exchange Industry Volume K Unit Forecast, by Application 2020 & 2033
- Table 93: Global Health Information Exchange Industry Revenue Million Forecast, by Exchange Type 2020 & 2033
- Table 94: Global Health Information Exchange Industry Volume K Unit Forecast, by Exchange Type 2020 & 2033
- Table 95: Global Health Information Exchange Industry Revenue Million Forecast, by Component 2020 & 2033
- Table 96: Global Health Information Exchange Industry Volume K Unit Forecast, by Component 2020 & 2033
- Table 97: Global Health Information Exchange Industry Revenue Million Forecast, by End User 2020 & 2033
- Table 98: Global Health Information Exchange Industry Volume K Unit Forecast, by End User 2020 & 2033
- Table 99: Global Health Information Exchange Industry Revenue Million Forecast, by Country 2020 & 2033
- Table 100: Global Health Information Exchange Industry Volume K Unit Forecast, by Country 2020 & 2033
- Table 101: GCC Health Information Exchange Industry Revenue (Million) Forecast, by Application 2020 & 2033
- Table 102: GCC Health Information Exchange Industry Volume (K Unit) Forecast, by Application 2020 & 2033
- Table 103: South Africa Health Information Exchange Industry Revenue (Million) Forecast, by Application 2020 & 2033
- Table 104: South Africa Health Information Exchange Industry Volume (K Unit) Forecast, by Application 2020 & 2033
- Table 105: Rest of Middle East and Africa Health Information Exchange Industry Revenue (Million) Forecast, by Application 2020 & 2033
- Table 106: Rest of Middle East and Africa Health Information Exchange Industry Volume (K Unit) Forecast, by Application 2020 & 2033
- Table 107: Global Health Information Exchange Industry Revenue Million Forecast, by Implementation Model 2020 & 2033
- Table 108: Global Health Information Exchange Industry Volume K Unit Forecast, by Implementation Model 2020 & 2033
- Table 109: Global Health Information Exchange Industry Revenue Million Forecast, by Setup Type 2020 & 2033
- Table 110: Global Health Information Exchange Industry Volume K Unit Forecast, by Setup Type 2020 & 2033
- Table 111: Global Health Information Exchange Industry Revenue Million Forecast, by Application 2020 & 2033
- Table 112: Global Health Information Exchange Industry Volume K Unit Forecast, by Application 2020 & 2033
- Table 113: Global Health Information Exchange Industry Revenue Million Forecast, by Exchange Type 2020 & 2033
- Table 114: Global Health Information Exchange Industry Volume K Unit Forecast, by Exchange Type 2020 & 2033
- Table 115: Global Health Information Exchange Industry Revenue Million Forecast, by Component 2020 & 2033
- Table 116: Global Health Information Exchange Industry Volume K Unit Forecast, by Component 2020 & 2033
- Table 117: Global Health Information Exchange Industry Revenue Million Forecast, by End User 2020 & 2033
- Table 118: Global Health Information Exchange Industry Volume K Unit Forecast, by End User 2020 & 2033
- Table 119: Global Health Information Exchange Industry Revenue Million Forecast, by Country 2020 & 2033
- Table 120: Global Health Information Exchange Industry Volume K Unit Forecast, by Country 2020 & 2033
- Table 121: Brazil Health Information Exchange Industry Revenue (Million) Forecast, by Application 2020 & 2033
- Table 122: Brazil Health Information Exchange Industry Volume (K Unit) Forecast, by Application 2020 & 2033
- Table 123: Argentina Health Information Exchange Industry Revenue (Million) Forecast, by Application 2020 & 2033
- Table 124: Argentina Health Information Exchange Industry Volume (K Unit) Forecast, by Application 2020 & 2033
- Table 125: Rest of South America Health Information Exchange Industry Revenue (Million) Forecast, by Application 2020 & 2033
- Table 126: Rest of South America Health Information Exchange Industry Volume (K Unit) Forecast, by Application 2020 & 2033
Frequently Asked Questions
1. What is the projected Compound Annual Growth Rate (CAGR) of the Health Information Exchange Industry?
The projected CAGR is approximately 11.80%.
2. Which companies are prominent players in the Health Information Exchange Industry?
Key companies in the market include Infor Inc, NextGen Healthcare Information Systems LLC, Epic Corporation Inc, Cerner Corporation, Optum Inc, Open Text Corporation, Allscripts Healthcare Solutions Inc, Conifer Health Solutions, Medicity Inc, Orion Health.
3. What are the main segments of the Health Information Exchange Industry?
The market segments include Implementation Model, Setup Type, Application, Exchange Type, Component, End User.
4. Can you provide details about the market size?
The market size is estimated to be USD 1.97 Million as of 2022.
5. What are some drivers contributing to market growth?
; Growing Demand for Healthcare Data Exchange; Government Support in Creating Infrastructure for Data Exchange.
6. What are the notable trends driving market growth?
Hybrid Model Segment is Expected to Have Significant Share.
7. Are there any restraints impacting market growth?
; Huge Initial Infrastructural Investment; Data Privacy and Security Concerns.
8. Can you provide examples of recent developments in the market?
N/A
9. What pricing options are available for accessing the report?
Pricing options include single-user, multi-user, and enterprise licenses priced at USD 4750, USD 5250, and USD 8750 respectively.
10. Is the market size provided in terms of value or volume?
The market size is provided in terms of value, measured in Million and volume, measured in K Unit.
11. Are there any specific market keywords associated with the report?
Yes, the market keyword associated with the report is "Health Information Exchange Industry," which aids in identifying and referencing the specific market segment covered.
12. How do I determine which pricing option suits my needs best?
The pricing options vary based on user requirements and access needs. Individual users may opt for single-user licenses, while businesses requiring broader access may choose multi-user or enterprise licenses for cost-effective access to the report.
13. Are there any additional resources or data provided in the Health Information Exchange Industry report?
While the report offers comprehensive insights, it's advisable to review the specific contents or supplementary materials provided to ascertain if additional resources or data are available.
14. How can I stay updated on further developments or reports in the Health Information Exchange Industry?
To stay informed about further developments, trends, and reports in the Health Information Exchange Industry, consider subscribing to industry newsletters, following relevant companies and organizations, or regularly checking reputable industry news sources and publications.
Methodology
Step 1 - Identification of Relevant Samples Size from Population Database


Step 2 - Approaches for Defining Global Market Size (Value, Volume* & Price*)

Note*: In applicable scenarios
Step 3 - Data Sources
Primary Research
- Web Analytics
- Survey Reports
- Research Institute
- Latest Research Reports
- Opinion Leaders
Secondary Research
- Annual Reports
- White Paper
- Latest Press Release
- Industry Association
- Paid Database
- Investor Presentations

Step 4 - Data Triangulation
Involves using different sources of information in order to increase the validity of a study
These sources are likely to be stakeholders in a program - participants, other researchers, program staff, other community members, and so on.
Then we put all data in single framework & apply various statistical tools to find out the dynamic on the market.
During the analysis stage, feedback from the stakeholder groups would be compared to determine areas of agreement as well as areas of divergence