

Key Insights
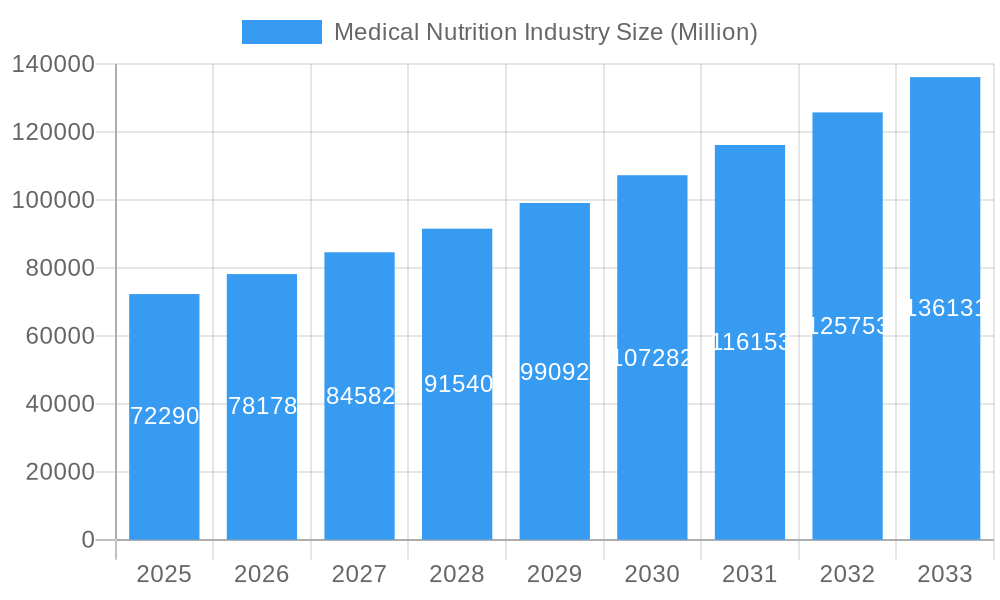
The global medical nutrition market, valued at $72.29 billion in 2025, is projected to experience robust growth, driven by a confluence of factors. Rising prevalence of chronic diseases like diabetes, cancer, and gastrointestinal disorders necessitates specialized nutritional support, fueling market expansion. An aging global population, coupled with increasing awareness of the importance of nutrition in disease management and recovery, further contributes to market growth. Advances in medical nutrition formulations, including the development of personalized and specialized products catering to specific dietary needs and disease states, are creating new opportunities. The market is segmented by application (nutritional support for malnutrition, metabolic disorders, gastrointestinal diseases, cancer, neurological diseases, and other diseases), end-user (pediatric and adult), and route of administration (oral and enteral, parenteral). The strong presence of established players like Abbott Laboratories, Nestle Health Science, and Fresenius Kabi, alongside emerging companies focusing on innovation, signifies a dynamic and competitive landscape. Regional variations exist, with North America and Europe currently holding significant market shares, while Asia-Pacific is expected to witness rapid growth due to increasing healthcare expenditure and rising prevalence of chronic diseases.
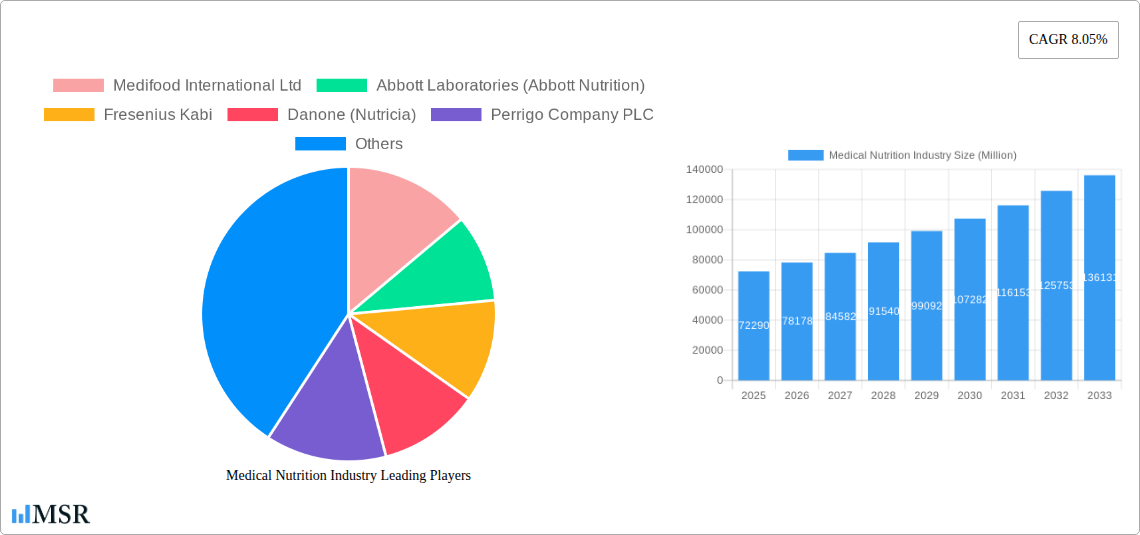
Medical Nutrition Industry Market Size (In Billion)
The market's Compound Annual Growth Rate (CAGR) of 8.05% from 2025 to 2033 indicates a consistently expanding market. However, certain restraints, such as high product costs, stringent regulatory frameworks, and potential reimbursement challenges, could influence market growth trajectory. Nevertheless, the ongoing research and development efforts focused on improving product efficacy, safety, and convenience, alongside the increasing focus on preventive healthcare, are anticipated to mitigate these restraints and further bolster market expansion over the forecast period. This growth will be underpinned by the continued development of innovative products, expansion into emerging markets, and strategic collaborations between medical nutrition companies and healthcare providers. The market is well-positioned for continued expansion, driven by demographic shifts, disease prevalence, and technological advancements.
Medical Nutrition Industry Company Market Share
Medical Nutrition Industry Market Report: 2019-2033 Forecast
This comprehensive report provides a detailed analysis of the Medical Nutrition Industry, projecting a market size of $XX Billion by 2033. The report covers the period 2019-2033, with a base year of 2025 and a forecast period of 2025-2033. It examines key market segments, leading players, and emerging trends, offering actionable insights for industry stakeholders. Discover the growth drivers, challenges, and opportunities shaping this dynamic sector.
Medical Nutrition Industry Market Concentration & Dynamics
The medical nutrition industry exhibits a moderately concentrated market structure, with key players like Abbott Laboratories (Abbott Nutrition), Nestle Health Science, and Fresenius Kabi holding significant market share. However, the landscape is dynamic, characterized by both organic growth and strategic mergers and acquisitions (M&A). The number of M&A deals in the industry has averaged xx per year over the historical period (2019-2024), indicating a strong appetite for consolidation and expansion.
- Market Share: Abbott Laboratories (Abbott Nutrition) holds an estimated xx% market share, followed by Nestle Health Science at xx% and Fresenius Kabi at xx%. Smaller players, including Danone (Nutricia), Perrigo Company PLC, and Ajinomoto Cambrooke Inc (Nualtra Ltd) collectively account for approximately xx%.
- Innovation Ecosystem: The industry is characterized by robust R&D activities focused on developing specialized formulas addressing specific dietary needs. Companies are investing heavily in personalized nutrition solutions and technologically advanced delivery systems.
- Regulatory Frameworks: Stringent regulatory approvals and compliance requirements, particularly related to safety and efficacy, pose both challenges and opportunities for market entry and growth.
- Substitute Products: The primary substitutes for medical nutrition products are home-prepared diets, though these often lack the precise nutritional balance provided by specialized formulations.
- End-User Trends: Growing awareness of the importance of nutrition in disease management, coupled with an aging population, fuels market growth. Demand is particularly strong in the adult and pediatric segments for conditions requiring specialized nutritional support.
- M&A Activities: The high number of M&A deals reflects the industry's focus on expanding product portfolios, gaining access to new markets, and enhancing technological capabilities. These activities are expected to continue driving market consolidation.
Medical Nutrition Industry Industry Insights & Trends
The global medical nutrition industry is experiencing robust growth, driven by a confluence of factors. The market exhibited a CAGR of xx% during the historical period (2019-2024) and is projected to maintain a CAGR of xx% during the forecast period (2025-2033), reaching a projected market value of $XX Billion by 2033.
Rising prevalence of chronic diseases, such as diabetes, cardiovascular diseases, and cancer, is a major growth driver. The increasing geriatric population, coupled with heightened awareness of the crucial role of nutrition in disease management and recovery, is further fueling demand. Technological advancements, such as the development of personalized nutrition solutions and improved delivery systems, are significantly contributing to the market expansion. Consumer preferences are shifting towards convenient, palatable, and effective nutritional solutions. This trend is driving innovation and product diversification within the medical nutrition sector. The rising disposable incomes in emerging economies, particularly in Asia-Pacific, further contribute to the robust growth trajectory.
Key Markets & Segments Leading Medical Nutrition Industry
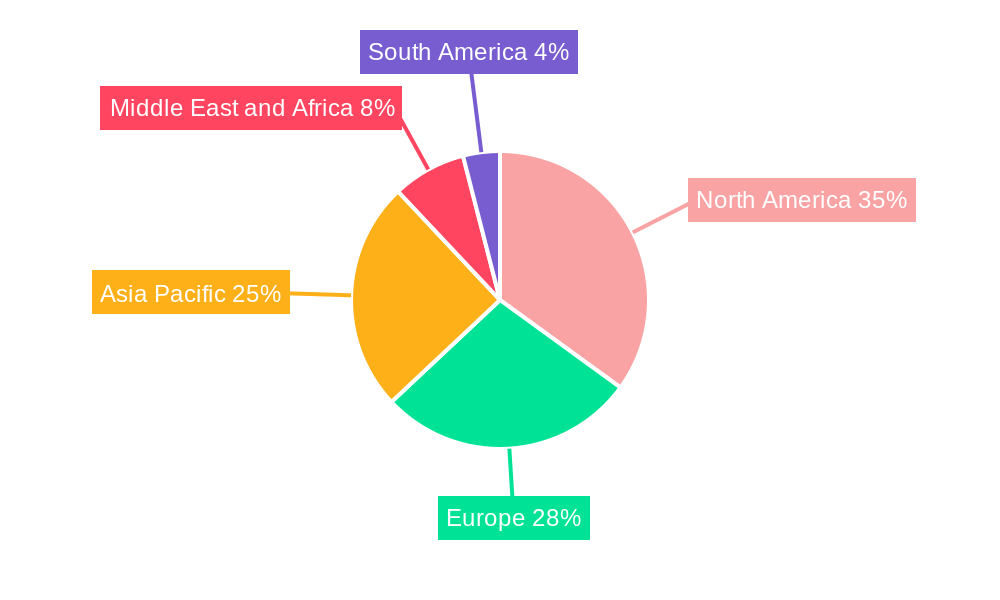
The medical nutrition market exhibits significant growth across various segments. While the global market is expanding, North America and Europe currently hold the largest market share. However, rapidly developing economies in Asia-Pacific are witnessing the fastest growth rates.
- Dominant Regions: North America and Europe currently represent the largest markets, driven by high healthcare expenditure and a higher prevalence of chronic diseases. However, the Asia-Pacific region is expected to experience the fastest growth due to rising disposable incomes and increasing awareness of nutritional health.
- Dominant Applications: Nutritional support for malnutrition and gastrointestinal diseases are currently the largest application segments, but significant growth potential exists in nutritional support for metabolic disorders and cancer.
- Dominant End-Users: The adult segment currently dominates the market owing to the higher prevalence of chronic diseases in this population. However, significant growth is expected in the pediatric segment, driven by increasing awareness of the impact of nutrition on child development and health outcomes.
- Dominant Route of Administration: Oral and enteral nutrition represents the dominant route of administration due to its convenience and cost-effectiveness. However, parenteral nutrition is seeing increasing adoption for patients with severe gastrointestinal disorders.
Growth Drivers:
- Economic Growth: Increasing disposable incomes in developing nations drive demand for premium medical nutrition products.
- Healthcare Infrastructure Development: Investments in healthcare infrastructure expand access to advanced nutritional therapies.
- Technological Advancements: Innovations in product formulation and delivery systems enhance efficacy and convenience.
Medical Nutrition Industry Product Developments
Recent product innovations focus on personalized nutrition, advanced delivery systems, and improved palatability. Companies are developing specialized formulas to address specific dietary needs, including those related to metabolic disorders, gastrointestinal diseases, and cancer. Technological advancements in areas such as customized nutrient blends, functional food ingredients, and technologically advanced delivery systems provide competitive advantages and cater to evolving consumer preferences.
Challenges in the Medical Nutrition Industry Market
The industry faces challenges including stringent regulatory approvals, complex supply chains vulnerable to disruptions, and intense competition from established players and new entrants. These factors can affect both production costs and market access. Regulatory hurdles can lead to delays in product launches and increased development costs (estimated impact: xx% increase in development costs). Supply chain disruptions can result in production delays and increased raw material costs (estimated impact: xx% increase in raw material costs). Intense competition leads to pricing pressure and necessitates continuous innovation to maintain market share.
Forces Driving Medical Nutrition Industry Growth
Technological advancements in product formulation, personalized nutrition solutions, and convenient delivery systems are key growth catalysts. Favorable economic conditions and rising healthcare expenditure in various regions contribute significantly. Supportive government policies and initiatives promoting nutritional health further enhance market growth. The increasing prevalence of chronic diseases necessitates specialized medical nutrition, providing sustained demand.
Long-Term Growth Catalysts in the Medical Nutrition Industry
Long-term growth hinges on continuous innovation, strategic partnerships, and expansion into emerging markets. The development of innovative products addressing unmet needs, combined with collaborations across the healthcare ecosystem, will fuel future expansion. Strategic acquisitions and expansion into high-growth regions will solidify market position and increase revenue streams.
Emerging Opportunities in Medical Nutrition Industry
Emerging trends highlight opportunities in personalized nutrition, functional foods, and specialized formulas catering to niche dietary requirements. The growing demand for convenient and palatable products drives innovation in delivery systems. Expanding into emerging markets with significant unmet needs presents high growth potential.
Leading Players in the Medical Nutrition Industry Sector
- Abbott Laboratories (Abbott Nutrition)
- Fresenius Kabi
- Danone (Nutricia)
- Perrigo Company PLC
- Nestle Health Science
- Ajinomoto Cambrooke Inc (Nualtra Ltd)
- AYMES International Ltd
- Baxter Healthcare
- B Braun SE
- Reckitt Benckiser
- Medifood International Ltd
Key Milestones in Medical Nutrition Industry Industry
- October 2022: Hologram Sciences and Maeil Health Nutrition partnered to deliver personalized nutrition solutions to the Korean market, signifying growing interest in customized nutrition.
- April 2022: Glanbia Nutritionals launched TechVantage, a functionally optimized nutrient technology platform, showcasing advancements in nutrient delivery and formulation.
Strategic Outlook for Medical Nutrition Industry Market
The medical nutrition industry is poised for sustained growth, driven by long-term trends in demographics, healthcare expenditure, and technological innovation. Companies strategically focusing on personalized nutrition, innovative product development, and expansion into emerging markets are well-positioned to capture significant market share and drive future growth. The industry's future success lies in its ability to adapt to evolving consumer preferences and address the ever-growing need for specialized nutritional support.
Medical Nutrition Industry Segmentation
-
1. Route of Administration
- 1.1. Oral and Enteral
- 1.2. Parenteral
-
2. Application
- 2.1. Nutritional Support for Malnutrition
- 2.2. Nutritional Support for Metabolic Disorders
- 2.3. Nutritional Support for Gastrointestinal Diseases
- 2.4. Nutritional Support for Cancer
- 2.5. Nutritional Support in Neurological Diseases
- 2.6. Nutritional Support in Other Diseases
-
3. End User
- 3.1. Pediatric
- 3.2. Adult
Medical Nutrition Industry Segmentation By Geography
-
1. North America
- 1.1. United States
- 1.2. Canada
- 1.3. Mexico
-
2. Europe
- 2.1. Germany
- 2.2. United Kingdom
- 2.3. France
- 2.4. Italy
- 2.5. Spain
- 2.6. Rest of Europe
-
3. Asia Pacific
- 3.1. China
- 3.2. Japan
- 3.3. India
- 3.4. Australia
- 3.5. South Korea
- 3.6. Rest of Asia Pacific
-
4. Middle East and Africa
- 4.1. GCC
- 4.2. South Africa
- 4.3. Rest of Middle East and Africa
-
5. South America
- 5.1. Brazil
- 5.2. Argentina
- 5.3. Rest of South America
Medical Nutrition Industry Regional Market Share
Geographic Coverage of Medical Nutrition Industry
Medical Nutrition Industry REPORT HIGHLIGHTS
| Aspects | Details |
|---|---|
| Study Period | 2020-2034 |
| Base Year | 2025 |
| Estimated Year | 2026 |
| Forecast Period | 2026-2034 |
| Historical Period | 2020-2025 |
| Growth Rate | CAGR of 8.05% from 2020-2034 |
| Segmentation |
|
Table of Contents
- 1. Introduction
- 1.1. Research Scope
- 1.2. Market Segmentation
- 1.3. Research Objective
- 1.4. Definitions and Assumptions
- 2. Executive Summary
- 2.1. Market Snapshot
- 3. Market Dynamics
- 3.1. Market Drivers
- 3.2. Market Restrains
- 3.3. Market Trends
- 3.4. Market Opportunities
- 4. Market Factor Analysis
- 4.1. Porters Five Forces
- 4.1.1. Bargaining Power of Suppliers
- 4.1.2. Bargaining Power of Buyers
- 4.1.3. Threat of New Entrants
- 4.1.4. Threat of Substitutes
- 4.1.5. Competitive Rivalry
- 4.2. PESTEL analysis
- 4.3. BCG Analysis
- 4.3.1. Stars (High Growth, High Market Share)
- 4.3.2. Cash Cows (Low Growth, High Market Share)
- 4.3.3. Question Mark (High Growth, Low Market Share)
- 4.3.4. Dogs (Low Growth, Low Market Share)
- 4.4. Ansoff Matrix Analysis
- 4.5. Supply Chain Analysis
- 4.6. Regulatory Landscape
- 4.7. Current Market Potential and Opportunity Assessment (TAM–SAM–SOM Framework)
- 4.8. MSR Analyst Note
- 4.1. Porters Five Forces
- 5. Market Analysis, Insights and Forecast 2021-2033
- 5.1. Market Analysis, Insights and Forecast - by Route of Administration
- 5.1.1. Oral and Enteral
- 5.1.2. Parenteral
- 5.2. Market Analysis, Insights and Forecast - by Application
- 5.2.1. Nutritional Support for Malnutrition
- 5.2.2. Nutritional Support for Metabolic Disorders
- 5.2.3. Nutritional Support for Gastrointestinal Diseases
- 5.2.4. Nutritional Support for Cancer
- 5.2.5. Nutritional Support in Neurological Diseases
- 5.2.6. Nutritional Support in Other Diseases
- 5.3. Market Analysis, Insights and Forecast - by End User
- 5.3.1. Pediatric
- 5.3.2. Adult
- 5.4. Market Analysis, Insights and Forecast - by Region
- 5.4.1. North America
- 5.4.2. Europe
- 5.4.3. Asia Pacific
- 5.4.4. Middle East and Africa
- 5.4.5. South America
- 5.1. Market Analysis, Insights and Forecast - by Route of Administration
- 6. Global Medical Nutrition Industry Analysis, Insights and Forecast, 2021-2033
- 6.1. Market Analysis, Insights and Forecast - by Route of Administration
- 6.1.1. Oral and Enteral
- 6.1.2. Parenteral
- 6.2. Market Analysis, Insights and Forecast - by Application
- 6.2.1. Nutritional Support for Malnutrition
- 6.2.2. Nutritional Support for Metabolic Disorders
- 6.2.3. Nutritional Support for Gastrointestinal Diseases
- 6.2.4. Nutritional Support for Cancer
- 6.2.5. Nutritional Support in Neurological Diseases
- 6.2.6. Nutritional Support in Other Diseases
- 6.3. Market Analysis, Insights and Forecast - by End User
- 6.3.1. Pediatric
- 6.3.2. Adult
- 6.1. Market Analysis, Insights and Forecast - by Route of Administration
- 7. North America Medical Nutrition Industry Analysis, Insights and Forecast, 2020-2032
- 7.1. Market Analysis, Insights and Forecast - by Route of Administration
- 7.1.1. Oral and Enteral
- 7.1.2. Parenteral
- 7.2. Market Analysis, Insights and Forecast - by Application
- 7.2.1. Nutritional Support for Malnutrition
- 7.2.2. Nutritional Support for Metabolic Disorders
- 7.2.3. Nutritional Support for Gastrointestinal Diseases
- 7.2.4. Nutritional Support for Cancer
- 7.2.5. Nutritional Support in Neurological Diseases
- 7.2.6. Nutritional Support in Other Diseases
- 7.3. Market Analysis, Insights and Forecast - by End User
- 7.3.1. Pediatric
- 7.3.2. Adult
- 7.1. Market Analysis, Insights and Forecast - by Route of Administration
- 8. Europe Medical Nutrition Industry Analysis, Insights and Forecast, 2020-2032
- 8.1. Market Analysis, Insights and Forecast - by Route of Administration
- 8.1.1. Oral and Enteral
- 8.1.2. Parenteral
- 8.2. Market Analysis, Insights and Forecast - by Application
- 8.2.1. Nutritional Support for Malnutrition
- 8.2.2. Nutritional Support for Metabolic Disorders
- 8.2.3. Nutritional Support for Gastrointestinal Diseases
- 8.2.4. Nutritional Support for Cancer
- 8.2.5. Nutritional Support in Neurological Diseases
- 8.2.6. Nutritional Support in Other Diseases
- 8.3. Market Analysis, Insights and Forecast - by End User
- 8.3.1. Pediatric
- 8.3.2. Adult
- 8.1. Market Analysis, Insights and Forecast - by Route of Administration
- 9. Asia Pacific Medical Nutrition Industry Analysis, Insights and Forecast, 2020-2032
- 9.1. Market Analysis, Insights and Forecast - by Route of Administration
- 9.1.1. Oral and Enteral
- 9.1.2. Parenteral
- 9.2. Market Analysis, Insights and Forecast - by Application
- 9.2.1. Nutritional Support for Malnutrition
- 9.2.2. Nutritional Support for Metabolic Disorders
- 9.2.3. Nutritional Support for Gastrointestinal Diseases
- 9.2.4. Nutritional Support for Cancer
- 9.2.5. Nutritional Support in Neurological Diseases
- 9.2.6. Nutritional Support in Other Diseases
- 9.3. Market Analysis, Insights and Forecast - by End User
- 9.3.1. Pediatric
- 9.3.2. Adult
- 9.1. Market Analysis, Insights and Forecast - by Route of Administration
- 10. Middle East and Africa Medical Nutrition Industry Analysis, Insights and Forecast, 2020-2032
- 10.1. Market Analysis, Insights and Forecast - by Route of Administration
- 10.1.1. Oral and Enteral
- 10.1.2. Parenteral
- 10.2. Market Analysis, Insights and Forecast - by Application
- 10.2.1. Nutritional Support for Malnutrition
- 10.2.2. Nutritional Support for Metabolic Disorders
- 10.2.3. Nutritional Support for Gastrointestinal Diseases
- 10.2.4. Nutritional Support for Cancer
- 10.2.5. Nutritional Support in Neurological Diseases
- 10.2.6. Nutritional Support in Other Diseases
- 10.3. Market Analysis, Insights and Forecast - by End User
- 10.3.1. Pediatric
- 10.3.2. Adult
- 10.1. Market Analysis, Insights and Forecast - by Route of Administration
- 11. South America Medical Nutrition Industry Analysis, Insights and Forecast, 2020-2032
- 11.1. Market Analysis, Insights and Forecast - by Route of Administration
- 11.1.1. Oral and Enteral
- 11.1.2. Parenteral
- 11.2. Market Analysis, Insights and Forecast - by Application
- 11.2.1. Nutritional Support for Malnutrition
- 11.2.2. Nutritional Support for Metabolic Disorders
- 11.2.3. Nutritional Support for Gastrointestinal Diseases
- 11.2.4. Nutritional Support for Cancer
- 11.2.5. Nutritional Support in Neurological Diseases
- 11.2.6. Nutritional Support in Other Diseases
- 11.3. Market Analysis, Insights and Forecast - by End User
- 11.3.1. Pediatric
- 11.3.2. Adult
- 11.1. Market Analysis, Insights and Forecast - by Route of Administration
- 12. Competitive Analysis
- 12.1. Company Profiles
- 12.1.1 Medifood International Ltd
- 12.1.1.1. Company Overview
- 12.1.1.2. Products
- 12.1.1.3. Company Financials
- 12.1.1.4. SWOT Analysis
- 12.1.2 Abbott Laboratories (Abbott Nutrition)
- 12.1.2.1. Company Overview
- 12.1.2.2. Products
- 12.1.2.3. Company Financials
- 12.1.2.4. SWOT Analysis
- 12.1.3 Fresenius Kabi
- 12.1.3.1. Company Overview
- 12.1.3.2. Products
- 12.1.3.3. Company Financials
- 12.1.3.4. SWOT Analysis
- 12.1.4 Danone (Nutricia)
- 12.1.4.1. Company Overview
- 12.1.4.2. Products
- 12.1.4.3. Company Financials
- 12.1.4.4. SWOT Analysis
- 12.1.5 Perrigo Company PLC
- 12.1.5.1. Company Overview
- 12.1.5.2. Products
- 12.1.5.3. Company Financials
- 12.1.5.4. SWOT Analysis
- 12.1.6 Nestle Health Science
- 12.1.6.1. Company Overview
- 12.1.6.2. Products
- 12.1.6.3. Company Financials
- 12.1.6.4. SWOT Analysis
- 12.1.7 Ajinomoto Cambrooke Inc (Nualtra Ltd)
- 12.1.7.1. Company Overview
- 12.1.7.2. Products
- 12.1.7.3. Company Financials
- 12.1.7.4. SWOT Analysis
- 12.1.8 AYMES International Ltd
- 12.1.8.1. Company Overview
- 12.1.8.2. Products
- 12.1.8.3. Company Financials
- 12.1.8.4. SWOT Analysis
- 12.1.9 Baxter Healthcare
- 12.1.9.1. Company Overview
- 12.1.9.2. Products
- 12.1.9.3. Company Financials
- 12.1.9.4. SWOT Analysis
- 12.1.10 B Braun SE
- 12.1.10.1. Company Overview
- 12.1.10.2. Products
- 12.1.10.3. Company Financials
- 12.1.10.4. SWOT Analysis
- 12.1.11 Reckitt Benckiser
- 12.1.11.1. Company Overview
- 12.1.11.2. Products
- 12.1.11.3. Company Financials
- 12.1.11.4. SWOT Analysis
- 12.1.1 Medifood International Ltd
- 12.2. Market Entropy
- 12.2.1 Company's Key Areas Served
- 12.2.2 Recent Developments
- 12.3. Company Market Share Analysis 2025
- 12.3.1 Top 5 Companies Market Share Analysis
- 12.3.2 Top 3 Companies Market Share Analysis
- 12.4. List of Potential Customers
- 13. Research Methodology
List of Figures
- Figure 1: Global Medical Nutrition Industry Revenue Breakdown (Million, %) by Region 2025 & 2033
- Figure 2: Global Medical Nutrition Industry Volume Breakdown (K Unit, %) by Region 2025 & 2033
- Figure 3: North America Medical Nutrition Industry Revenue (Million), by Route of Administration 2025 & 2033
- Figure 4: North America Medical Nutrition Industry Volume (K Unit), by Route of Administration 2025 & 2033
- Figure 5: North America Medical Nutrition Industry Revenue Share (%), by Route of Administration 2025 & 2033
- Figure 6: North America Medical Nutrition Industry Volume Share (%), by Route of Administration 2025 & 2033
- Figure 7: North America Medical Nutrition Industry Revenue (Million), by Application 2025 & 2033
- Figure 8: North America Medical Nutrition Industry Volume (K Unit), by Application 2025 & 2033
- Figure 9: North America Medical Nutrition Industry Revenue Share (%), by Application 2025 & 2033
- Figure 10: North America Medical Nutrition Industry Volume Share (%), by Application 2025 & 2033
- Figure 11: North America Medical Nutrition Industry Revenue (Million), by End User 2025 & 2033
- Figure 12: North America Medical Nutrition Industry Volume (K Unit), by End User 2025 & 2033
- Figure 13: North America Medical Nutrition Industry Revenue Share (%), by End User 2025 & 2033
- Figure 14: North America Medical Nutrition Industry Volume Share (%), by End User 2025 & 2033
- Figure 15: North America Medical Nutrition Industry Revenue (Million), by Country 2025 & 2033
- Figure 16: North America Medical Nutrition Industry Volume (K Unit), by Country 2025 & 2033
- Figure 17: North America Medical Nutrition Industry Revenue Share (%), by Country 2025 & 2033
- Figure 18: North America Medical Nutrition Industry Volume Share (%), by Country 2025 & 2033
- Figure 19: Europe Medical Nutrition Industry Revenue (Million), by Route of Administration 2025 & 2033
- Figure 20: Europe Medical Nutrition Industry Volume (K Unit), by Route of Administration 2025 & 2033
- Figure 21: Europe Medical Nutrition Industry Revenue Share (%), by Route of Administration 2025 & 2033
- Figure 22: Europe Medical Nutrition Industry Volume Share (%), by Route of Administration 2025 & 2033
- Figure 23: Europe Medical Nutrition Industry Revenue (Million), by Application 2025 & 2033
- Figure 24: Europe Medical Nutrition Industry Volume (K Unit), by Application 2025 & 2033
- Figure 25: Europe Medical Nutrition Industry Revenue Share (%), by Application 2025 & 2033
- Figure 26: Europe Medical Nutrition Industry Volume Share (%), by Application 2025 & 2033
- Figure 27: Europe Medical Nutrition Industry Revenue (Million), by End User 2025 & 2033
- Figure 28: Europe Medical Nutrition Industry Volume (K Unit), by End User 2025 & 2033
- Figure 29: Europe Medical Nutrition Industry Revenue Share (%), by End User 2025 & 2033
- Figure 30: Europe Medical Nutrition Industry Volume Share (%), by End User 2025 & 2033
- Figure 31: Europe Medical Nutrition Industry Revenue (Million), by Country 2025 & 2033
- Figure 32: Europe Medical Nutrition Industry Volume (K Unit), by Country 2025 & 2033
- Figure 33: Europe Medical Nutrition Industry Revenue Share (%), by Country 2025 & 2033
- Figure 34: Europe Medical Nutrition Industry Volume Share (%), by Country 2025 & 2033
- Figure 35: Asia Pacific Medical Nutrition Industry Revenue (Million), by Route of Administration 2025 & 2033
- Figure 36: Asia Pacific Medical Nutrition Industry Volume (K Unit), by Route of Administration 2025 & 2033
- Figure 37: Asia Pacific Medical Nutrition Industry Revenue Share (%), by Route of Administration 2025 & 2033
- Figure 38: Asia Pacific Medical Nutrition Industry Volume Share (%), by Route of Administration 2025 & 2033
- Figure 39: Asia Pacific Medical Nutrition Industry Revenue (Million), by Application 2025 & 2033
- Figure 40: Asia Pacific Medical Nutrition Industry Volume (K Unit), by Application 2025 & 2033
- Figure 41: Asia Pacific Medical Nutrition Industry Revenue Share (%), by Application 2025 & 2033
- Figure 42: Asia Pacific Medical Nutrition Industry Volume Share (%), by Application 2025 & 2033
- Figure 43: Asia Pacific Medical Nutrition Industry Revenue (Million), by End User 2025 & 2033
- Figure 44: Asia Pacific Medical Nutrition Industry Volume (K Unit), by End User 2025 & 2033
- Figure 45: Asia Pacific Medical Nutrition Industry Revenue Share (%), by End User 2025 & 2033
- Figure 46: Asia Pacific Medical Nutrition Industry Volume Share (%), by End User 2025 & 2033
- Figure 47: Asia Pacific Medical Nutrition Industry Revenue (Million), by Country 2025 & 2033
- Figure 48: Asia Pacific Medical Nutrition Industry Volume (K Unit), by Country 2025 & 2033
- Figure 49: Asia Pacific Medical Nutrition Industry Revenue Share (%), by Country 2025 & 2033
- Figure 50: Asia Pacific Medical Nutrition Industry Volume Share (%), by Country 2025 & 2033
- Figure 51: Middle East and Africa Medical Nutrition Industry Revenue (Million), by Route of Administration 2025 & 2033
- Figure 52: Middle East and Africa Medical Nutrition Industry Volume (K Unit), by Route of Administration 2025 & 2033
- Figure 53: Middle East and Africa Medical Nutrition Industry Revenue Share (%), by Route of Administration 2025 & 2033
- Figure 54: Middle East and Africa Medical Nutrition Industry Volume Share (%), by Route of Administration 2025 & 2033
- Figure 55: Middle East and Africa Medical Nutrition Industry Revenue (Million), by Application 2025 & 2033
- Figure 56: Middle East and Africa Medical Nutrition Industry Volume (K Unit), by Application 2025 & 2033
- Figure 57: Middle East and Africa Medical Nutrition Industry Revenue Share (%), by Application 2025 & 2033
- Figure 58: Middle East and Africa Medical Nutrition Industry Volume Share (%), by Application 2025 & 2033
- Figure 59: Middle East and Africa Medical Nutrition Industry Revenue (Million), by End User 2025 & 2033
- Figure 60: Middle East and Africa Medical Nutrition Industry Volume (K Unit), by End User 2025 & 2033
- Figure 61: Middle East and Africa Medical Nutrition Industry Revenue Share (%), by End User 2025 & 2033
- Figure 62: Middle East and Africa Medical Nutrition Industry Volume Share (%), by End User 2025 & 2033
- Figure 63: Middle East and Africa Medical Nutrition Industry Revenue (Million), by Country 2025 & 2033
- Figure 64: Middle East and Africa Medical Nutrition Industry Volume (K Unit), by Country 2025 & 2033
- Figure 65: Middle East and Africa Medical Nutrition Industry Revenue Share (%), by Country 2025 & 2033
- Figure 66: Middle East and Africa Medical Nutrition Industry Volume Share (%), by Country 2025 & 2033
- Figure 67: South America Medical Nutrition Industry Revenue (Million), by Route of Administration 2025 & 2033
- Figure 68: South America Medical Nutrition Industry Volume (K Unit), by Route of Administration 2025 & 2033
- Figure 69: South America Medical Nutrition Industry Revenue Share (%), by Route of Administration 2025 & 2033
- Figure 70: South America Medical Nutrition Industry Volume Share (%), by Route of Administration 2025 & 2033
- Figure 71: South America Medical Nutrition Industry Revenue (Million), by Application 2025 & 2033
- Figure 72: South America Medical Nutrition Industry Volume (K Unit), by Application 2025 & 2033
- Figure 73: South America Medical Nutrition Industry Revenue Share (%), by Application 2025 & 2033
- Figure 74: South America Medical Nutrition Industry Volume Share (%), by Application 2025 & 2033
- Figure 75: South America Medical Nutrition Industry Revenue (Million), by End User 2025 & 2033
- Figure 76: South America Medical Nutrition Industry Volume (K Unit), by End User 2025 & 2033
- Figure 77: South America Medical Nutrition Industry Revenue Share (%), by End User 2025 & 2033
- Figure 78: South America Medical Nutrition Industry Volume Share (%), by End User 2025 & 2033
- Figure 79: South America Medical Nutrition Industry Revenue (Million), by Country 2025 & 2033
- Figure 80: South America Medical Nutrition Industry Volume (K Unit), by Country 2025 & 2033
- Figure 81: South America Medical Nutrition Industry Revenue Share (%), by Country 2025 & 2033
- Figure 82: South America Medical Nutrition Industry Volume Share (%), by Country 2025 & 2033
List of Tables
- Table 1: Global Medical Nutrition Industry Revenue Million Forecast, by Route of Administration 2020 & 2033
- Table 2: Global Medical Nutrition Industry Volume K Unit Forecast, by Route of Administration 2020 & 2033
- Table 3: Global Medical Nutrition Industry Revenue Million Forecast, by Application 2020 & 2033
- Table 4: Global Medical Nutrition Industry Volume K Unit Forecast, by Application 2020 & 2033
- Table 5: Global Medical Nutrition Industry Revenue Million Forecast, by End User 2020 & 2033
- Table 6: Global Medical Nutrition Industry Volume K Unit Forecast, by End User 2020 & 2033
- Table 7: Global Medical Nutrition Industry Revenue Million Forecast, by Region 2020 & 2033
- Table 8: Global Medical Nutrition Industry Volume K Unit Forecast, by Region 2020 & 2033
- Table 9: Global Medical Nutrition Industry Revenue Million Forecast, by Route of Administration 2020 & 2033
- Table 10: Global Medical Nutrition Industry Volume K Unit Forecast, by Route of Administration 2020 & 2033
- Table 11: Global Medical Nutrition Industry Revenue Million Forecast, by Application 2020 & 2033
- Table 12: Global Medical Nutrition Industry Volume K Unit Forecast, by Application 2020 & 2033
- Table 13: Global Medical Nutrition Industry Revenue Million Forecast, by End User 2020 & 2033
- Table 14: Global Medical Nutrition Industry Volume K Unit Forecast, by End User 2020 & 2033
- Table 15: Global Medical Nutrition Industry Revenue Million Forecast, by Country 2020 & 2033
- Table 16: Global Medical Nutrition Industry Volume K Unit Forecast, by Country 2020 & 2033
- Table 17: United States Medical Nutrition Industry Revenue (Million) Forecast, by Application 2020 & 2033
- Table 18: United States Medical Nutrition Industry Volume (K Unit) Forecast, by Application 2020 & 2033
- Table 19: Canada Medical Nutrition Industry Revenue (Million) Forecast, by Application 2020 & 2033
- Table 20: Canada Medical Nutrition Industry Volume (K Unit) Forecast, by Application 2020 & 2033
- Table 21: Mexico Medical Nutrition Industry Revenue (Million) Forecast, by Application 2020 & 2033
- Table 22: Mexico Medical Nutrition Industry Volume (K Unit) Forecast, by Application 2020 & 2033
- Table 23: Global Medical Nutrition Industry Revenue Million Forecast, by Route of Administration 2020 & 2033
- Table 24: Global Medical Nutrition Industry Volume K Unit Forecast, by Route of Administration 2020 & 2033
- Table 25: Global Medical Nutrition Industry Revenue Million Forecast, by Application 2020 & 2033
- Table 26: Global Medical Nutrition Industry Volume K Unit Forecast, by Application 2020 & 2033
- Table 27: Global Medical Nutrition Industry Revenue Million Forecast, by End User 2020 & 2033
- Table 28: Global Medical Nutrition Industry Volume K Unit Forecast, by End User 2020 & 2033
- Table 29: Global Medical Nutrition Industry Revenue Million Forecast, by Country 2020 & 2033
- Table 30: Global Medical Nutrition Industry Volume K Unit Forecast, by Country 2020 & 2033
- Table 31: Germany Medical Nutrition Industry Revenue (Million) Forecast, by Application 2020 & 2033
- Table 32: Germany Medical Nutrition Industry Volume (K Unit) Forecast, by Application 2020 & 2033
- Table 33: United Kingdom Medical Nutrition Industry Revenue (Million) Forecast, by Application 2020 & 2033
- Table 34: United Kingdom Medical Nutrition Industry Volume (K Unit) Forecast, by Application 2020 & 2033
- Table 35: France Medical Nutrition Industry Revenue (Million) Forecast, by Application 2020 & 2033
- Table 36: France Medical Nutrition Industry Volume (K Unit) Forecast, by Application 2020 & 2033
- Table 37: Italy Medical Nutrition Industry Revenue (Million) Forecast, by Application 2020 & 2033
- Table 38: Italy Medical Nutrition Industry Volume (K Unit) Forecast, by Application 2020 & 2033
- Table 39: Spain Medical Nutrition Industry Revenue (Million) Forecast, by Application 2020 & 2033
- Table 40: Spain Medical Nutrition Industry Volume (K Unit) Forecast, by Application 2020 & 2033
- Table 41: Rest of Europe Medical Nutrition Industry Revenue (Million) Forecast, by Application 2020 & 2033
- Table 42: Rest of Europe Medical Nutrition Industry Volume (K Unit) Forecast, by Application 2020 & 2033
- Table 43: Global Medical Nutrition Industry Revenue Million Forecast, by Route of Administration 2020 & 2033
- Table 44: Global Medical Nutrition Industry Volume K Unit Forecast, by Route of Administration 2020 & 2033
- Table 45: Global Medical Nutrition Industry Revenue Million Forecast, by Application 2020 & 2033
- Table 46: Global Medical Nutrition Industry Volume K Unit Forecast, by Application 2020 & 2033
- Table 47: Global Medical Nutrition Industry Revenue Million Forecast, by End User 2020 & 2033
- Table 48: Global Medical Nutrition Industry Volume K Unit Forecast, by End User 2020 & 2033
- Table 49: Global Medical Nutrition Industry Revenue Million Forecast, by Country 2020 & 2033
- Table 50: Global Medical Nutrition Industry Volume K Unit Forecast, by Country 2020 & 2033
- Table 51: China Medical Nutrition Industry Revenue (Million) Forecast, by Application 2020 & 2033
- Table 52: China Medical Nutrition Industry Volume (K Unit) Forecast, by Application 2020 & 2033
- Table 53: Japan Medical Nutrition Industry Revenue (Million) Forecast, by Application 2020 & 2033
- Table 54: Japan Medical Nutrition Industry Volume (K Unit) Forecast, by Application 2020 & 2033
- Table 55: India Medical Nutrition Industry Revenue (Million) Forecast, by Application 2020 & 2033
- Table 56: India Medical Nutrition Industry Volume (K Unit) Forecast, by Application 2020 & 2033
- Table 57: Australia Medical Nutrition Industry Revenue (Million) Forecast, by Application 2020 & 2033
- Table 58: Australia Medical Nutrition Industry Volume (K Unit) Forecast, by Application 2020 & 2033
- Table 59: South Korea Medical Nutrition Industry Revenue (Million) Forecast, by Application 2020 & 2033
- Table 60: South Korea Medical Nutrition Industry Volume (K Unit) Forecast, by Application 2020 & 2033
- Table 61: Rest of Asia Pacific Medical Nutrition Industry Revenue (Million) Forecast, by Application 2020 & 2033
- Table 62: Rest of Asia Pacific Medical Nutrition Industry Volume (K Unit) Forecast, by Application 2020 & 2033
- Table 63: Global Medical Nutrition Industry Revenue Million Forecast, by Route of Administration 2020 & 2033
- Table 64: Global Medical Nutrition Industry Volume K Unit Forecast, by Route of Administration 2020 & 2033
- Table 65: Global Medical Nutrition Industry Revenue Million Forecast, by Application 2020 & 2033
- Table 66: Global Medical Nutrition Industry Volume K Unit Forecast, by Application 2020 & 2033
- Table 67: Global Medical Nutrition Industry Revenue Million Forecast, by End User 2020 & 2033
- Table 68: Global Medical Nutrition Industry Volume K Unit Forecast, by End User 2020 & 2033
- Table 69: Global Medical Nutrition Industry Revenue Million Forecast, by Country 2020 & 2033
- Table 70: Global Medical Nutrition Industry Volume K Unit Forecast, by Country 2020 & 2033
- Table 71: GCC Medical Nutrition Industry Revenue (Million) Forecast, by Application 2020 & 2033
- Table 72: GCC Medical Nutrition Industry Volume (K Unit) Forecast, by Application 2020 & 2033
- Table 73: South Africa Medical Nutrition Industry Revenue (Million) Forecast, by Application 2020 & 2033
- Table 74: South Africa Medical Nutrition Industry Volume (K Unit) Forecast, by Application 2020 & 2033
- Table 75: Rest of Middle East and Africa Medical Nutrition Industry Revenue (Million) Forecast, by Application 2020 & 2033
- Table 76: Rest of Middle East and Africa Medical Nutrition Industry Volume (K Unit) Forecast, by Application 2020 & 2033
- Table 77: Global Medical Nutrition Industry Revenue Million Forecast, by Route of Administration 2020 & 2033
- Table 78: Global Medical Nutrition Industry Volume K Unit Forecast, by Route of Administration 2020 & 2033
- Table 79: Global Medical Nutrition Industry Revenue Million Forecast, by Application 2020 & 2033
- Table 80: Global Medical Nutrition Industry Volume K Unit Forecast, by Application 2020 & 2033
- Table 81: Global Medical Nutrition Industry Revenue Million Forecast, by End User 2020 & 2033
- Table 82: Global Medical Nutrition Industry Volume K Unit Forecast, by End User 2020 & 2033
- Table 83: Global Medical Nutrition Industry Revenue Million Forecast, by Country 2020 & 2033
- Table 84: Global Medical Nutrition Industry Volume K Unit Forecast, by Country 2020 & 2033
- Table 85: Brazil Medical Nutrition Industry Revenue (Million) Forecast, by Application 2020 & 2033
- Table 86: Brazil Medical Nutrition Industry Volume (K Unit) Forecast, by Application 2020 & 2033
- Table 87: Argentina Medical Nutrition Industry Revenue (Million) Forecast, by Application 2020 & 2033
- Table 88: Argentina Medical Nutrition Industry Volume (K Unit) Forecast, by Application 2020 & 2033
- Table 89: Rest of South America Medical Nutrition Industry Revenue (Million) Forecast, by Application 2020 & 2033
- Table 90: Rest of South America Medical Nutrition Industry Volume (K Unit) Forecast, by Application 2020 & 2033
Frequently Asked Questions
1. What is the projected Compound Annual Growth Rate (CAGR) of the Medical Nutrition Industry?
The projected CAGR is approximately 8.05%.
2. Which companies are prominent players in the Medical Nutrition Industry?
Key companies in the market include Medifood International Ltd, Abbott Laboratories (Abbott Nutrition), Fresenius Kabi, Danone (Nutricia), Perrigo Company PLC, Nestle Health Science, Ajinomoto Cambrooke Inc (Nualtra Ltd), AYMES International Ltd, Baxter Healthcare, B Braun SE, Reckitt Benckiser.
3. What are the main segments of the Medical Nutrition Industry?
The market segments include Route of Administration, Application, End User.
4. Can you provide details about the market size?
The market size is estimated to be USD 72.29 Million as of 2022.
5. What are some drivers contributing to market growth?
Increasing Prevalence of Metabolic Disorders; High Spending on Healthcare; Growing Geriatric Population.
6. What are the notable trends driving market growth?
Oral and Enteral Segment is Expected to Hold a Significant Market Share Over the Forecast Period.
7. Are there any restraints impacting market growth?
Imprecise Perception About Clinical Nutrition; Reduction in Birth Rates.
8. Can you provide examples of recent developments in the market?
October 2022: Hologram Sciences, and Maeil Health Nutrition entered into a strategic partnership to deliver personalized nutrition solutions to the Korean market.
9. What pricing options are available for accessing the report?
Pricing options include single-user, multi-user, and enterprise licenses priced at USD 4750, USD 5250, and USD 8750 respectively.
10. Is the market size provided in terms of value or volume?
The market size is provided in terms of value, measured in Million and volume, measured in K Unit.
11. Are there any specific market keywords associated with the report?
Yes, the market keyword associated with the report is "Medical Nutrition Industry," which aids in identifying and referencing the specific market segment covered.
12. How do I determine which pricing option suits my needs best?
The pricing options vary based on user requirements and access needs. Individual users may opt for single-user licenses, while businesses requiring broader access may choose multi-user or enterprise licenses for cost-effective access to the report.
13. Are there any additional resources or data provided in the Medical Nutrition Industry report?
While the report offers comprehensive insights, it's advisable to review the specific contents or supplementary materials provided to ascertain if additional resources or data are available.
14. How can I stay updated on further developments or reports in the Medical Nutrition Industry?
To stay informed about further developments, trends, and reports in the Medical Nutrition Industry, consider subscribing to industry newsletters, following relevant companies and organizations, or regularly checking reputable industry news sources and publications.
Methodology
Step 1 - Identification of Relevant Samples Size from Population Database


Step 2 - Approaches for Defining Global Market Size (Value, Volume* & Price*)

Note*: In applicable scenarios
Step 3 - Data Sources
Primary Research
- Web Analytics
- Survey Reports
- Research Institute
- Latest Research Reports
- Opinion Leaders
Secondary Research
- Annual Reports
- White Paper
- Latest Press Release
- Industry Association
- Paid Database
- Investor Presentations

Step 4 - Data Triangulation
Involves using different sources of information in order to increase the validity of a study
These sources are likely to be stakeholders in a program - participants, other researchers, program staff, other community members, and so on.
Then we put all data in single framework & apply various statistical tools to find out the dynamic on the market.
During the analysis stage, feedback from the stakeholder groups would be compared to determine areas of agreement as well as areas of divergence