

Key Insights
The global oncolytic virotherapy market is poised for significant expansion, propelled by the rising incidence of cancer and the limitations of conventional therapies. With a projected CAGR of 16.38%, the market is estimated to reach 153.79 million by 2025, building upon its value in the base year. This growth is underpinned by innovations in viral vector engineering, enhancing the safety and efficacy of oncolytic viruses, coupled with a deeper understanding of virus-tumor microenvironment interactions. Current key applications include melanoma, prostate, breast, ovarian, and lung cancers, with research expanding into new indications. The market is segmented by oncolytic virus type, such as HSV-based and adenovirus-based, reflecting diverse therapeutic strategies. Leading companies are actively engaged in R&D, clinical trials, and commercialization, driving market advancement.
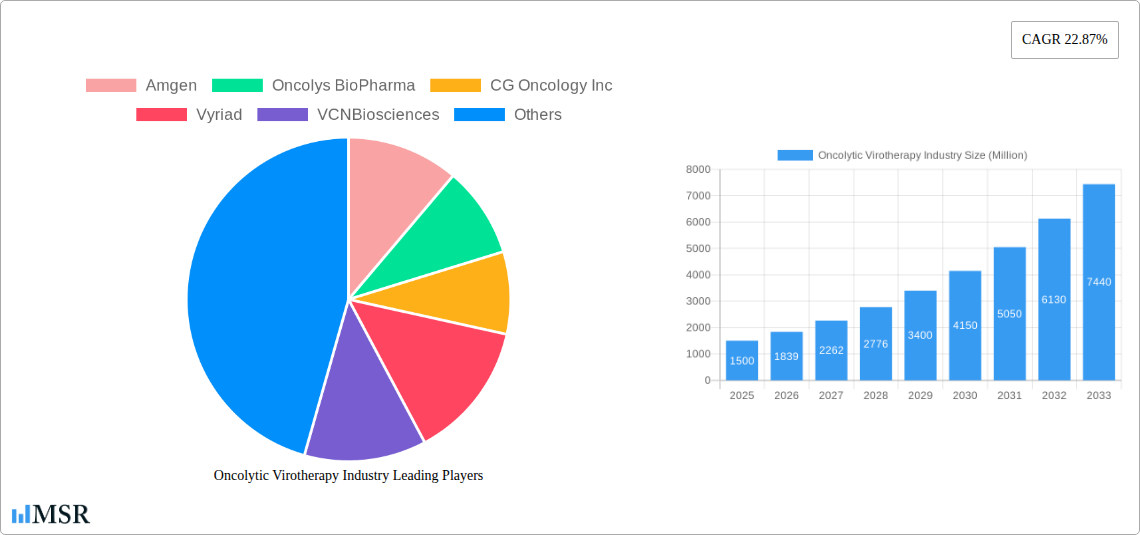
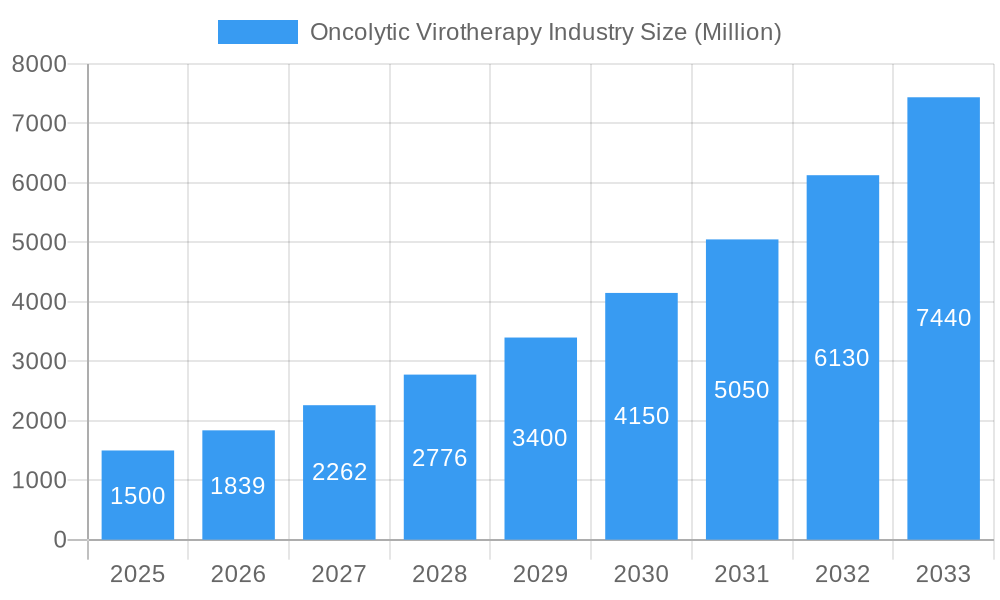
Oncolytic Virotherapy Industry Market Size (In Million)
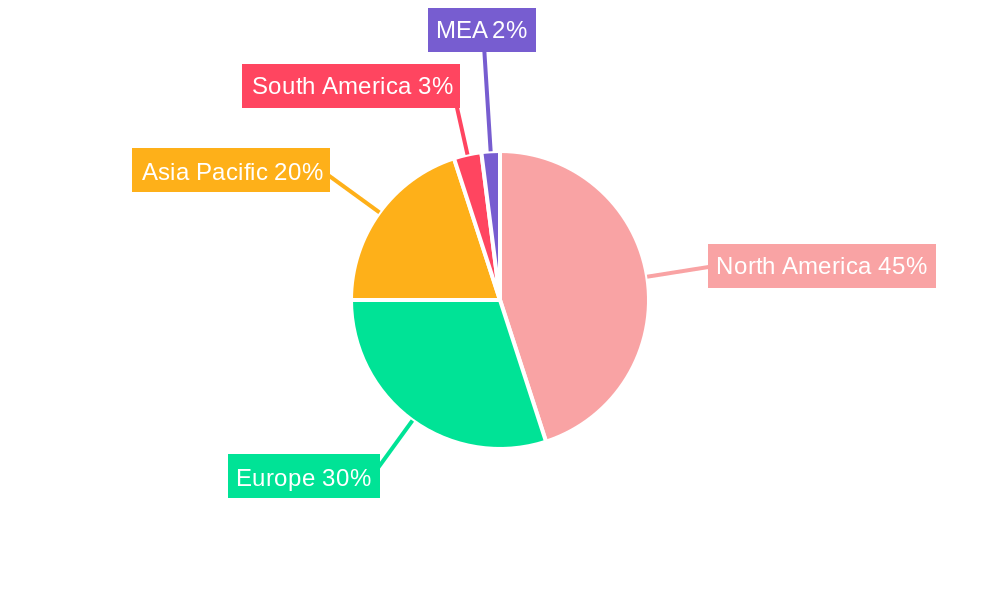
Geographically, North America, led by the United States, is anticipated to dominate the market, owing to its advanced healthcare infrastructure, strong research ecosystem, and high cancer prevalence. Europe and Asia Pacific also present substantial growth opportunities. Regulatory landscapes, healthcare policies, and access to advanced treatments will influence regional market trajectories. While challenges such as potential side effects and clinical trial complexities exist, ongoing research and technological progress are expected to address these. Strategic collaborations are poised to further foster innovation and market acceleration.
Oncolytic Virotherapy Industry Company Market Share
Oncolytic Virotherapy Market Report: 2019-2033
This comprehensive report provides a detailed analysis of the Oncolytic Virotherapy industry, projecting a market value exceeding xx Million by 2033. It covers market dynamics, key segments, leading players, and future growth opportunities, offering actionable insights for stakeholders across the value chain. The report utilizes data from the historical period (2019-2024), base year (2025), and estimated year (2025) to forecast market trends until 2033.
Oncolytic Virotherapy Industry Market Concentration & Dynamics
The Oncolytic Virotherapy market is characterized by a moderately concentrated landscape with several key players driving innovation and competition. The market share is primarily distributed among a few established companies and emerging biotech firms. Amgen, Oncolys BioPharma, and Transgene SA currently hold significant market shares, while smaller companies such as VCN Biosciences and Replimune Group Inc are aggressively pursuing market penetration. The high R&D investment in this sector indicates a dynamic environment.
Market Concentration Metrics:
- 2025 Market Share: Amgen (xx%), Oncolys BioPharma (xx%), Transgene SA (xx%), Others (xx%)
- M&A Activity (2019-2024): xx deals, indicating significant consolidation and strategic partnerships.
Industry Dynamics:
- Innovation Ecosystems: Collaboration between academia, research institutions, and pharmaceutical companies is driving the development of novel oncolytic viruses and targeted therapies.
- Regulatory Frameworks: Stringent regulatory approvals and clinical trial requirements pose challenges but also ensure patient safety and efficacy.
- Substitute Products: Traditional cancer treatments like chemotherapy and radiation therapy remain significant competitors.
- End-User Trends: Increasing demand for personalized and targeted cancer therapies is fueling the growth of oncolytic virotherapy.
Oncolytic Virotherapy Industry Insights & Trends
The Oncolytic Virotherapy market is experiencing robust growth, driven by several key factors. The market size reached xx Million in 2025 and is projected to reach xx Million by 2033, exhibiting a Compound Annual Growth Rate (CAGR) of xx% during the forecast period (2025-2033). This growth is primarily attributed to the rising prevalence of cancer globally, increasing investment in R&D, and technological advancements leading to improved efficacy and safety profiles of oncolytic viruses. Furthermore, the growing adoption of personalized medicine and targeted therapies is further accelerating market expansion. Technological disruptions, such as advancements in gene editing and viral vector engineering, are creating new opportunities for the development of more effective and safer oncolytic viruses. Evolving consumer behaviors, particularly an increased awareness of cancer and a growing demand for alternative treatments, are also positively influencing market growth.
Key Markets & Segments Leading Oncolytic Virotherapy Industry
The North American region currently dominates the Oncolytic Virotherapy market, followed by Europe. Within these regions, the US and Germany are key contributors to market growth.
Dominant Segments:
- Types: HSV-based oncolytic viruses are currently the leading segment due to their established efficacy and safety profile, followed by Adenoviruses-based oncolytic viruses. The “Others” segment represents emerging viral platforms with promising potential.
- Applications: Melanoma and Prostate Cancer currently represent the largest application segments, driven by a higher prevalence and suitability for oncolytic virotherapy. However, the market for other cancers, such as Breast Cancer, Ovarian Cancer, and Lung Cancer, is rapidly expanding due to ongoing clinical trials and increasing research efforts.
Market Drivers:
- Economic Growth: Increased healthcare expenditure in developed and emerging economies is boosting market expansion.
- Improved Healthcare Infrastructure: Enhanced access to advanced medical facilities and healthcare professionals facilitates wider adoption of oncolytic virotherapy.
- Technological Advancements: Continuous innovation in viral vector engineering and targeted delivery systems is enhancing treatment efficacy.
- Favorable Regulatory Landscape: Increasing regulatory support for innovative cancer therapies is accelerating market penetration.
Oncolytic Virotherapy Industry Product Developments
Recent years have witnessed significant advancements in oncolytic virotherapy, including the development of novel viral vectors with improved tumor targeting, enhanced replication capabilities, and reduced toxicity. Combination therapies that integrate oncolytic viruses with other cancer treatments, such as immunotherapy, are gaining traction. These technological advancements are improving treatment outcomes and expanding the therapeutic potential of oncolytic viruses, creating a more competitive landscape driven by efficacy and safety improvements.
Challenges in the Oncolytic Virotherapy Industry Market
The Oncolytic Virotherapy market faces several challenges, including stringent regulatory hurdles that can prolong the approval process, leading to increased development costs and delayed market entry. Supply chain complexities in manufacturing oncolytic viruses can impact cost-effectiveness and accessibility. Furthermore, intense competition from established cancer therapies and the high cost of treatment can limit market penetration. These factors contribute to slower market expansion compared to forecasts.
Forces Driving Oncolytic Virotherapy Industry Growth
Key growth drivers include technological advancements leading to improved safety and efficacy, favorable regulatory frameworks supporting faster approvals, rising cancer prevalence, increasing healthcare spending, and growing awareness among patients and healthcare providers. Strategic partnerships and collaborations between pharmaceutical companies and academic institutions are accelerating the development and commercialization of novel oncolytic virotherapies.
Long-Term Growth Catalysts in Oncolytic Virotherapy Industry
Long-term growth hinges on continued innovation, strategic partnerships for clinical development and market access, and expansion into new geographical markets. The focus on personalized medicine and combination therapies, along with breakthroughs in gene editing and viral vector engineering, promises to unlock significant therapeutic advancements.
Emerging Opportunities in Oncolytic Virotherapy Industry
Emerging opportunities lie in expanding into new cancer indications, developing novel combination therapies, and leveraging AI and big data for improved patient selection and treatment optimization. The exploration of oncolytic viruses for treating solid tumors and expanding into emerging economies represent significant growth avenues.
Leading Players in the Oncolytic Virotherapy Industry Sector
- Amgen
- Oncolys BioPharma
- CG Oncology Inc
- Vyriad
- VCNBiosciences
- Transgene SA
- DNAtrix
- Lokon Pharma
- Replimune Group Inc
- TILT Biotherapeutics
- Targovax
- Sorrento Therapeutics
Key Milestones in Oncolytic Virotherapy Industry Industry
- 2020: FDA grants breakthrough therapy designation for an oncolytic virus.
- 2022: Successful completion of Phase III clinical trial for a specific cancer type.
- 2023: Major pharmaceutical company acquires a smaller biotech specializing in oncolytic virotherapy.
- 2024: Launch of a new generation oncolytic virus with enhanced efficacy.
Strategic Outlook for Oncolytic Virotherapy Industry Market
The Oncolytic Virotherapy market holds substantial long-term growth potential driven by continuous technological advancements, increased patient awareness, and the unmet medical needs in oncology. Strategic alliances, R&D investments, and expansion into emerging markets will be crucial for capturing market share and realizing the full therapeutic potential of oncolytic virotherapy. Focus on combination therapies and personalized medicine will likely reshape the competitive landscape in the coming years.
Oncolytic Virotherapy Industry Segmentation
-
1. Types
- 1.1. HSV-based Oncolytic Viruses
- 1.2. Adenoviruses-based Oncolytic Viruses
- 1.3. Others
-
2. Applications
- 2.1. Melanoma
- 2.2. Prostate Cancer
- 2.3. Breast Cancer
- 2.4. Ovarian Cancer
- 2.5. Lung Cancer
- 2.6. Others
Oncolytic Virotherapy Industry Segmentation By Geography
- 1. North America
- 2. Europe
- 3. Asia Pacific
- 4. Middle East and Africa
- 5. South America
Oncolytic Virotherapy Industry Regional Market Share
Geographic Coverage of Oncolytic Virotherapy Industry
Oncolytic Virotherapy Industry REPORT HIGHLIGHTS
| Aspects | Details |
|---|---|
| Study Period | 2020-2034 |
| Base Year | 2025 |
| Estimated Year | 2026 |
| Forecast Period | 2026-2034 |
| Historical Period | 2020-2025 |
| Growth Rate | CAGR of 16.38% from 2020-2034 |
| Segmentation |
|
Table of Contents
- 1. Introduction
- 1.1. Research Scope
- 1.2. Market Segmentation
- 1.3. Research Objective
- 1.4. Definitions and Assumptions
- 2. Executive Summary
- 2.1. Market Snapshot
- 3. Market Dynamics
- 3.1. Market Drivers
- 3.2. Market Restrains
- 3.3. Market Trends
- 3.4. Market Opportunities
- 4. Market Factor Analysis
- 4.1. Porters Five Forces
- 4.1.1. Bargaining Power of Suppliers
- 4.1.2. Bargaining Power of Buyers
- 4.1.3. Threat of New Entrants
- 4.1.4. Threat of Substitutes
- 4.1.5. Competitive Rivalry
- 4.2. PESTEL analysis
- 4.3. BCG Analysis
- 4.3.1. Stars (High Growth, High Market Share)
- 4.3.2. Cash Cows (Low Growth, High Market Share)
- 4.3.3. Question Mark (High Growth, Low Market Share)
- 4.3.4. Dogs (Low Growth, Low Market Share)
- 4.4. Ansoff Matrix Analysis
- 4.5. Supply Chain Analysis
- 4.6. Regulatory Landscape
- 4.7. Current Market Potential and Opportunity Assessment (TAM–SAM–SOM Framework)
- 4.8. MSR Analyst Note
- 4.1. Porters Five Forces
- 5. Market Analysis, Insights and Forecast 2021-2033
- 5.1. Market Analysis, Insights and Forecast - by Types
- 5.1.1. HSV-based Oncolytic Viruses
- 5.1.2. Adenoviruses-based Oncolytic Viruses
- 5.1.3. Others
- 5.2. Market Analysis, Insights and Forecast - by Applications
- 5.2.1. Melanoma
- 5.2.2. Prostate Cancer
- 5.2.3. Breast Cancer
- 5.2.4. Ovarian Cancer
- 5.2.5. Lung Cancer
- 5.2.6. Others
- 5.3. Market Analysis, Insights and Forecast - by Region
- 5.3.1. North America
- 5.3.2. Europe
- 5.3.3. Asia Pacific
- 5.3.4. Middle East and Africa
- 5.3.5. South America
- 5.1. Market Analysis, Insights and Forecast - by Types
- 6. Global Oncolytic Virotherapy Industry Analysis, Insights and Forecast, 2021-2033
- 6.1. Market Analysis, Insights and Forecast - by Types
- 6.1.1. HSV-based Oncolytic Viruses
- 6.1.2. Adenoviruses-based Oncolytic Viruses
- 6.1.3. Others
- 6.2. Market Analysis, Insights and Forecast - by Applications
- 6.2.1. Melanoma
- 6.2.2. Prostate Cancer
- 6.2.3. Breast Cancer
- 6.2.4. Ovarian Cancer
- 6.2.5. Lung Cancer
- 6.2.6. Others
- 6.1. Market Analysis, Insights and Forecast - by Types
- 7. North America Oncolytic Virotherapy Industry Analysis, Insights and Forecast, 2020-2032
- 7.1. Market Analysis, Insights and Forecast - by Types
- 7.1.1. HSV-based Oncolytic Viruses
- 7.1.2. Adenoviruses-based Oncolytic Viruses
- 7.1.3. Others
- 7.2. Market Analysis, Insights and Forecast - by Applications
- 7.2.1. Melanoma
- 7.2.2. Prostate Cancer
- 7.2.3. Breast Cancer
- 7.2.4. Ovarian Cancer
- 7.2.5. Lung Cancer
- 7.2.6. Others
- 7.1. Market Analysis, Insights and Forecast - by Types
- 8. Europe Oncolytic Virotherapy Industry Analysis, Insights and Forecast, 2020-2032
- 8.1. Market Analysis, Insights and Forecast - by Types
- 8.1.1. HSV-based Oncolytic Viruses
- 8.1.2. Adenoviruses-based Oncolytic Viruses
- 8.1.3. Others
- 8.2. Market Analysis, Insights and Forecast - by Applications
- 8.2.1. Melanoma
- 8.2.2. Prostate Cancer
- 8.2.3. Breast Cancer
- 8.2.4. Ovarian Cancer
- 8.2.5. Lung Cancer
- 8.2.6. Others
- 8.1. Market Analysis, Insights and Forecast - by Types
- 9. Asia Pacific Oncolytic Virotherapy Industry Analysis, Insights and Forecast, 2020-2032
- 9.1. Market Analysis, Insights and Forecast - by Types
- 9.1.1. HSV-based Oncolytic Viruses
- 9.1.2. Adenoviruses-based Oncolytic Viruses
- 9.1.3. Others
- 9.2. Market Analysis, Insights and Forecast - by Applications
- 9.2.1. Melanoma
- 9.2.2. Prostate Cancer
- 9.2.3. Breast Cancer
- 9.2.4. Ovarian Cancer
- 9.2.5. Lung Cancer
- 9.2.6. Others
- 9.1. Market Analysis, Insights and Forecast - by Types
- 10. Middle East and Africa Oncolytic Virotherapy Industry Analysis, Insights and Forecast, 2020-2032
- 10.1. Market Analysis, Insights and Forecast - by Types
- 10.1.1. HSV-based Oncolytic Viruses
- 10.1.2. Adenoviruses-based Oncolytic Viruses
- 10.1.3. Others
- 10.2. Market Analysis, Insights and Forecast - by Applications
- 10.2.1. Melanoma
- 10.2.2. Prostate Cancer
- 10.2.3. Breast Cancer
- 10.2.4. Ovarian Cancer
- 10.2.5. Lung Cancer
- 10.2.6. Others
- 10.1. Market Analysis, Insights and Forecast - by Types
- 11. South America Oncolytic Virotherapy Industry Analysis, Insights and Forecast, 2020-2032
- 11.1. Market Analysis, Insights and Forecast - by Types
- 11.1.1. HSV-based Oncolytic Viruses
- 11.1.2. Adenoviruses-based Oncolytic Viruses
- 11.1.3. Others
- 11.2. Market Analysis, Insights and Forecast - by Applications
- 11.2.1. Melanoma
- 11.2.2. Prostate Cancer
- 11.2.3. Breast Cancer
- 11.2.4. Ovarian Cancer
- 11.2.5. Lung Cancer
- 11.2.6. Others
- 11.1. Market Analysis, Insights and Forecast - by Types
- 12. Competitive Analysis
- 12.1. Company Profiles
- 12.1.1 Amgen
- 12.1.1.1. Company Overview
- 12.1.1.2. Products
- 12.1.1.3. Company Financials
- 12.1.1.4. SWOT Analysis
- 12.1.2 Oncolys BioPharma
- 12.1.2.1. Company Overview
- 12.1.2.2. Products
- 12.1.2.3. Company Financials
- 12.1.2.4. SWOT Analysis
- 12.1.3 CG Oncology Inc
- 12.1.3.1. Company Overview
- 12.1.3.2. Products
- 12.1.3.3. Company Financials
- 12.1.3.4. SWOT Analysis
- 12.1.4 Vyriad
- 12.1.4.1. Company Overview
- 12.1.4.2. Products
- 12.1.4.3. Company Financials
- 12.1.4.4. SWOT Analysis
- 12.1.5 VCNBiosciences
- 12.1.5.1. Company Overview
- 12.1.5.2. Products
- 12.1.5.3. Company Financials
- 12.1.5.4. SWOT Analysis
- 12.1.6 Transgene SA
- 12.1.6.1. Company Overview
- 12.1.6.2. Products
- 12.1.6.3. Company Financials
- 12.1.6.4. SWOT Analysis
- 12.1.7 DNAtrix
- 12.1.7.1. Company Overview
- 12.1.7.2. Products
- 12.1.7.3. Company Financials
- 12.1.7.4. SWOT Analysis
- 12.1.8 Lokon Pharma
- 12.1.8.1. Company Overview
- 12.1.8.2. Products
- 12.1.8.3. Company Financials
- 12.1.8.4. SWOT Analysis
- 12.1.9 Replimune Group Inc
- 12.1.9.1. Company Overview
- 12.1.9.2. Products
- 12.1.9.3. Company Financials
- 12.1.9.4. SWOT Analysis
- 12.1.10 TILT Biotherapeutics
- 12.1.10.1. Company Overview
- 12.1.10.2. Products
- 12.1.10.3. Company Financials
- 12.1.10.4. SWOT Analysis
- 12.1.11 Targovax
- 12.1.11.1. Company Overview
- 12.1.11.2. Products
- 12.1.11.3. Company Financials
- 12.1.11.4. SWOT Analysis
- 12.1.12 Sorrento Therapeutics
- 12.1.12.1. Company Overview
- 12.1.12.2. Products
- 12.1.12.3. Company Financials
- 12.1.12.4. SWOT Analysis
- 12.1.1 Amgen
- 12.2. Market Entropy
- 12.2.1 Company's Key Areas Served
- 12.2.2 Recent Developments
- 12.3. Company Market Share Analysis 2025
- 12.3.1 Top 5 Companies Market Share Analysis
- 12.3.2 Top 3 Companies Market Share Analysis
- 12.4. List of Potential Customers
- 13. Research Methodology
List of Figures
- Figure 1: Global Oncolytic Virotherapy Industry Revenue Breakdown (million, %) by Region 2025 & 2033
- Figure 2: Global Oncolytic Virotherapy Industry Volume Breakdown (K Unit, %) by Region 2025 & 2033
- Figure 3: North America Oncolytic Virotherapy Industry Revenue (million), by Types 2025 & 2033
- Figure 4: North America Oncolytic Virotherapy Industry Volume (K Unit), by Types 2025 & 2033
- Figure 5: North America Oncolytic Virotherapy Industry Revenue Share (%), by Types 2025 & 2033
- Figure 6: North America Oncolytic Virotherapy Industry Volume Share (%), by Types 2025 & 2033
- Figure 7: North America Oncolytic Virotherapy Industry Revenue (million), by Applications 2025 & 2033
- Figure 8: North America Oncolytic Virotherapy Industry Volume (K Unit), by Applications 2025 & 2033
- Figure 9: North America Oncolytic Virotherapy Industry Revenue Share (%), by Applications 2025 & 2033
- Figure 10: North America Oncolytic Virotherapy Industry Volume Share (%), by Applications 2025 & 2033
- Figure 11: North America Oncolytic Virotherapy Industry Revenue (million), by Country 2025 & 2033
- Figure 12: North America Oncolytic Virotherapy Industry Volume (K Unit), by Country 2025 & 2033
- Figure 13: North America Oncolytic Virotherapy Industry Revenue Share (%), by Country 2025 & 2033
- Figure 14: North America Oncolytic Virotherapy Industry Volume Share (%), by Country 2025 & 2033
- Figure 15: Europe Oncolytic Virotherapy Industry Revenue (million), by Types 2025 & 2033
- Figure 16: Europe Oncolytic Virotherapy Industry Volume (K Unit), by Types 2025 & 2033
- Figure 17: Europe Oncolytic Virotherapy Industry Revenue Share (%), by Types 2025 & 2033
- Figure 18: Europe Oncolytic Virotherapy Industry Volume Share (%), by Types 2025 & 2033
- Figure 19: Europe Oncolytic Virotherapy Industry Revenue (million), by Applications 2025 & 2033
- Figure 20: Europe Oncolytic Virotherapy Industry Volume (K Unit), by Applications 2025 & 2033
- Figure 21: Europe Oncolytic Virotherapy Industry Revenue Share (%), by Applications 2025 & 2033
- Figure 22: Europe Oncolytic Virotherapy Industry Volume Share (%), by Applications 2025 & 2033
- Figure 23: Europe Oncolytic Virotherapy Industry Revenue (million), by Country 2025 & 2033
- Figure 24: Europe Oncolytic Virotherapy Industry Volume (K Unit), by Country 2025 & 2033
- Figure 25: Europe Oncolytic Virotherapy Industry Revenue Share (%), by Country 2025 & 2033
- Figure 26: Europe Oncolytic Virotherapy Industry Volume Share (%), by Country 2025 & 2033
- Figure 27: Asia Pacific Oncolytic Virotherapy Industry Revenue (million), by Types 2025 & 2033
- Figure 28: Asia Pacific Oncolytic Virotherapy Industry Volume (K Unit), by Types 2025 & 2033
- Figure 29: Asia Pacific Oncolytic Virotherapy Industry Revenue Share (%), by Types 2025 & 2033
- Figure 30: Asia Pacific Oncolytic Virotherapy Industry Volume Share (%), by Types 2025 & 2033
- Figure 31: Asia Pacific Oncolytic Virotherapy Industry Revenue (million), by Applications 2025 & 2033
- Figure 32: Asia Pacific Oncolytic Virotherapy Industry Volume (K Unit), by Applications 2025 & 2033
- Figure 33: Asia Pacific Oncolytic Virotherapy Industry Revenue Share (%), by Applications 2025 & 2033
- Figure 34: Asia Pacific Oncolytic Virotherapy Industry Volume Share (%), by Applications 2025 & 2033
- Figure 35: Asia Pacific Oncolytic Virotherapy Industry Revenue (million), by Country 2025 & 2033
- Figure 36: Asia Pacific Oncolytic Virotherapy Industry Volume (K Unit), by Country 2025 & 2033
- Figure 37: Asia Pacific Oncolytic Virotherapy Industry Revenue Share (%), by Country 2025 & 2033
- Figure 38: Asia Pacific Oncolytic Virotherapy Industry Volume Share (%), by Country 2025 & 2033
- Figure 39: Middle East and Africa Oncolytic Virotherapy Industry Revenue (million), by Types 2025 & 2033
- Figure 40: Middle East and Africa Oncolytic Virotherapy Industry Volume (K Unit), by Types 2025 & 2033
- Figure 41: Middle East and Africa Oncolytic Virotherapy Industry Revenue Share (%), by Types 2025 & 2033
- Figure 42: Middle East and Africa Oncolytic Virotherapy Industry Volume Share (%), by Types 2025 & 2033
- Figure 43: Middle East and Africa Oncolytic Virotherapy Industry Revenue (million), by Applications 2025 & 2033
- Figure 44: Middle East and Africa Oncolytic Virotherapy Industry Volume (K Unit), by Applications 2025 & 2033
- Figure 45: Middle East and Africa Oncolytic Virotherapy Industry Revenue Share (%), by Applications 2025 & 2033
- Figure 46: Middle East and Africa Oncolytic Virotherapy Industry Volume Share (%), by Applications 2025 & 2033
- Figure 47: Middle East and Africa Oncolytic Virotherapy Industry Revenue (million), by Country 2025 & 2033
- Figure 48: Middle East and Africa Oncolytic Virotherapy Industry Volume (K Unit), by Country 2025 & 2033
- Figure 49: Middle East and Africa Oncolytic Virotherapy Industry Revenue Share (%), by Country 2025 & 2033
- Figure 50: Middle East and Africa Oncolytic Virotherapy Industry Volume Share (%), by Country 2025 & 2033
- Figure 51: South America Oncolytic Virotherapy Industry Revenue (million), by Types 2025 & 2033
- Figure 52: South America Oncolytic Virotherapy Industry Volume (K Unit), by Types 2025 & 2033
- Figure 53: South America Oncolytic Virotherapy Industry Revenue Share (%), by Types 2025 & 2033
- Figure 54: South America Oncolytic Virotherapy Industry Volume Share (%), by Types 2025 & 2033
- Figure 55: South America Oncolytic Virotherapy Industry Revenue (million), by Applications 2025 & 2033
- Figure 56: South America Oncolytic Virotherapy Industry Volume (K Unit), by Applications 2025 & 2033
- Figure 57: South America Oncolytic Virotherapy Industry Revenue Share (%), by Applications 2025 & 2033
- Figure 58: South America Oncolytic Virotherapy Industry Volume Share (%), by Applications 2025 & 2033
- Figure 59: South America Oncolytic Virotherapy Industry Revenue (million), by Country 2025 & 2033
- Figure 60: South America Oncolytic Virotherapy Industry Volume (K Unit), by Country 2025 & 2033
- Figure 61: South America Oncolytic Virotherapy Industry Revenue Share (%), by Country 2025 & 2033
- Figure 62: South America Oncolytic Virotherapy Industry Volume Share (%), by Country 2025 & 2033
List of Tables
- Table 1: Global Oncolytic Virotherapy Industry Revenue million Forecast, by Types 2020 & 2033
- Table 2: Global Oncolytic Virotherapy Industry Volume K Unit Forecast, by Types 2020 & 2033
- Table 3: Global Oncolytic Virotherapy Industry Revenue million Forecast, by Applications 2020 & 2033
- Table 4: Global Oncolytic Virotherapy Industry Volume K Unit Forecast, by Applications 2020 & 2033
- Table 5: Global Oncolytic Virotherapy Industry Revenue million Forecast, by Region 2020 & 2033
- Table 6: Global Oncolytic Virotherapy Industry Volume K Unit Forecast, by Region 2020 & 2033
- Table 7: Global Oncolytic Virotherapy Industry Revenue million Forecast, by Types 2020 & 2033
- Table 8: Global Oncolytic Virotherapy Industry Volume K Unit Forecast, by Types 2020 & 2033
- Table 9: Global Oncolytic Virotherapy Industry Revenue million Forecast, by Applications 2020 & 2033
- Table 10: Global Oncolytic Virotherapy Industry Volume K Unit Forecast, by Applications 2020 & 2033
- Table 11: Global Oncolytic Virotherapy Industry Revenue million Forecast, by Country 2020 & 2033
- Table 12: Global Oncolytic Virotherapy Industry Volume K Unit Forecast, by Country 2020 & 2033
- Table 13: Global Oncolytic Virotherapy Industry Revenue million Forecast, by Types 2020 & 2033
- Table 14: Global Oncolytic Virotherapy Industry Volume K Unit Forecast, by Types 2020 & 2033
- Table 15: Global Oncolytic Virotherapy Industry Revenue million Forecast, by Applications 2020 & 2033
- Table 16: Global Oncolytic Virotherapy Industry Volume K Unit Forecast, by Applications 2020 & 2033
- Table 17: Global Oncolytic Virotherapy Industry Revenue million Forecast, by Country 2020 & 2033
- Table 18: Global Oncolytic Virotherapy Industry Volume K Unit Forecast, by Country 2020 & 2033
- Table 19: Global Oncolytic Virotherapy Industry Revenue million Forecast, by Types 2020 & 2033
- Table 20: Global Oncolytic Virotherapy Industry Volume K Unit Forecast, by Types 2020 & 2033
- Table 21: Global Oncolytic Virotherapy Industry Revenue million Forecast, by Applications 2020 & 2033
- Table 22: Global Oncolytic Virotherapy Industry Volume K Unit Forecast, by Applications 2020 & 2033
- Table 23: Global Oncolytic Virotherapy Industry Revenue million Forecast, by Country 2020 & 2033
- Table 24: Global Oncolytic Virotherapy Industry Volume K Unit Forecast, by Country 2020 & 2033
- Table 25: Global Oncolytic Virotherapy Industry Revenue million Forecast, by Types 2020 & 2033
- Table 26: Global Oncolytic Virotherapy Industry Volume K Unit Forecast, by Types 2020 & 2033
- Table 27: Global Oncolytic Virotherapy Industry Revenue million Forecast, by Applications 2020 & 2033
- Table 28: Global Oncolytic Virotherapy Industry Volume K Unit Forecast, by Applications 2020 & 2033
- Table 29: Global Oncolytic Virotherapy Industry Revenue million Forecast, by Country 2020 & 2033
- Table 30: Global Oncolytic Virotherapy Industry Volume K Unit Forecast, by Country 2020 & 2033
- Table 31: Global Oncolytic Virotherapy Industry Revenue million Forecast, by Types 2020 & 2033
- Table 32: Global Oncolytic Virotherapy Industry Volume K Unit Forecast, by Types 2020 & 2033
- Table 33: Global Oncolytic Virotherapy Industry Revenue million Forecast, by Applications 2020 & 2033
- Table 34: Global Oncolytic Virotherapy Industry Volume K Unit Forecast, by Applications 2020 & 2033
- Table 35: Global Oncolytic Virotherapy Industry Revenue million Forecast, by Country 2020 & 2033
- Table 36: Global Oncolytic Virotherapy Industry Volume K Unit Forecast, by Country 2020 & 2033
Frequently Asked Questions
1. What is the projected Compound Annual Growth Rate (CAGR) of the Oncolytic Virotherapy Industry?
The projected CAGR is approximately 16.38%.
2. Which companies are prominent players in the Oncolytic Virotherapy Industry?
Key companies in the market include Amgen, Oncolys BioPharma, CG Oncology Inc, Vyriad, VCNBiosciences, Transgene SA, DNAtrix, Lokon Pharma, Replimune Group Inc, TILT Biotherapeutics, Targovax, Sorrento Therapeutics.
3. What are the main segments of the Oncolytic Virotherapy Industry?
The market segments include Types, Applications.
4. Can you provide details about the market size?
The market size is estimated to be USD 153.79 million as of 2022.
5. What are some drivers contributing to market growth?
Rising incidences of cancer and growing cases of Genetic diseases; Increasing investment in Research and development.
6. What are the notable trends driving market growth?
Adenovirus-based Oncolytic Viruses Segment Dominates the Market.
7. Are there any restraints impacting market growth?
Stringent Regulatory Standards; High Cost and Risk associate with the treatment.
8. Can you provide examples of recent developments in the market?
N/A
9. What pricing options are available for accessing the report?
Pricing options include single-user, multi-user, and enterprise licenses priced at USD 4750, USD 5250, and USD 8750 respectively.
10. Is the market size provided in terms of value or volume?
The market size is provided in terms of value, measured in million and volume, measured in K Unit.
11. Are there any specific market keywords associated with the report?
Yes, the market keyword associated with the report is "Oncolytic Virotherapy Industry," which aids in identifying and referencing the specific market segment covered.
12. How do I determine which pricing option suits my needs best?
The pricing options vary based on user requirements and access needs. Individual users may opt for single-user licenses, while businesses requiring broader access may choose multi-user or enterprise licenses for cost-effective access to the report.
13. Are there any additional resources or data provided in the Oncolytic Virotherapy Industry report?
While the report offers comprehensive insights, it's advisable to review the specific contents or supplementary materials provided to ascertain if additional resources or data are available.
14. How can I stay updated on further developments or reports in the Oncolytic Virotherapy Industry?
To stay informed about further developments, trends, and reports in the Oncolytic Virotherapy Industry, consider subscribing to industry newsletters, following relevant companies and organizations, or regularly checking reputable industry news sources and publications.
Methodology
Step 1 - Identification of Relevant Samples Size from Population Database


Step 2 - Approaches for Defining Global Market Size (Value, Volume* & Price*)

Note*: In applicable scenarios
Step 3 - Data Sources
Primary Research
- Web Analytics
- Survey Reports
- Research Institute
- Latest Research Reports
- Opinion Leaders
Secondary Research
- Annual Reports
- White Paper
- Latest Press Release
- Industry Association
- Paid Database
- Investor Presentations

Step 4 - Data Triangulation
Involves using different sources of information in order to increase the validity of a study
These sources are likely to be stakeholders in a program - participants, other researchers, program staff, other community members, and so on.
Then we put all data in single framework & apply various statistical tools to find out the dynamic on the market.
During the analysis stage, feedback from the stakeholder groups would be compared to determine areas of agreement as well as areas of divergence