

Key Insights into the Preservative-Free Eye Drops Market
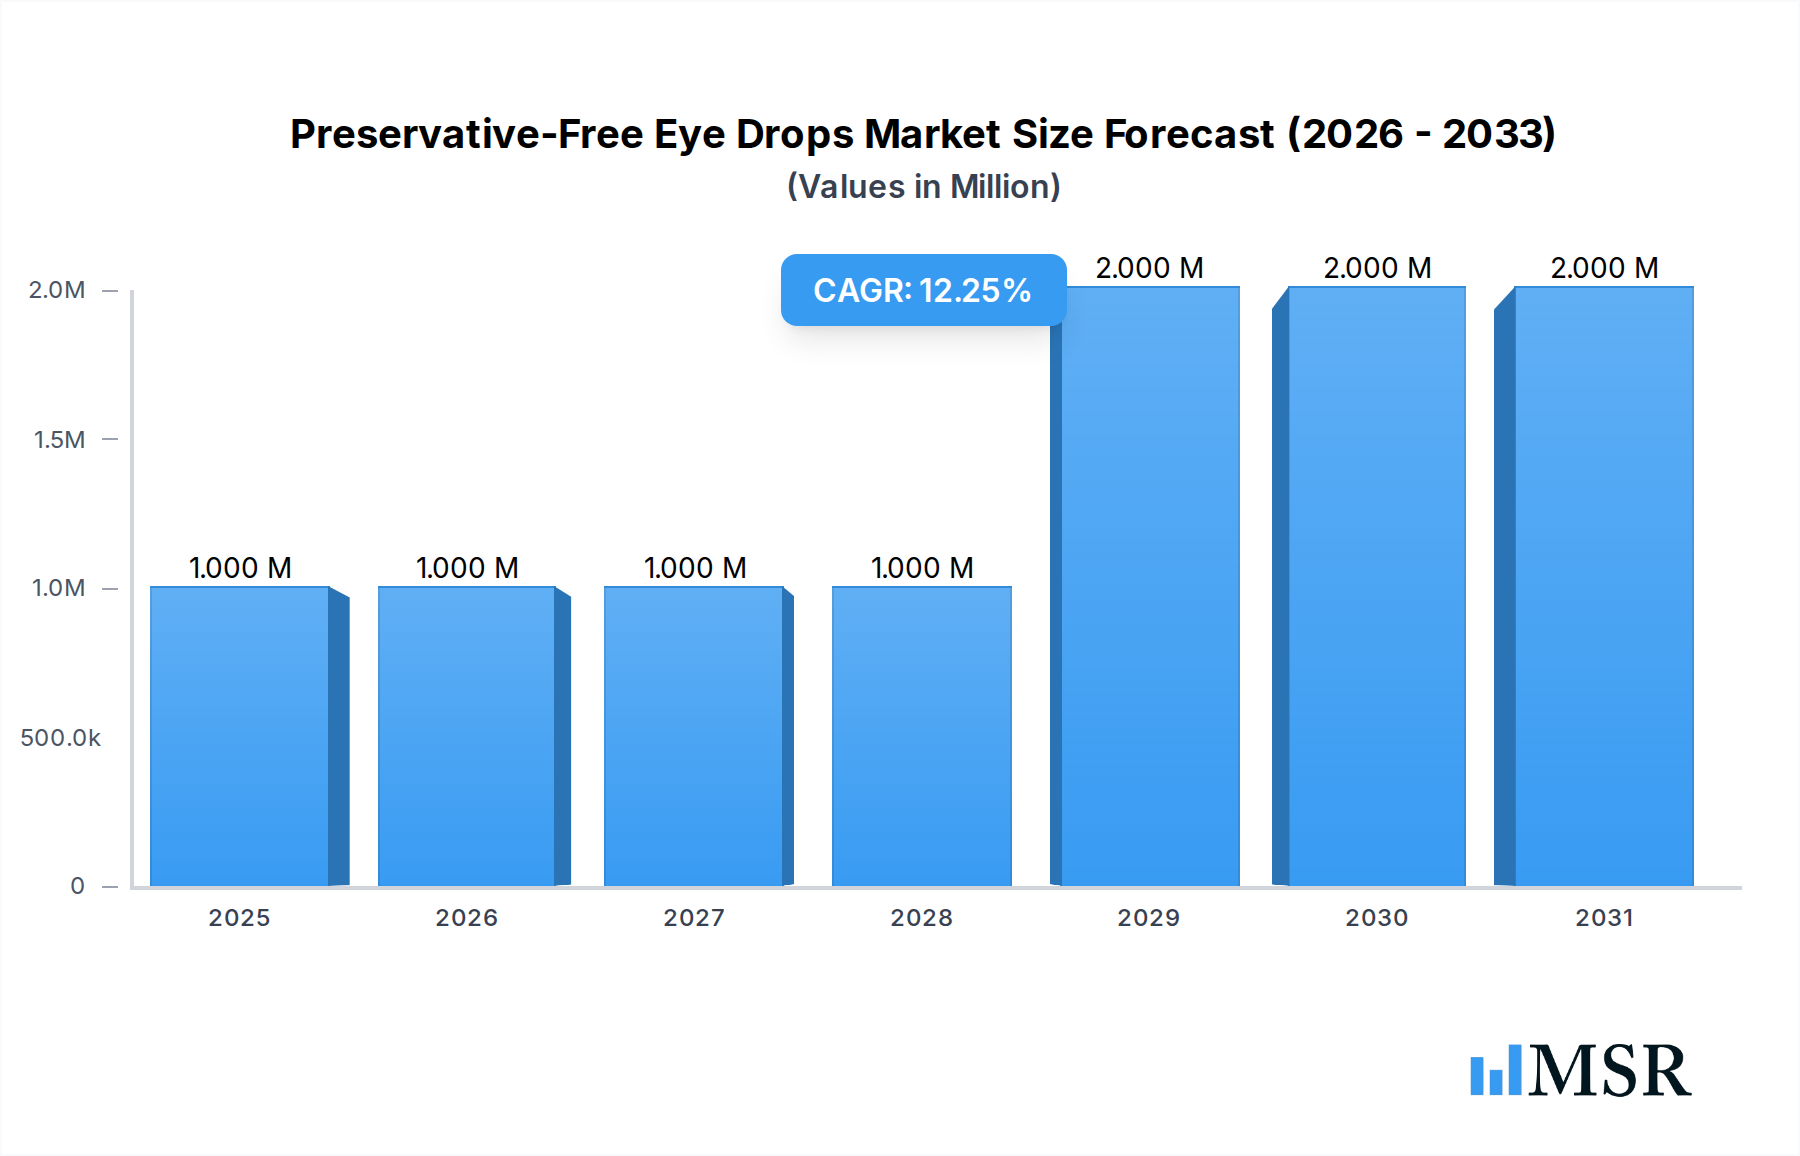
The Preservative-Free Eye Drops Market is demonstrating robust expansion, driven by increasing patient preference for gentler formulations and heightened awareness of ocular surface toxicity associated with traditional preserved eye drops. Valued at an estimated $1.21 billion in 2024, the market is projected to expand significantly, achieving a Compound Annual Growth Rate (CAGR) of 4.7% through 2034. This growth trajectory is anticipated to propel the market valuation to approximately $1.92 billion by the end of the forecast period.

Preservative-Free Eye Drops Market Size (In Million)
Key demand drivers include the escalating global prevalence of chronic ocular conditions such as Dry Eye Disease (DED), particularly among an aging demographic and individuals with extended digital screen exposure. Furthermore, the rising number of ophthalmic surgeries, including cataract and refractive procedures, necessitates the use of preservative-free formulations in post-operative care to minimize irritation and support healing. The inherent sterility and reduced risk of adverse reactions offered by these products are paramount in clinical settings.
Preservative-Free Eye Drops Company Market Share
Macro tailwinds such as advancements in aseptic manufacturing technologies and innovative multi-dose dispensing systems are enhancing product shelf-life and user convenience, thereby expanding market accessibility. Regulatory bodies increasingly emphasize product safety and patient comfort, indirectly favoring the adoption of preservative-free alternatives. The expanding network of online pharmacies and specialized ophthalmology clinics also plays a crucial role in broadening product reach, supporting growth in the Ophthalmic Drugs Market.
Looking forward, the Preservative-Free Eye Drops Market is poised for sustained innovation, with research and development efforts focusing on novel active ingredients compatible with preservative-free systems, alongside enhanced delivery mechanisms. The growing consumer awareness of potential sensitivities to chemical additives positions preservative-free options as a preferred choice, consolidating their niche within the broader Specialty Pharmaceutical Market. This market outlook signals a continued shift towards safer, more patient-centric ophthalmic solutions, ensuring a dynamic growth landscape over the next decade.
Single-Dose Formulations Dominating the Preservative-Free Eye Drops Market
Within the Preservative-Free Eye Drops Market, the Single-Dose Eye Drops segment currently holds the dominant revenue share, attributable to its inherent sterility and precise dosing capabilities. These formulations are typically packaged in individual, disposable vials, eliminating the need for chemical preservatives and significantly reducing the risk of contamination once opened. This characteristic makes them particularly indispensable in critical applications such as post-operative ophthalmic care, where ocular surface integrity is compromised, and any potential irritants or contaminants must be avoided. Furthermore, patients with severe or chronic Dry Eye Disease, ocular allergies, or those exhibiting sensitivity to common preservatives often find Single-Dose Eye Drops Market products to be the most comfortable and safest option for long-term use.
The dominance of this segment is also bolstered by clinical recommendations. Ophthalmologists frequently prescribe single-dose units to ensure maximum hygiene and prevent the cumulative exposure to preservatives that can lead to ocular surface damage over time. Major players such as Alcon, AbbVie (Allergan), and Thea Pharma have extensive portfolios in this area, continuously innovating in packaging materials and dispensing methods to enhance user experience and maintain product integrity. The stringent manufacturing processes, often involving blow-fill-seal (BFS) technology, ensure aseptic production, albeit at a higher cost compared to preserved alternatives.
While the Multi-Dose Eye Drops Market for preservative-free solutions is also growing, driven by innovations in specialized dispensing systems that prevent bacterial ingress (e.g., OSD systems), single-dose remains the gold standard for many clinical scenarios. The market share of single-dose products is expected to continue its upward trajectory, particularly as awareness of preservative-induced ocular surface toxicity increases among both healthcare professionals and the general public. This heightened awareness directly translates into a strong preference for unit-dose packaging, solidifying its leading position. The Dry Eye Disease Treatment Market is a primary beneficiary of this trend, as chronic conditions often require sustained, safe medication regimens. The ease of portability and reduced risk of cross-contamination also makes single-dose units attractive for patients managing multiple ocular conditions or using various drops throughout the day. The focus on patient safety and efficacy continues to underpin the growth and dominance of the single-dose segment in the Preservative-Free Eye Drops Market.
Escalating Ocular Surface Disease Prevalence Driving the Preservative-Free Eye Drops Market
The Preservative-Free Eye Drops Market is experiencing significant impetus from several critical drivers, predominantly the escalating prevalence of ocular surface diseases and increased awareness of ocular sensitivities. A primary driver is the widespread and growing incidence of Dry Eye Disease (DED). Studies indicate DED affects an estimated 5-30% of the global adult population, with rates even higher in specific demographics. For instance, in some regions, DED prevalence can reach up to 33% among individuals aged 50 and older. This substantial patient pool often requires chronic, frequent eye drop application, making preservative-free formulations a necessity to avoid further ocular irritation or damage. The prolonged use of traditional preserved drops containing agents like Benzalkonium Chloride (BAC) can exacerbate DED symptoms, a factor increasingly recognized by both clinicians and patients, thereby channeling demand into the Dry Eye Disease Treatment Market for preservative-free options.
Another significant driver is the rising number of ophthalmic surgical procedures globally. Procedures such as cataract surgery, glaucoma surgery, and refractive surgeries (e.g., LASIK) often necessitate a strict post-operative regimen of topical medications. To minimize irritation, promote healing, and reduce the risk of complications, ophthalmologists overwhelmingly recommend preservative-free eye drops during the critical recovery phase. The global volume of cataract surgeries, for example, is consistently increasing year-on-year, providing a steady demand for specialized post-operative care products. This trend also positively impacts the Ophthalmology Devices Market as related instruments and consumables are needed for these procedures.
Furthermore, growing consumer and clinician awareness regarding the potential adverse effects of preservatives on the ocular surface is a potent driver. Educational campaigns and clinical research highlighting preservative-induced ocular surface toxicity (PIOS) are increasingly influencing prescribing patterns and patient purchasing decisions. Patients using contact lenses, another expanding demographic, also show a strong preference for preservative-free drops to prevent interactions with lens materials and minimize discomfort. The aging global population is also a macro-demographic driver, as older individuals are more susceptible to a range of ocular conditions and are often more sensitive to chemical additives, naturally gravitating towards products available in the Over-the-Counter Pharmaceutical Market that offer preservative-free options.
Competitive Ecosystem of Preservative-Free Eye Drops Market
Within the Preservative-Free Eye Drops Market, a diverse array of pharmaceutical and eye care companies are vying for market share, driven by product innovation and strategic expansion:
- Alcon: A global leader in eye care, Alcon offers a broad portfolio of vision care and surgical products, with a strong presence in the preservative-free segment through various lubricating and therapeutic drops designed for sensitive eyes and post-operative care.
- Bausch + Lomb: As a prominent global eye health organization, Bausch + Lomb focuses on delivering a comprehensive range of products, including vision care, pharmaceuticals, and surgical devices, with significant offerings in preservative-free ophthalmic solutions targeting dry eye and other conditions.
- Johnson & Johnson Vision: Dedicated to eye health, this segment of Johnson & Johnson provides a wide array of products, from contact lenses to surgical solutions, contributing to the preservative-free market with innovative formulations addressing various ocular needs.
- AbbVie (Allergan): With a robust ophthalmology pipeline and established products, Allergan, now part of AbbVie, is a key player, particularly recognized for its advanced treatments for dry eye disease and glaucoma, often available in preservative-free options.
- Santen Pharmaceutical: A Japan-based specialized pharmaceutical company, Santen focuses exclusively on ophthalmology, developing and commercializing prescription and over-the-counter eye drops, including several preservative-free varieties.
- Thea Pharma: An independent European pharmaceutical group, Thea Pharma has a strong specialization in ophthalmology, offering a comprehensive range of products including a significant line of preservative-free eye care solutions.
- URSAPHARM Arzneimittel GmbH: A German pharmaceutical company, URSAPHARM is well-known for its HYLO® range of preservative-free eye drops, which are widely recognized for their efficacy and innovative dispensing systems.
- Sun Pharmaceutical Industries: As India's largest pharmaceutical company, Sun Pharma has a growing presence in the global ophthalmology sector, offering a diverse product portfolio that includes preservative-free formulations.
- Rohto Pharmaceutical: A Japanese multinational pharmaceutical company, Rohto is a major producer of consumer health products, including popular brands of eye drops, with an increasing focus on preservative-free options.
- Oasis Medical: Specializing in surgical and dry eye products, Oasis Medical provides a range of innovative solutions, including preservative-free drops designed for comfort and therapeutic efficacy.
- Sentiss Pharma: An emerging Indian pharmaceutical company, Sentiss Pharma has a dedicated focus on niche therapeutic areas like ophthalmology, developing and marketing a variety of eye care products, including preservative-free options.
- Novartis: A global pharmaceutical giant, Novartis operates a significant ophthalmology division, contributing to the market with advanced therapies and formulations, often leveraging preservative-free technologies.
- Prestige Consumer Healthcare: Focusing on over-the-counter healthcare products, Prestige Consumer Healthcare has expanded its presence in the eye care category, offering accessible preservative-free solutions to a broader consumer base.
Recent Developments & Milestones in Preservative-Free Eye Drops Market
- June 2023: Introduction of advanced multi-dose preservative-free systems by several manufacturers, addressing patient convenience while rigorously maintaining sterility through innovative filter mechanisms and one-way valves. These innovations are crucial for the
Multi-Dose Eye Drops Market. - March 2024: Clinical trials concluded for novel long-acting, preservative-free formulations designed for chronic dry eye management, demonstrating superior patient compliance and sustained therapeutic effects over traditional options.
- November 2023: Regulatory approvals granted in key European and North American markets for new lines of preservative-free anti-allergy eye drops, significantly expanding the therapeutic applications beyond dry eye and post-operative care.
- August 2022: Strategic partnerships forged between a leading global pharmaceutical company and a specialized packaging innovator, aimed at developing next-generation aseptic dispensing technologies for ophthalmic solutions.
- January 2024: Major players in the Preservative-Free Eye Drops Market announced significant expansions of their manufacturing capacities, particularly for single-dose vial production, to meet the surging global demand.
- September 2023: Launch of direct-to-consumer online platforms by several eye care brands, enhancing the accessibility of over-the-counter preservative-free eye drops and offering detailed educational resources to consumers.
- April 2023: Publication of new clinical guidelines by ophthalmological societies emphasizing the benefits of preservative-free formulations for patients with chronic ocular surface diseases and those undergoing eye surgery, boosting clinical adoption.
- July 2022: Investment in R&D for novel active pharmaceutical ingredients (APIs) specifically compatible with preservative-free formulations, aiming to diversify treatment options within the
Ophthalmic Drugs Market.
Regional Market Breakdown for Preservative-Free Eye Drops Market
The Preservative-Free Eye Drops Market demonstrates varied dynamics across key geographical regions, influenced by healthcare infrastructure, disease prevalence, regulatory frameworks, and consumer awareness. North America, encompassing the United States and Canada, currently accounts for the largest revenue share, estimated at approximately 38% of the global market. This dominance is driven by a high prevalence of dry eye disease, a sophisticated healthcare system, significant disposable income, and strong awareness among both patients and practitioners regarding the benefits of preservative-free formulations. The region exhibits a steady growth rate, propelled by advanced product launches and an aging population.
Europe holds the second-largest share, contributing around 30% to the global market. Countries like Germany, France, and the UK are frontrunners, with stringent regulatory standards favoring safer ophthalmic products and high adoption rates of preservative-free options. The robust Specialty Pharmaceutical Market in Europe, coupled with increased healthcare spending and a focus on chronic disease management, underpins its sustained growth.
Asia Pacific is identified as the fastest-growing region in the Preservative-Free Eye Drops Market, projected to register a CAGR exceeding 6.0%. This rapid expansion is primarily attributed to its vast and growing population, improving healthcare access, rising disposable incomes, and increasing awareness of ocular health issues. Countries such as China, India, and Japan are witnessing a surge in dry eye cases due to prolonged digital device use and environmental factors. Furthermore, the expansion of local manufacturing capabilities and the entry of international players are fueling growth in this dynamic market, impacting the broader Pharmaceutical Excipients Market and Ophthalmology Devices Market indirectly.
The Middle East & Africa and South America regions represent emerging markets with considerable growth potential. While their current market shares are smaller, increasing healthcare investments, improving economic conditions, and rising prevalence of ocular conditions are expected to drive demand for preservative-free eye drops. Regulatory advancements and greater access to modern ophthalmic treatments will be crucial for their future expansion.
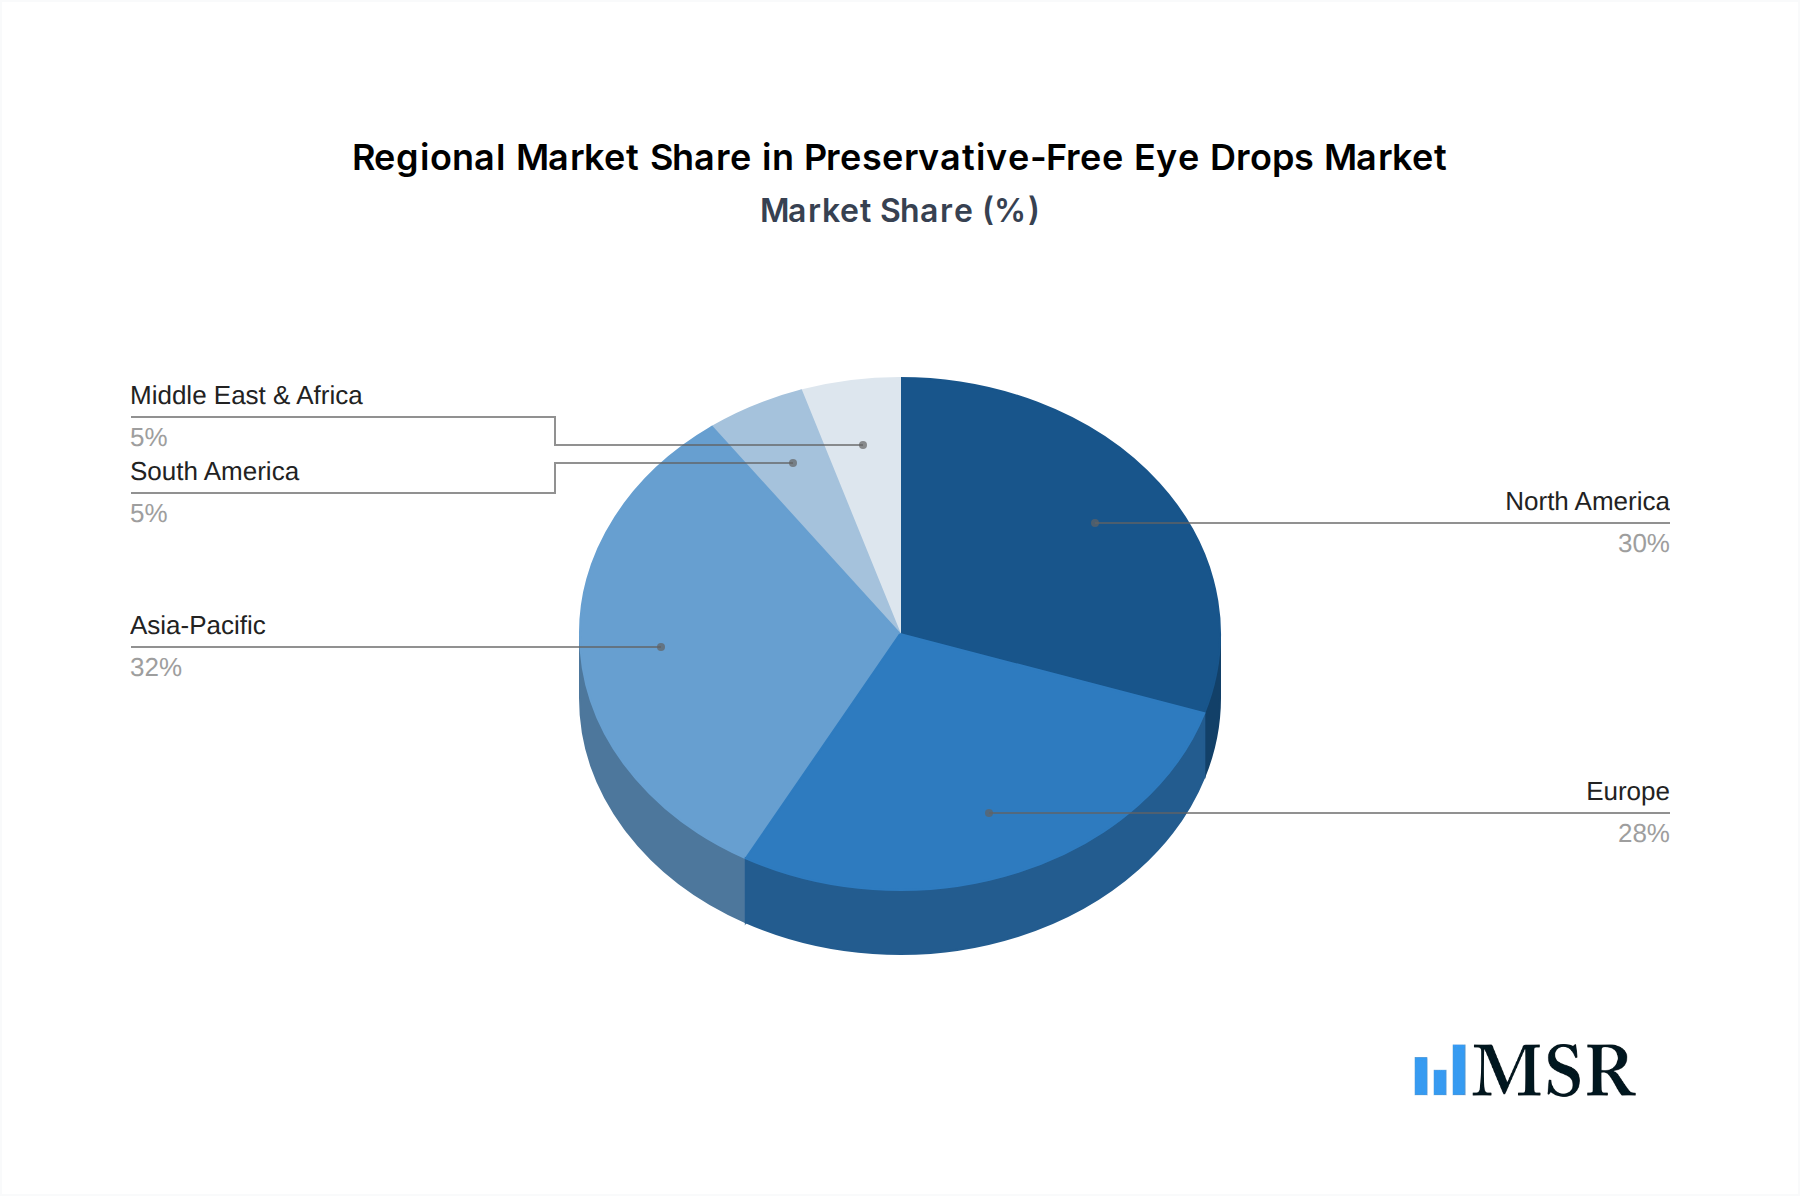
Preservative-Free Eye Drops Regional Market Share
Pricing Dynamics & Margin Pressure in Preservative-Free Eye Drops Market
The pricing dynamics within the Preservative-Free Eye Drops Market are distinct, largely reflecting the higher manufacturing complexities and specialized packaging requirements compared to their preserved counterparts. Average selling prices (ASPs) for preservative-free formulations are generally 15-30% higher than traditional preserved eye drops. This premium pricing is justified by the advanced aseptic production processes, such as blow-fill-seal (BFS) technology for single-dose units or sophisticated multi-dose systems that incorporate filters or one-way valves to maintain sterility without chemical preservatives. These technologies incur higher capital expenditure and operational costs.
Margin structures across the value chain typically reflect these elevated production costs. Manufacturers experience higher costs of goods sold (COGS) due to specialized raw materials, including pharmaceutical-grade polymers for packaging and ultra-pure active pharmaceutical ingredients (APIs) suitable for preservative-free formulations. Despite this, the premium pricing allows for healthy gross margins, which are essential to support ongoing research and development into new preservative-free drug delivery systems and therapeutic agents. Distributors and retailers also capture a margin, though competitive intensity in the Over-the-Counter Pharmaceutical Market segment can exert some pressure.
Key cost levers primarily involve economies of scale in manufacturing and continuous process optimization. As the market matures and production volumes increase, some cost efficiencies can be achieved. However, the inherent requirements for sterility and specialized packaging limit the extent of cost reduction. Competitive intensity has been growing, especially with the entry of generic preservative-free options, which puts some downward pressure on ASPs in certain therapeutic areas. However, for highly specialized or patented formulations, pricing power remains relatively strong due to clinical differentiation and patient preference for trusted brands. Commodity cycles in basic Pharmaceutical Excipients Market ingredients have a limited direct impact, but fluctuations in specialized polymer prices or energy costs for manufacturing can subtly affect overall cost structures.
Supply Chain & Raw Material Dynamics for Preservative-Free Eye Drops Market
The supply chain for the Preservative-Free Eye Drops Market is characterized by a high degree of specialization and stringent quality control, driven by the need to maintain sterility and product integrity. Upstream dependencies primarily involve suppliers of high-purity active pharmaceutical ingredients (APIs), sterile water for injection (WFI), and advanced packaging components. The absence of traditional preservatives necessitates that every component interacting with the final product meets exceptionally high aseptic standards.
Key raw materials include APIs tailored for ophthalmic use, which must be soluble and stable in an unpreserved aqueous environment. Specialized polymers such as medical-grade low-density polyethylene (LDPE) or polypropylene are crucial for the manufacturing of single-dose vials, often produced via blow-fill-seal (BFS) technology. For multi-dose preservative-free systems, complex polymer blends are used to create sophisticated dispensing mechanisms that maintain sterility through filters or one-way valves. The Pharmaceutical Excipients Market provides a range of viscosity-modifying agents, tonicity adjusters, and pH buffers, all of which must be of the highest purity and free from any microbial contamination or impurities that could compromise the sterile formulation.
Sourcing risks are considerable within this market. Geopolitical instabilities, trade restrictions, or disruptions to specialized chemical and polymer manufacturing facilities can impact the availability and cost of critical inputs. Stringent regulatory hurdles for qualifying and auditing sterile component suppliers add complexity and can limit the supplier base. Price volatility of key inputs, particularly APIs and specialized polymers (which can be linked to petrochemical prices), can affect manufacturing costs, although overall, the stability of these prices is generally higher than for bulk commodities.
Historically, the global supply chain has faced disruptions, as seen during the COVID-19 pandemic, which impacted transportation, raw material availability, and manufacturing capacity. Such disruptions can lead to significant production delays and increased costs, forcing manufacturers to invest in diversified sourcing strategies and maintain buffer inventories. The need for specialized sterile manufacturing facilities also means that production cannot be easily shifted between sites, making the supply chain less flexible. Companies in the Ophthalmic Drugs Market are increasingly focused on building resilient supply chains, qualifying multiple suppliers for critical components, and investing in localized production capabilities to mitigate future risks and ensure continuous product availability.
Preservative-Free Eye Drops Segmentation
-
1. Type
- 1.1. Single-Dose Eye Drops
- 1.2. Multi-Dose Eye Drops
-
2. Mode of Sale
- 2.1. Prescription (Rx)
- 2.2. Over-the-Counter (OTC)
-
3. Age Group
- 3.1. Pediatric
- 3.2. Adult
- 3.3. Geriatric
-
4. Application
- 4.1. Dry Eye Disease
- 4.2. Eye Allergy/Infection
- 4.3. Glaucoma
- 4.4. Retinal Disorders
- 4.5. Post Operative Eye Care
- 4.6. Others
-
5. Distribution Channel
- 5.1. Hospital Pharmacies
- 5.2. Retail Pharmacies
- 5.3. Online Pharmacies
-
6. End User
- 6.1. Hospitals
- 6.2. Ophthalmology Clinics
- 6.3. Ambulatory Surgical Centers (ASCs)
- 6.4. Home Care Settings
- 6.5. Others
Preservative-Free Eye Drops Segmentation By Geography
-
1. North America
- 1.1. United States
- 1.2. Canada
- 1.3. Mexico
-
2. South America
- 2.1. Brazil
- 2.2. Argentina
- 2.3. Rest of South America
-
3. Europe
- 3.1. United Kingdom
- 3.2. Germany
- 3.3. France
- 3.4. Italy
- 3.5. Spain
- 3.6. Russia
- 3.7. Benelux
- 3.8. Nordics
- 3.9. Rest of Europe
-
4. Middle East & Africa
- 4.1. Turkey
- 4.2. Israel
- 4.3. GCC
- 4.4. North Africa
- 4.5. South Africa
- 4.6. Rest of Middle East & Africa
-
5. Asia Pacific
- 5.1. China
- 5.2. India
- 5.3. Japan
- 5.4. South Korea
- 5.5. ASEAN
- 5.6. Oceania
- 5.7. Rest of Asia Pacific
Preservative-Free Eye Drops Regional Market Share
Geographic Coverage of Preservative-Free Eye Drops
Preservative-Free Eye Drops REPORT HIGHLIGHTS
| Aspects | Details |
|---|---|
| Study Period | 2020-2034 |
| Base Year | 2025 |
| Estimated Year | 2026 |
| Forecast Period | 2026-2034 |
| Historical Period | 2020-2025 |
| Growth Rate | CAGR of 4.7% from 2020-2034 |
| Segmentation |
|
Table of Contents
- 1. Introduction
- 1.1. Research Scope
- 1.2. Market Segmentation
- 1.3. Research Objective
- 1.4. Definitions and Assumptions
- 2. Executive Summary
- 2.1. Market Snapshot
- 3. Market Dynamics
- 3.1. Market Drivers
- 3.2. Market Restrains
- 3.3. Market Trends
- 3.4. Market Opportunities
- 4. Market Factor Analysis
- 4.1. Porters Five Forces
- 4.1.1. Bargaining Power of Suppliers
- 4.1.2. Bargaining Power of Buyers
- 4.1.3. Threat of New Entrants
- 4.1.4. Threat of Substitutes
- 4.1.5. Competitive Rivalry
- 4.2. PESTEL analysis
- 4.3. BCG Analysis
- 4.3.1. Stars (High Growth, High Market Share)
- 4.3.2. Cash Cows (Low Growth, High Market Share)
- 4.3.3. Question Mark (High Growth, Low Market Share)
- 4.3.4. Dogs (Low Growth, Low Market Share)
- 4.4. Ansoff Matrix Analysis
- 4.5. Supply Chain Analysis
- 4.6. Regulatory Landscape
- 4.7. Current Market Potential and Opportunity Assessment (TAM–SAM–SOM Framework)
- 4.8. MSR Analyst Note
- 4.1. Porters Five Forces
- 5. Market Analysis, Insights and Forecast 2021-2033
- 5.1. Market Analysis, Insights and Forecast - by Type
- 5.1.1. Single-Dose Eye Drops
- 5.1.2. Multi-Dose Eye Drops
- 5.2. Market Analysis, Insights and Forecast - by Mode of Sale
- 5.2.1. Prescription (Rx)
- 5.2.2. Over-the-Counter (OTC)
- 5.3. Market Analysis, Insights and Forecast - by Age Group
- 5.3.1. Pediatric
- 5.3.2. Adult
- 5.3.3. Geriatric
- 5.4. Market Analysis, Insights and Forecast - by Application
- 5.4.1. Dry Eye Disease
- 5.4.2. Eye Allergy/Infection
- 5.4.3. Glaucoma
- 5.4.4. Retinal Disorders
- 5.4.5. Post Operative Eye Care
- 5.4.6. Others
- 5.5. Market Analysis, Insights and Forecast - by Distribution Channel
- 5.5.1. Hospital Pharmacies
- 5.5.2. Retail Pharmacies
- 5.5.3. Online Pharmacies
- 5.6. Market Analysis, Insights and Forecast - by End User
- 5.6.1. Hospitals
- 5.6.2. Ophthalmology Clinics
- 5.6.3. Ambulatory Surgical Centers (ASCs)
- 5.6.4. Home Care Settings
- 5.6.5. Others
- 5.7. Market Analysis, Insights and Forecast - by Region
- 5.7.1. North America
- 5.7.2. South America
- 5.7.3. Europe
- 5.7.4. Middle East & Africa
- 5.7.5. Asia Pacific
- 5.1. Market Analysis, Insights and Forecast - by Type
- 6. Global Preservative-Free Eye Drops Analysis, Insights and Forecast, 2021-2033
- 6.1. Market Analysis, Insights and Forecast - by Type
- 6.1.1. Single-Dose Eye Drops
- 6.1.2. Multi-Dose Eye Drops
- 6.2. Market Analysis, Insights and Forecast - by Mode of Sale
- 6.2.1. Prescription (Rx)
- 6.2.2. Over-the-Counter (OTC)
- 6.3. Market Analysis, Insights and Forecast - by Age Group
- 6.3.1. Pediatric
- 6.3.2. Adult
- 6.3.3. Geriatric
- 6.4. Market Analysis, Insights and Forecast - by Application
- 6.4.1. Dry Eye Disease
- 6.4.2. Eye Allergy/Infection
- 6.4.3. Glaucoma
- 6.4.4. Retinal Disorders
- 6.4.5. Post Operative Eye Care
- 6.4.6. Others
- 6.5. Market Analysis, Insights and Forecast - by Distribution Channel
- 6.5.1. Hospital Pharmacies
- 6.5.2. Retail Pharmacies
- 6.5.3. Online Pharmacies
- 6.6. Market Analysis, Insights and Forecast - by End User
- 6.6.1. Hospitals
- 6.6.2. Ophthalmology Clinics
- 6.6.3. Ambulatory Surgical Centers (ASCs)
- 6.6.4. Home Care Settings
- 6.6.5. Others
- 6.1. Market Analysis, Insights and Forecast - by Type
- 7. North America Preservative-Free Eye Drops Analysis, Insights and Forecast, 2020-2032
- 7.1. Market Analysis, Insights and Forecast - by Type
- 7.1.1. Single-Dose Eye Drops
- 7.1.2. Multi-Dose Eye Drops
- 7.2. Market Analysis, Insights and Forecast - by Mode of Sale
- 7.2.1. Prescription (Rx)
- 7.2.2. Over-the-Counter (OTC)
- 7.3. Market Analysis, Insights and Forecast - by Age Group
- 7.3.1. Pediatric
- 7.3.2. Adult
- 7.3.3. Geriatric
- 7.4. Market Analysis, Insights and Forecast - by Application
- 7.4.1. Dry Eye Disease
- 7.4.2. Eye Allergy/Infection
- 7.4.3. Glaucoma
- 7.4.4. Retinal Disorders
- 7.4.5. Post Operative Eye Care
- 7.4.6. Others
- 7.5. Market Analysis, Insights and Forecast - by Distribution Channel
- 7.5.1. Hospital Pharmacies
- 7.5.2. Retail Pharmacies
- 7.5.3. Online Pharmacies
- 7.6. Market Analysis, Insights and Forecast - by End User
- 7.6.1. Hospitals
- 7.6.2. Ophthalmology Clinics
- 7.6.3. Ambulatory Surgical Centers (ASCs)
- 7.6.4. Home Care Settings
- 7.6.5. Others
- 7.1. Market Analysis, Insights and Forecast - by Type
- 8. South America Preservative-Free Eye Drops Analysis, Insights and Forecast, 2020-2032
- 8.1. Market Analysis, Insights and Forecast - by Type
- 8.1.1. Single-Dose Eye Drops
- 8.1.2. Multi-Dose Eye Drops
- 8.2. Market Analysis, Insights and Forecast - by Mode of Sale
- 8.2.1. Prescription (Rx)
- 8.2.2. Over-the-Counter (OTC)
- 8.3. Market Analysis, Insights and Forecast - by Age Group
- 8.3.1. Pediatric
- 8.3.2. Adult
- 8.3.3. Geriatric
- 8.4. Market Analysis, Insights and Forecast - by Application
- 8.4.1. Dry Eye Disease
- 8.4.2. Eye Allergy/Infection
- 8.4.3. Glaucoma
- 8.4.4. Retinal Disorders
- 8.4.5. Post Operative Eye Care
- 8.4.6. Others
- 8.5. Market Analysis, Insights and Forecast - by Distribution Channel
- 8.5.1. Hospital Pharmacies
- 8.5.2. Retail Pharmacies
- 8.5.3. Online Pharmacies
- 8.6. Market Analysis, Insights and Forecast - by End User
- 8.6.1. Hospitals
- 8.6.2. Ophthalmology Clinics
- 8.6.3. Ambulatory Surgical Centers (ASCs)
- 8.6.4. Home Care Settings
- 8.6.5. Others
- 8.1. Market Analysis, Insights and Forecast - by Type
- 9. Europe Preservative-Free Eye Drops Analysis, Insights and Forecast, 2020-2032
- 9.1. Market Analysis, Insights and Forecast - by Type
- 9.1.1. Single-Dose Eye Drops
- 9.1.2. Multi-Dose Eye Drops
- 9.2. Market Analysis, Insights and Forecast - by Mode of Sale
- 9.2.1. Prescription (Rx)
- 9.2.2. Over-the-Counter (OTC)
- 9.3. Market Analysis, Insights and Forecast - by Age Group
- 9.3.1. Pediatric
- 9.3.2. Adult
- 9.3.3. Geriatric
- 9.4. Market Analysis, Insights and Forecast - by Application
- 9.4.1. Dry Eye Disease
- 9.4.2. Eye Allergy/Infection
- 9.4.3. Glaucoma
- 9.4.4. Retinal Disorders
- 9.4.5. Post Operative Eye Care
- 9.4.6. Others
- 9.5. Market Analysis, Insights and Forecast - by Distribution Channel
- 9.5.1. Hospital Pharmacies
- 9.5.2. Retail Pharmacies
- 9.5.3. Online Pharmacies
- 9.6. Market Analysis, Insights and Forecast - by End User
- 9.6.1. Hospitals
- 9.6.2. Ophthalmology Clinics
- 9.6.3. Ambulatory Surgical Centers (ASCs)
- 9.6.4. Home Care Settings
- 9.6.5. Others
- 9.1. Market Analysis, Insights and Forecast - by Type
- 10. Middle East & Africa Preservative-Free Eye Drops Analysis, Insights and Forecast, 2020-2032
- 10.1. Market Analysis, Insights and Forecast - by Type
- 10.1.1. Single-Dose Eye Drops
- 10.1.2. Multi-Dose Eye Drops
- 10.2. Market Analysis, Insights and Forecast - by Mode of Sale
- 10.2.1. Prescription (Rx)
- 10.2.2. Over-the-Counter (OTC)
- 10.3. Market Analysis, Insights and Forecast - by Age Group
- 10.3.1. Pediatric
- 10.3.2. Adult
- 10.3.3. Geriatric
- 10.4. Market Analysis, Insights and Forecast - by Application
- 10.4.1. Dry Eye Disease
- 10.4.2. Eye Allergy/Infection
- 10.4.3. Glaucoma
- 10.4.4. Retinal Disorders
- 10.4.5. Post Operative Eye Care
- 10.4.6. Others
- 10.5. Market Analysis, Insights and Forecast - by Distribution Channel
- 10.5.1. Hospital Pharmacies
- 10.5.2. Retail Pharmacies
- 10.5.3. Online Pharmacies
- 10.6. Market Analysis, Insights and Forecast - by End User
- 10.6.1. Hospitals
- 10.6.2. Ophthalmology Clinics
- 10.6.3. Ambulatory Surgical Centers (ASCs)
- 10.6.4. Home Care Settings
- 10.6.5. Others
- 10.1. Market Analysis, Insights and Forecast - by Type
- 11. Asia Pacific Preservative-Free Eye Drops Analysis, Insights and Forecast, 2020-2032
- 11.1. Market Analysis, Insights and Forecast - by Type
- 11.1.1. Single-Dose Eye Drops
- 11.1.2. Multi-Dose Eye Drops
- 11.2. Market Analysis, Insights and Forecast - by Mode of Sale
- 11.2.1. Prescription (Rx)
- 11.2.2. Over-the-Counter (OTC)
- 11.3. Market Analysis, Insights and Forecast - by Age Group
- 11.3.1. Pediatric
- 11.3.2. Adult
- 11.3.3. Geriatric
- 11.4. Market Analysis, Insights and Forecast - by Application
- 11.4.1. Dry Eye Disease
- 11.4.2. Eye Allergy/Infection
- 11.4.3. Glaucoma
- 11.4.4. Retinal Disorders
- 11.4.5. Post Operative Eye Care
- 11.4.6. Others
- 11.5. Market Analysis, Insights and Forecast - by Distribution Channel
- 11.5.1. Hospital Pharmacies
- 11.5.2. Retail Pharmacies
- 11.5.3. Online Pharmacies
- 11.6. Market Analysis, Insights and Forecast - by End User
- 11.6.1. Hospitals
- 11.6.2. Ophthalmology Clinics
- 11.6.3. Ambulatory Surgical Centers (ASCs)
- 11.6.4. Home Care Settings
- 11.6.5. Others
- 11.1. Market Analysis, Insights and Forecast - by Type
- 12. Competitive Analysis
- 12.1. Company Profiles
- 12.1.1 Alcon
- 12.1.1.1. Company Overview
- 12.1.1.2. Products
- 12.1.1.3. Company Financials
- 12.1.1.4. SWOT Analysis
- 12.1.2 Bausch + Lomb
- 12.1.2.1. Company Overview
- 12.1.2.2. Products
- 12.1.2.3. Company Financials
- 12.1.2.4. SWOT Analysis
- 12.1.3 Johnson & Johnson Vision
- 12.1.3.1. Company Overview
- 12.1.3.2. Products
- 12.1.3.3. Company Financials
- 12.1.3.4. SWOT Analysis
- 12.1.4 AbbVie (Allergan)
- 12.1.4.1. Company Overview
- 12.1.4.2. Products
- 12.1.4.3. Company Financials
- 12.1.4.4. SWOT Analysis
- 12.1.5 Santen Pharmaceutical
- 12.1.5.1. Company Overview
- 12.1.5.2. Products
- 12.1.5.3. Company Financials
- 12.1.5.4. SWOT Analysis
- 12.1.6 Thea Pharma
- 12.1.6.1. Company Overview
- 12.1.6.2. Products
- 12.1.6.3. Company Financials
- 12.1.6.4. SWOT Analysis
- 12.1.7 URSAPHARM Arzneimittel GmbH
- 12.1.7.1. Company Overview
- 12.1.7.2. Products
- 12.1.7.3. Company Financials
- 12.1.7.4. SWOT Analysis
- 12.1.8 Sun Pharmaceutical Industries
- 12.1.8.1. Company Overview
- 12.1.8.2. Products
- 12.1.8.3. Company Financials
- 12.1.8.4. SWOT Analysis
- 12.1.9 Rohto Pharmaceutical
- 12.1.9.1. Company Overview
- 12.1.9.2. Products
- 12.1.9.3. Company Financials
- 12.1.9.4. SWOT Analysis
- 12.1.10 Oasis Medical
- 12.1.10.1. Company Overview
- 12.1.10.2. Products
- 12.1.10.3. Company Financials
- 12.1.10.4. SWOT Analysis
- 12.1.11 Sentiss Pharma
- 12.1.11.1. Company Overview
- 12.1.11.2. Products
- 12.1.11.3. Company Financials
- 12.1.11.4. SWOT Analysis
- 12.1.12 Novartis
- 12.1.12.1. Company Overview
- 12.1.12.2. Products
- 12.1.12.3. Company Financials
- 12.1.12.4. SWOT Analysis
- 12.1.13 Prestige Consumer Healthcare
- 12.1.13.1. Company Overview
- 12.1.13.2. Products
- 12.1.13.3. Company Financials
- 12.1.13.4. SWOT Analysis
- 12.1.14 Others
- 12.1.14.1. Company Overview
- 12.1.14.2. Products
- 12.1.14.3. Company Financials
- 12.1.14.4. SWOT Analysis
- 12.1.1 Alcon
- 12.2. Market Entropy
- 12.2.1 Company's Key Areas Served
- 12.2.2 Recent Developments
- 12.3. Company Market Share Analysis 2025
- 12.3.1 Top 5 Companies Market Share Analysis
- 12.3.2 Top 3 Companies Market Share Analysis
- 12.4. List of Potential Customers
- 13. Research Methodology
List of Figures
- Figure 1: Global Preservative-Free Eye Drops Revenue Breakdown (billion, %) by Region 2025 & 2033
- Figure 2: Global Preservative-Free Eye Drops Volume Breakdown (K, %) by Region 2025 & 2033
- Figure 3: North America Preservative-Free Eye Drops Revenue (billion), by Type 2025 & 2033
- Figure 4: North America Preservative-Free Eye Drops Volume (K), by Type 2025 & 2033
- Figure 5: North America Preservative-Free Eye Drops Revenue Share (%), by Type 2025 & 2033
- Figure 6: North America Preservative-Free Eye Drops Volume Share (%), by Type 2025 & 2033
- Figure 7: North America Preservative-Free Eye Drops Revenue (billion), by Mode of Sale 2025 & 2033
- Figure 8: North America Preservative-Free Eye Drops Volume (K), by Mode of Sale 2025 & 2033
- Figure 9: North America Preservative-Free Eye Drops Revenue Share (%), by Mode of Sale 2025 & 2033
- Figure 10: North America Preservative-Free Eye Drops Volume Share (%), by Mode of Sale 2025 & 2033
- Figure 11: North America Preservative-Free Eye Drops Revenue (billion), by Age Group 2025 & 2033
- Figure 12: North America Preservative-Free Eye Drops Volume (K), by Age Group 2025 & 2033
- Figure 13: North America Preservative-Free Eye Drops Revenue Share (%), by Age Group 2025 & 2033
- Figure 14: North America Preservative-Free Eye Drops Volume Share (%), by Age Group 2025 & 2033
- Figure 15: North America Preservative-Free Eye Drops Revenue (billion), by Application 2025 & 2033
- Figure 16: North America Preservative-Free Eye Drops Volume (K), by Application 2025 & 2033
- Figure 17: North America Preservative-Free Eye Drops Revenue Share (%), by Application 2025 & 2033
- Figure 18: North America Preservative-Free Eye Drops Volume Share (%), by Application 2025 & 2033
- Figure 19: North America Preservative-Free Eye Drops Revenue (billion), by Distribution Channel 2025 & 2033
- Figure 20: North America Preservative-Free Eye Drops Volume (K), by Distribution Channel 2025 & 2033
- Figure 21: North America Preservative-Free Eye Drops Revenue Share (%), by Distribution Channel 2025 & 2033
- Figure 22: North America Preservative-Free Eye Drops Volume Share (%), by Distribution Channel 2025 & 2033
- Figure 23: North America Preservative-Free Eye Drops Revenue (billion), by End User 2025 & 2033
- Figure 24: North America Preservative-Free Eye Drops Volume (K), by End User 2025 & 2033
- Figure 25: North America Preservative-Free Eye Drops Revenue Share (%), by End User 2025 & 2033
- Figure 26: North America Preservative-Free Eye Drops Volume Share (%), by End User 2025 & 2033
- Figure 27: North America Preservative-Free Eye Drops Revenue (billion), by Country 2025 & 2033
- Figure 28: North America Preservative-Free Eye Drops Volume (K), by Country 2025 & 2033
- Figure 29: North America Preservative-Free Eye Drops Revenue Share (%), by Country 2025 & 2033
- Figure 30: North America Preservative-Free Eye Drops Volume Share (%), by Country 2025 & 2033
- Figure 31: South America Preservative-Free Eye Drops Revenue (billion), by Type 2025 & 2033
- Figure 32: South America Preservative-Free Eye Drops Volume (K), by Type 2025 & 2033
- Figure 33: South America Preservative-Free Eye Drops Revenue Share (%), by Type 2025 & 2033
- Figure 34: South America Preservative-Free Eye Drops Volume Share (%), by Type 2025 & 2033
- Figure 35: South America Preservative-Free Eye Drops Revenue (billion), by Mode of Sale 2025 & 2033
- Figure 36: South America Preservative-Free Eye Drops Volume (K), by Mode of Sale 2025 & 2033
- Figure 37: South America Preservative-Free Eye Drops Revenue Share (%), by Mode of Sale 2025 & 2033
- Figure 38: South America Preservative-Free Eye Drops Volume Share (%), by Mode of Sale 2025 & 2033
- Figure 39: South America Preservative-Free Eye Drops Revenue (billion), by Age Group 2025 & 2033
- Figure 40: South America Preservative-Free Eye Drops Volume (K), by Age Group 2025 & 2033
- Figure 41: South America Preservative-Free Eye Drops Revenue Share (%), by Age Group 2025 & 2033
- Figure 42: South America Preservative-Free Eye Drops Volume Share (%), by Age Group 2025 & 2033
- Figure 43: South America Preservative-Free Eye Drops Revenue (billion), by Application 2025 & 2033
- Figure 44: South America Preservative-Free Eye Drops Volume (K), by Application 2025 & 2033
- Figure 45: South America Preservative-Free Eye Drops Revenue Share (%), by Application 2025 & 2033
- Figure 46: South America Preservative-Free Eye Drops Volume Share (%), by Application 2025 & 2033
- Figure 47: South America Preservative-Free Eye Drops Revenue (billion), by Distribution Channel 2025 & 2033
- Figure 48: South America Preservative-Free Eye Drops Volume (K), by Distribution Channel 2025 & 2033
- Figure 49: South America Preservative-Free Eye Drops Revenue Share (%), by Distribution Channel 2025 & 2033
- Figure 50: South America Preservative-Free Eye Drops Volume Share (%), by Distribution Channel 2025 & 2033
- Figure 51: South America Preservative-Free Eye Drops Revenue (billion), by End User 2025 & 2033
- Figure 52: South America Preservative-Free Eye Drops Volume (K), by End User 2025 & 2033
- Figure 53: South America Preservative-Free Eye Drops Revenue Share (%), by End User 2025 & 2033
- Figure 54: South America Preservative-Free Eye Drops Volume Share (%), by End User 2025 & 2033
- Figure 55: South America Preservative-Free Eye Drops Revenue (billion), by Country 2025 & 2033
- Figure 56: South America Preservative-Free Eye Drops Volume (K), by Country 2025 & 2033
- Figure 57: South America Preservative-Free Eye Drops Revenue Share (%), by Country 2025 & 2033
- Figure 58: South America Preservative-Free Eye Drops Volume Share (%), by Country 2025 & 2033
- Figure 59: Europe Preservative-Free Eye Drops Revenue (billion), by Type 2025 & 2033
- Figure 60: Europe Preservative-Free Eye Drops Volume (K), by Type 2025 & 2033
- Figure 61: Europe Preservative-Free Eye Drops Revenue Share (%), by Type 2025 & 2033
- Figure 62: Europe Preservative-Free Eye Drops Volume Share (%), by Type 2025 & 2033
- Figure 63: Europe Preservative-Free Eye Drops Revenue (billion), by Mode of Sale 2025 & 2033
- Figure 64: Europe Preservative-Free Eye Drops Volume (K), by Mode of Sale 2025 & 2033
- Figure 65: Europe Preservative-Free Eye Drops Revenue Share (%), by Mode of Sale 2025 & 2033
- Figure 66: Europe Preservative-Free Eye Drops Volume Share (%), by Mode of Sale 2025 & 2033
- Figure 67: Europe Preservative-Free Eye Drops Revenue (billion), by Age Group 2025 & 2033
- Figure 68: Europe Preservative-Free Eye Drops Volume (K), by Age Group 2025 & 2033
- Figure 69: Europe Preservative-Free Eye Drops Revenue Share (%), by Age Group 2025 & 2033
- Figure 70: Europe Preservative-Free Eye Drops Volume Share (%), by Age Group 2025 & 2033
- Figure 71: Europe Preservative-Free Eye Drops Revenue (billion), by Application 2025 & 2033
- Figure 72: Europe Preservative-Free Eye Drops Volume (K), by Application 2025 & 2033
- Figure 73: Europe Preservative-Free Eye Drops Revenue Share (%), by Application 2025 & 2033
- Figure 74: Europe Preservative-Free Eye Drops Volume Share (%), by Application 2025 & 2033
- Figure 75: Europe Preservative-Free Eye Drops Revenue (billion), by Distribution Channel 2025 & 2033
- Figure 76: Europe Preservative-Free Eye Drops Volume (K), by Distribution Channel 2025 & 2033
- Figure 77: Europe Preservative-Free Eye Drops Revenue Share (%), by Distribution Channel 2025 & 2033
- Figure 78: Europe Preservative-Free Eye Drops Volume Share (%), by Distribution Channel 2025 & 2033
- Figure 79: Europe Preservative-Free Eye Drops Revenue (billion), by End User 2025 & 2033
- Figure 80: Europe Preservative-Free Eye Drops Volume (K), by End User 2025 & 2033
- Figure 81: Europe Preservative-Free Eye Drops Revenue Share (%), by End User 2025 & 2033
- Figure 82: Europe Preservative-Free Eye Drops Volume Share (%), by End User 2025 & 2033
- Figure 83: Europe Preservative-Free Eye Drops Revenue (billion), by Country 2025 & 2033
- Figure 84: Europe Preservative-Free Eye Drops Volume (K), by Country 2025 & 2033
- Figure 85: Europe Preservative-Free Eye Drops Revenue Share (%), by Country 2025 & 2033
- Figure 86: Europe Preservative-Free Eye Drops Volume Share (%), by Country 2025 & 2033
- Figure 87: Middle East & Africa Preservative-Free Eye Drops Revenue (billion), by Type 2025 & 2033
- Figure 88: Middle East & Africa Preservative-Free Eye Drops Volume (K), by Type 2025 & 2033
- Figure 89: Middle East & Africa Preservative-Free Eye Drops Revenue Share (%), by Type 2025 & 2033
- Figure 90: Middle East & Africa Preservative-Free Eye Drops Volume Share (%), by Type 2025 & 2033
- Figure 91: Middle East & Africa Preservative-Free Eye Drops Revenue (billion), by Mode of Sale 2025 & 2033
- Figure 92: Middle East & Africa Preservative-Free Eye Drops Volume (K), by Mode of Sale 2025 & 2033
- Figure 93: Middle East & Africa Preservative-Free Eye Drops Revenue Share (%), by Mode of Sale 2025 & 2033
- Figure 94: Middle East & Africa Preservative-Free Eye Drops Volume Share (%), by Mode of Sale 2025 & 2033
- Figure 95: Middle East & Africa Preservative-Free Eye Drops Revenue (billion), by Age Group 2025 & 2033
- Figure 96: Middle East & Africa Preservative-Free Eye Drops Volume (K), by Age Group 2025 & 2033
- Figure 97: Middle East & Africa Preservative-Free Eye Drops Revenue Share (%), by Age Group 2025 & 2033
- Figure 98: Middle East & Africa Preservative-Free Eye Drops Volume Share (%), by Age Group 2025 & 2033
- Figure 99: Middle East & Africa Preservative-Free Eye Drops Revenue (billion), by Application 2025 & 2033
- Figure 100: Middle East & Africa Preservative-Free Eye Drops Volume (K), by Application 2025 & 2033
- Figure 101: Middle East & Africa Preservative-Free Eye Drops Revenue Share (%), by Application 2025 & 2033
- Figure 102: Middle East & Africa Preservative-Free Eye Drops Volume Share (%), by Application 2025 & 2033
- Figure 103: Middle East & Africa Preservative-Free Eye Drops Revenue (billion), by Distribution Channel 2025 & 2033
- Figure 104: Middle East & Africa Preservative-Free Eye Drops Volume (K), by Distribution Channel 2025 & 2033
- Figure 105: Middle East & Africa Preservative-Free Eye Drops Revenue Share (%), by Distribution Channel 2025 & 2033
- Figure 106: Middle East & Africa Preservative-Free Eye Drops Volume Share (%), by Distribution Channel 2025 & 2033
- Figure 107: Middle East & Africa Preservative-Free Eye Drops Revenue (billion), by End User 2025 & 2033
- Figure 108: Middle East & Africa Preservative-Free Eye Drops Volume (K), by End User 2025 & 2033
- Figure 109: Middle East & Africa Preservative-Free Eye Drops Revenue Share (%), by End User 2025 & 2033
- Figure 110: Middle East & Africa Preservative-Free Eye Drops Volume Share (%), by End User 2025 & 2033
- Figure 111: Middle East & Africa Preservative-Free Eye Drops Revenue (billion), by Country 2025 & 2033
- Figure 112: Middle East & Africa Preservative-Free Eye Drops Volume (K), by Country 2025 & 2033
- Figure 113: Middle East & Africa Preservative-Free Eye Drops Revenue Share (%), by Country 2025 & 2033
- Figure 114: Middle East & Africa Preservative-Free Eye Drops Volume Share (%), by Country 2025 & 2033
- Figure 115: Asia Pacific Preservative-Free Eye Drops Revenue (billion), by Type 2025 & 2033
- Figure 116: Asia Pacific Preservative-Free Eye Drops Volume (K), by Type 2025 & 2033
- Figure 117: Asia Pacific Preservative-Free Eye Drops Revenue Share (%), by Type 2025 & 2033
- Figure 118: Asia Pacific Preservative-Free Eye Drops Volume Share (%), by Type 2025 & 2033
- Figure 119: Asia Pacific Preservative-Free Eye Drops Revenue (billion), by Mode of Sale 2025 & 2033
- Figure 120: Asia Pacific Preservative-Free Eye Drops Volume (K), by Mode of Sale 2025 & 2033
- Figure 121: Asia Pacific Preservative-Free Eye Drops Revenue Share (%), by Mode of Sale 2025 & 2033
- Figure 122: Asia Pacific Preservative-Free Eye Drops Volume Share (%), by Mode of Sale 2025 & 2033
- Figure 123: Asia Pacific Preservative-Free Eye Drops Revenue (billion), by Age Group 2025 & 2033
- Figure 124: Asia Pacific Preservative-Free Eye Drops Volume (K), by Age Group 2025 & 2033
- Figure 125: Asia Pacific Preservative-Free Eye Drops Revenue Share (%), by Age Group 2025 & 2033
- Figure 126: Asia Pacific Preservative-Free Eye Drops Volume Share (%), by Age Group 2025 & 2033
- Figure 127: Asia Pacific Preservative-Free Eye Drops Revenue (billion), by Application 2025 & 2033
- Figure 128: Asia Pacific Preservative-Free Eye Drops Volume (K), by Application 2025 & 2033
- Figure 129: Asia Pacific Preservative-Free Eye Drops Revenue Share (%), by Application 2025 & 2033
- Figure 130: Asia Pacific Preservative-Free Eye Drops Volume Share (%), by Application 2025 & 2033
- Figure 131: Asia Pacific Preservative-Free Eye Drops Revenue (billion), by Distribution Channel 2025 & 2033
- Figure 132: Asia Pacific Preservative-Free Eye Drops Volume (K), by Distribution Channel 2025 & 2033
- Figure 133: Asia Pacific Preservative-Free Eye Drops Revenue Share (%), by Distribution Channel 2025 & 2033
- Figure 134: Asia Pacific Preservative-Free Eye Drops Volume Share (%), by Distribution Channel 2025 & 2033
- Figure 135: Asia Pacific Preservative-Free Eye Drops Revenue (billion), by End User 2025 & 2033
- Figure 136: Asia Pacific Preservative-Free Eye Drops Volume (K), by End User 2025 & 2033
- Figure 137: Asia Pacific Preservative-Free Eye Drops Revenue Share (%), by End User 2025 & 2033
- Figure 138: Asia Pacific Preservative-Free Eye Drops Volume Share (%), by End User 2025 & 2033
- Figure 139: Asia Pacific Preservative-Free Eye Drops Revenue (billion), by Country 2025 & 2033
- Figure 140: Asia Pacific Preservative-Free Eye Drops Volume (K), by Country 2025 & 2033
- Figure 141: Asia Pacific Preservative-Free Eye Drops Revenue Share (%), by Country 2025 & 2033
- Figure 142: Asia Pacific Preservative-Free Eye Drops Volume Share (%), by Country 2025 & 2033
List of Tables
- Table 1: Global Preservative-Free Eye Drops Revenue billion Forecast, by Type 2020 & 2033
- Table 2: Global Preservative-Free Eye Drops Volume K Forecast, by Type 2020 & 2033
- Table 3: Global Preservative-Free Eye Drops Revenue billion Forecast, by Mode of Sale 2020 & 2033
- Table 4: Global Preservative-Free Eye Drops Volume K Forecast, by Mode of Sale 2020 & 2033
- Table 5: Global Preservative-Free Eye Drops Revenue billion Forecast, by Age Group 2020 & 2033
- Table 6: Global Preservative-Free Eye Drops Volume K Forecast, by Age Group 2020 & 2033
- Table 7: Global Preservative-Free Eye Drops Revenue billion Forecast, by Application 2020 & 2033
- Table 8: Global Preservative-Free Eye Drops Volume K Forecast, by Application 2020 & 2033
- Table 9: Global Preservative-Free Eye Drops Revenue billion Forecast, by Distribution Channel 2020 & 2033
- Table 10: Global Preservative-Free Eye Drops Volume K Forecast, by Distribution Channel 2020 & 2033
- Table 11: Global Preservative-Free Eye Drops Revenue billion Forecast, by End User 2020 & 2033
- Table 12: Global Preservative-Free Eye Drops Volume K Forecast, by End User 2020 & 2033
- Table 13: Global Preservative-Free Eye Drops Revenue billion Forecast, by Region 2020 & 2033
- Table 14: Global Preservative-Free Eye Drops Volume K Forecast, by Region 2020 & 2033
- Table 15: Global Preservative-Free Eye Drops Revenue billion Forecast, by Type 2020 & 2033
- Table 16: Global Preservative-Free Eye Drops Volume K Forecast, by Type 2020 & 2033
- Table 17: Global Preservative-Free Eye Drops Revenue billion Forecast, by Mode of Sale 2020 & 2033
- Table 18: Global Preservative-Free Eye Drops Volume K Forecast, by Mode of Sale 2020 & 2033
- Table 19: Global Preservative-Free Eye Drops Revenue billion Forecast, by Age Group 2020 & 2033
- Table 20: Global Preservative-Free Eye Drops Volume K Forecast, by Age Group 2020 & 2033
- Table 21: Global Preservative-Free Eye Drops Revenue billion Forecast, by Application 2020 & 2033
- Table 22: Global Preservative-Free Eye Drops Volume K Forecast, by Application 2020 & 2033
- Table 23: Global Preservative-Free Eye Drops Revenue billion Forecast, by Distribution Channel 2020 & 2033
- Table 24: Global Preservative-Free Eye Drops Volume K Forecast, by Distribution Channel 2020 & 2033
- Table 25: Global Preservative-Free Eye Drops Revenue billion Forecast, by End User 2020 & 2033
- Table 26: Global Preservative-Free Eye Drops Volume K Forecast, by End User 2020 & 2033
- Table 27: Global Preservative-Free Eye Drops Revenue billion Forecast, by Country 2020 & 2033
- Table 28: Global Preservative-Free Eye Drops Volume K Forecast, by Country 2020 & 2033
- Table 29: United States Preservative-Free Eye Drops Revenue (billion) Forecast, by Application 2020 & 2033
- Table 30: United States Preservative-Free Eye Drops Volume (K) Forecast, by Application 2020 & 2033
- Table 31: Canada Preservative-Free Eye Drops Revenue (billion) Forecast, by Application 2020 & 2033
- Table 32: Canada Preservative-Free Eye Drops Volume (K) Forecast, by Application 2020 & 2033
- Table 33: Mexico Preservative-Free Eye Drops Revenue (billion) Forecast, by Application 2020 & 2033
- Table 34: Mexico Preservative-Free Eye Drops Volume (K) Forecast, by Application 2020 & 2033
- Table 35: Global Preservative-Free Eye Drops Revenue billion Forecast, by Type 2020 & 2033
- Table 36: Global Preservative-Free Eye Drops Volume K Forecast, by Type 2020 & 2033
- Table 37: Global Preservative-Free Eye Drops Revenue billion Forecast, by Mode of Sale 2020 & 2033
- Table 38: Global Preservative-Free Eye Drops Volume K Forecast, by Mode of Sale 2020 & 2033
- Table 39: Global Preservative-Free Eye Drops Revenue billion Forecast, by Age Group 2020 & 2033
- Table 40: Global Preservative-Free Eye Drops Volume K Forecast, by Age Group 2020 & 2033
- Table 41: Global Preservative-Free Eye Drops Revenue billion Forecast, by Application 2020 & 2033
- Table 42: Global Preservative-Free Eye Drops Volume K Forecast, by Application 2020 & 2033
- Table 43: Global Preservative-Free Eye Drops Revenue billion Forecast, by Distribution Channel 2020 & 2033
- Table 44: Global Preservative-Free Eye Drops Volume K Forecast, by Distribution Channel 2020 & 2033
- Table 45: Global Preservative-Free Eye Drops Revenue billion Forecast, by End User 2020 & 2033
- Table 46: Global Preservative-Free Eye Drops Volume K Forecast, by End User 2020 & 2033
- Table 47: Global Preservative-Free Eye Drops Revenue billion Forecast, by Country 2020 & 2033
- Table 48: Global Preservative-Free Eye Drops Volume K Forecast, by Country 2020 & 2033
- Table 49: Brazil Preservative-Free Eye Drops Revenue (billion) Forecast, by Application 2020 & 2033
- Table 50: Brazil Preservative-Free Eye Drops Volume (K) Forecast, by Application 2020 & 2033
- Table 51: Argentina Preservative-Free Eye Drops Revenue (billion) Forecast, by Application 2020 & 2033
- Table 52: Argentina Preservative-Free Eye Drops Volume (K) Forecast, by Application 2020 & 2033
- Table 53: Rest of South America Preservative-Free Eye Drops Revenue (billion) Forecast, by Application 2020 & 2033
- Table 54: Rest of South America Preservative-Free Eye Drops Volume (K) Forecast, by Application 2020 & 2033
- Table 55: Global Preservative-Free Eye Drops Revenue billion Forecast, by Type 2020 & 2033
- Table 56: Global Preservative-Free Eye Drops Volume K Forecast, by Type 2020 & 2033
- Table 57: Global Preservative-Free Eye Drops Revenue billion Forecast, by Mode of Sale 2020 & 2033
- Table 58: Global Preservative-Free Eye Drops Volume K Forecast, by Mode of Sale 2020 & 2033
- Table 59: Global Preservative-Free Eye Drops Revenue billion Forecast, by Age Group 2020 & 2033
- Table 60: Global Preservative-Free Eye Drops Volume K Forecast, by Age Group 2020 & 2033
- Table 61: Global Preservative-Free Eye Drops Revenue billion Forecast, by Application 2020 & 2033
- Table 62: Global Preservative-Free Eye Drops Volume K Forecast, by Application 2020 & 2033
- Table 63: Global Preservative-Free Eye Drops Revenue billion Forecast, by Distribution Channel 2020 & 2033
- Table 64: Global Preservative-Free Eye Drops Volume K Forecast, by Distribution Channel 2020 & 2033
- Table 65: Global Preservative-Free Eye Drops Revenue billion Forecast, by End User 2020 & 2033
- Table 66: Global Preservative-Free Eye Drops Volume K Forecast, by End User 2020 & 2033
- Table 67: Global Preservative-Free Eye Drops Revenue billion Forecast, by Country 2020 & 2033
- Table 68: Global Preservative-Free Eye Drops Volume K Forecast, by Country 2020 & 2033
- Table 69: United Kingdom Preservative-Free Eye Drops Revenue (billion) Forecast, by Application 2020 & 2033
- Table 70: United Kingdom Preservative-Free Eye Drops Volume (K) Forecast, by Application 2020 & 2033
- Table 71: Germany Preservative-Free Eye Drops Revenue (billion) Forecast, by Application 2020 & 2033
- Table 72: Germany Preservative-Free Eye Drops Volume (K) Forecast, by Application 2020 & 2033
- Table 73: France Preservative-Free Eye Drops Revenue (billion) Forecast, by Application 2020 & 2033
- Table 74: France Preservative-Free Eye Drops Volume (K) Forecast, by Application 2020 & 2033
- Table 75: Italy Preservative-Free Eye Drops Revenue (billion) Forecast, by Application 2020 & 2033
- Table 76: Italy Preservative-Free Eye Drops Volume (K) Forecast, by Application 2020 & 2033
- Table 77: Spain Preservative-Free Eye Drops Revenue (billion) Forecast, by Application 2020 & 2033
- Table 78: Spain Preservative-Free Eye Drops Volume (K) Forecast, by Application 2020 & 2033
- Table 79: Russia Preservative-Free Eye Drops Revenue (billion) Forecast, by Application 2020 & 2033
- Table 80: Russia Preservative-Free Eye Drops Volume (K) Forecast, by Application 2020 & 2033
- Table 81: Benelux Preservative-Free Eye Drops Revenue (billion) Forecast, by Application 2020 & 2033
- Table 82: Benelux Preservative-Free Eye Drops Volume (K) Forecast, by Application 2020 & 2033
- Table 83: Nordics Preservative-Free Eye Drops Revenue (billion) Forecast, by Application 2020 & 2033
- Table 84: Nordics Preservative-Free Eye Drops Volume (K) Forecast, by Application 2020 & 2033
- Table 85: Rest of Europe Preservative-Free Eye Drops Revenue (billion) Forecast, by Application 2020 & 2033
- Table 86: Rest of Europe Preservative-Free Eye Drops Volume (K) Forecast, by Application 2020 & 2033
- Table 87: Global Preservative-Free Eye Drops Revenue billion Forecast, by Type 2020 & 2033
- Table 88: Global Preservative-Free Eye Drops Volume K Forecast, by Type 2020 & 2033
- Table 89: Global Preservative-Free Eye Drops Revenue billion Forecast, by Mode of Sale 2020 & 2033
- Table 90: Global Preservative-Free Eye Drops Volume K Forecast, by Mode of Sale 2020 & 2033
- Table 91: Global Preservative-Free Eye Drops Revenue billion Forecast, by Age Group 2020 & 2033
- Table 92: Global Preservative-Free Eye Drops Volume K Forecast, by Age Group 2020 & 2033
- Table 93: Global Preservative-Free Eye Drops Revenue billion Forecast, by Application 2020 & 2033
- Table 94: Global Preservative-Free Eye Drops Volume K Forecast, by Application 2020 & 2033
- Table 95: Global Preservative-Free Eye Drops Revenue billion Forecast, by Distribution Channel 2020 & 2033
- Table 96: Global Preservative-Free Eye Drops Volume K Forecast, by Distribution Channel 2020 & 2033
- Table 97: Global Preservative-Free Eye Drops Revenue billion Forecast, by End User 2020 & 2033
- Table 98: Global Preservative-Free Eye Drops Volume K Forecast, by End User 2020 & 2033
- Table 99: Global Preservative-Free Eye Drops Revenue billion Forecast, by Country 2020 & 2033
- Table 100: Global Preservative-Free Eye Drops Volume K Forecast, by Country 2020 & 2033
- Table 101: Turkey Preservative-Free Eye Drops Revenue (billion) Forecast, by Application 2020 & 2033
- Table 102: Turkey Preservative-Free Eye Drops Volume (K) Forecast, by Application 2020 & 2033
- Table 103: Israel Preservative-Free Eye Drops Revenue (billion) Forecast, by Application 2020 & 2033
- Table 104: Israel Preservative-Free Eye Drops Volume (K) Forecast, by Application 2020 & 2033
- Table 105: GCC Preservative-Free Eye Drops Revenue (billion) Forecast, by Application 2020 & 2033
- Table 106: GCC Preservative-Free Eye Drops Volume (K) Forecast, by Application 2020 & 2033
- Table 107: North Africa Preservative-Free Eye Drops Revenue (billion) Forecast, by Application 2020 & 2033
- Table 108: North Africa Preservative-Free Eye Drops Volume (K) Forecast, by Application 2020 & 2033
- Table 109: South Africa Preservative-Free Eye Drops Revenue (billion) Forecast, by Application 2020 & 2033
- Table 110: South Africa Preservative-Free Eye Drops Volume (K) Forecast, by Application 2020 & 2033
- Table 111: Rest of Middle East & Africa Preservative-Free Eye Drops Revenue (billion) Forecast, by Application 2020 & 2033
- Table 112: Rest of Middle East & Africa Preservative-Free Eye Drops Volume (K) Forecast, by Application 2020 & 2033
- Table 113: Global Preservative-Free Eye Drops Revenue billion Forecast, by Type 2020 & 2033
- Table 114: Global Preservative-Free Eye Drops Volume K Forecast, by Type 2020 & 2033
- Table 115: Global Preservative-Free Eye Drops Revenue billion Forecast, by Mode of Sale 2020 & 2033
- Table 116: Global Preservative-Free Eye Drops Volume K Forecast, by Mode of Sale 2020 & 2033
- Table 117: Global Preservative-Free Eye Drops Revenue billion Forecast, by Age Group 2020 & 2033
- Table 118: Global Preservative-Free Eye Drops Volume K Forecast, by Age Group 2020 & 2033
- Table 119: Global Preservative-Free Eye Drops Revenue billion Forecast, by Application 2020 & 2033
- Table 120: Global Preservative-Free Eye Drops Volume K Forecast, by Application 2020 & 2033
- Table 121: Global Preservative-Free Eye Drops Revenue billion Forecast, by Distribution Channel 2020 & 2033
- Table 122: Global Preservative-Free Eye Drops Volume K Forecast, by Distribution Channel 2020 & 2033
- Table 123: Global Preservative-Free Eye Drops Revenue billion Forecast, by End User 2020 & 2033
- Table 124: Global Preservative-Free Eye Drops Volume K Forecast, by End User 2020 & 2033
- Table 125: Global Preservative-Free Eye Drops Revenue billion Forecast, by Country 2020 & 2033
- Table 126: Global Preservative-Free Eye Drops Volume K Forecast, by Country 2020 & 2033
- Table 127: China Preservative-Free Eye Drops Revenue (billion) Forecast, by Application 2020 & 2033
- Table 128: China Preservative-Free Eye Drops Volume (K) Forecast, by Application 2020 & 2033
- Table 129: India Preservative-Free Eye Drops Revenue (billion) Forecast, by Application 2020 & 2033
- Table 130: India Preservative-Free Eye Drops Volume (K) Forecast, by Application 2020 & 2033
- Table 131: Japan Preservative-Free Eye Drops Revenue (billion) Forecast, by Application 2020 & 2033
- Table 132: Japan Preservative-Free Eye Drops Volume (K) Forecast, by Application 2020 & 2033
- Table 133: South Korea Preservative-Free Eye Drops Revenue (billion) Forecast, by Application 2020 & 2033
- Table 134: South Korea Preservative-Free Eye Drops Volume (K) Forecast, by Application 2020 & 2033
- Table 135: ASEAN Preservative-Free Eye Drops Revenue (billion) Forecast, by Application 2020 & 2033
- Table 136: ASEAN Preservative-Free Eye Drops Volume (K) Forecast, by Application 2020 & 2033
- Table 137: Oceania Preservative-Free Eye Drops Revenue (billion) Forecast, by Application 2020 & 2033
- Table 138: Oceania Preservative-Free Eye Drops Volume (K) Forecast, by Application 2020 & 2033
- Table 139: Rest of Asia Pacific Preservative-Free Eye Drops Revenue (billion) Forecast, by Application 2020 & 2033
- Table 140: Rest of Asia Pacific Preservative-Free Eye Drops Volume (K) Forecast, by Application 2020 & 2033
Frequently Asked Questions
1. What is the projected Compound Annual Growth Rate (CAGR) of the Preservative-Free Eye Drops?
The projected CAGR is approximately 4.7%.
2. Which companies are prominent players in the Preservative-Free Eye Drops?
Key companies in the market include Alcon, Bausch + Lomb, Johnson & Johnson Vision, AbbVie (Allergan), Santen Pharmaceutical, Thea Pharma, URSAPHARM Arzneimittel GmbH, Sun Pharmaceutical Industries, Rohto Pharmaceutical, Oasis Medical, Sentiss Pharma, Novartis, Prestige Consumer Healthcare, Others.
3. What are the main segments of the Preservative-Free Eye Drops?
The market segments include Type, Mode of Sale, Age Group, Application, Distribution Channel, End User.
4. Can you provide details about the market size?
The market size is estimated to be USD 1.21 billion as of 2022.
5. What are some drivers contributing to market growth?
N/A
6. What are the notable trends driving market growth?
N/A
7. Are there any restraints impacting market growth?
N/A
8. Can you provide examples of recent developments in the market?
N/A
9. What pricing options are available for accessing the report?
Pricing options include single-user, multi-user, and enterprise licenses priced at USD 3350.00, USD 5025.00, and USD 6700.00 respectively.
10. Is the market size provided in terms of value or volume?
The market size is provided in terms of value, measured in billion and volume, measured in K.
11. Are there any specific market keywords associated with the report?
Yes, the market keyword associated with the report is "Preservative-Free Eye Drops," which aids in identifying and referencing the specific market segment covered.
12. How do I determine which pricing option suits my needs best?
The pricing options vary based on user requirements and access needs. Individual users may opt for single-user licenses, while businesses requiring broader access may choose multi-user or enterprise licenses for cost-effective access to the report.
13. Are there any additional resources or data provided in the Preservative-Free Eye Drops report?
While the report offers comprehensive insights, it's advisable to review the specific contents or supplementary materials provided to ascertain if additional resources or data are available.
14. How can I stay updated on further developments or reports in the Preservative-Free Eye Drops?
To stay informed about further developments, trends, and reports in the Preservative-Free Eye Drops, consider subscribing to industry newsletters, following relevant companies and organizations, or regularly checking reputable industry news sources and publications.
Methodology
Step 1 - Identification of Relevant Samples Size from Population Database


Step 2 - Approaches for Defining Global Market Size (Value, Volume* & Price*)

Note*: In applicable scenarios
Step 3 - Data Sources
Primary Research
- Web Analytics
- Survey Reports
- Research Institute
- Latest Research Reports
- Opinion Leaders
Secondary Research
- Annual Reports
- White Paper
- Latest Press Release
- Industry Association
- Paid Database
- Investor Presentations

Step 4 - Data Triangulation
Involves using different sources of information in order to increase the validity of a study
These sources are likely to be stakeholders in a program - participants, other researchers, program staff, other community members, and so on.
Then we put all data in single framework & apply various statistical tools to find out the dynamic on the market.
During the analysis stage, feedback from the stakeholder groups would be compared to determine areas of agreement as well as areas of divergence