

Key Insights
The global Protein Characterization and Quantification market is experiencing significant expansion, propelled by the rapid growth of the biotechnology and pharmaceutical sectors, alongside advancements in proteomics research and the increasing demand for personalized medicine. The market, valued at approximately $2.49 billion in 2025, is projected to achieve a Compound Annual Growth Rate (CAGR) of 9% from 2025 to 2033. This growth is attributed to several key drivers. The rising incidence of chronic diseases fuels the demand for novel therapeutics, consequently increasing the utilization of protein characterization and quantification methods in drug discovery and development. Furthermore, technological innovations in mass spectrometry and chromatography are enhancing protein analysis accuracy and efficiency, leading to broader adoption. The clinical diagnostics segment is also expanding due to the growing need for precise and rapid protein biomarker detection for disease diagnosis and prognosis. The outsourcing of protein characterization services by Contract Research Organizations (CROs) further contributes to market expansion.
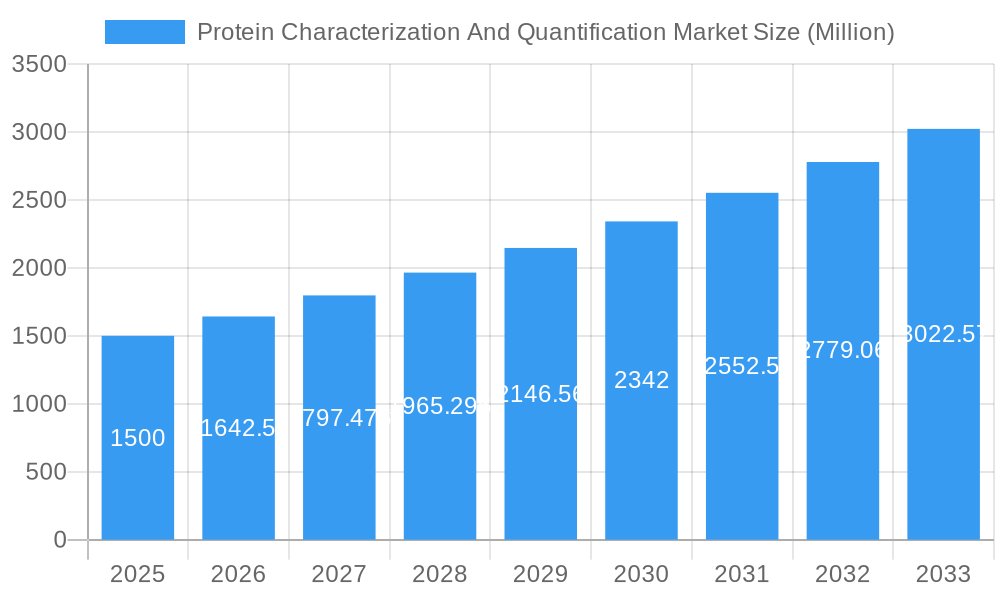
Protein Characterization And Quantification Market Market Size (In Billion)
Despite these growth drivers, market expansion faces certain restraints. The high cost of advanced instrumentation and specialized expertise can present a barrier to entry for smaller research entities. Additionally, the inherent complexity of protein analysis, particularly concerning post-translational modifications, necessitates continuous innovation in analytical techniques and data interpretation. Nevertheless, the Protein Characterization and Quantification market exhibits a positive long-term outlook, supported by ongoing technological advancements, increased research investment, and the accelerating focus on precision medicine. The market is segmented by product (consumables, instruments, services), application (drug discovery, clinical diagnosis, other applications), and end-user (biotechnology & pharmaceutical companies, CROs, other end-users). Leading companies such as Thermo Fisher Scientific and Agilent Technologies are actively shaping market growth through product innovation and strategic collaborations. Significant growth is anticipated in North America and Europe, with the Asia Pacific region emerging as a key growth market.
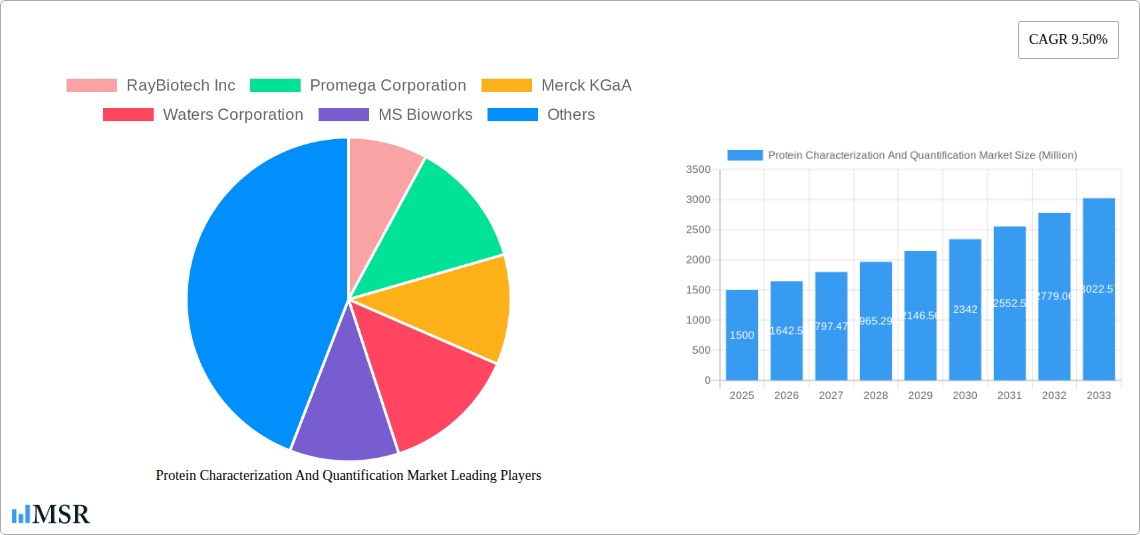
Protein Characterization And Quantification Market Company Market Share
Protein Characterization and Quantification Market: A Comprehensive Report (2019-2033)
This comprehensive report provides an in-depth analysis of the Protein Characterization and Quantification Market, offering valuable insights for stakeholders across the biotechnology, pharmaceutical, and research sectors. The report covers market dynamics, key segments, leading players, and future growth opportunities, leveraging data from the historical period (2019-2024), base year (2025), and forecast period (2025-2033). The market is projected to reach xx Million by 2033, exhibiting a CAGR of xx% during the forecast period.
Protein Characterization And Quantification Market Market Concentration & Dynamics
The Protein Characterization and Quantification market exhibits a moderately concentrated landscape, with several key players holding significant market share. Thermo Fisher Scientific, Merck KGaA, and Agilent Technologies are among the leading companies, driving innovation and setting industry standards. The market is characterized by a dynamic innovation ecosystem, with continuous advancements in technologies like mass spectrometry, chromatography, and ELISA. Stringent regulatory frameworks, particularly in the pharmaceutical and clinical diagnostic sectors, influence product development and market entry. Substitute products, while available, often lack the sensitivity and specificity of established methods, limiting their widespread adoption. End-user trends show a growing preference for automated, high-throughput solutions to address increasing sample volumes and demands for faster turnaround times. The market has witnessed a moderate level of M&A activity in recent years, with several strategic acquisitions aimed at expanding product portfolios and strengthening market positions. For instance, xx M&A deals were recorded between 2020 and 2024, primarily focused on strengthening capabilities in specific technologies or expanding geographic reach. Market share data for the top 5 players is as follows:
- Thermo Fisher Scientific: xx%
- Merck KGaA: xx%
- Agilent Technologies: xx%
- Danaher Corporation: xx%
- QIAGEN N.V.: xx%
Protein Characterization And Quantification Market Industry Insights & Trends
The Protein Characterization and Quantification market is experiencing robust growth driven by several key factors. The increasing prevalence of chronic diseases globally fuels the demand for advanced diagnostic tools and therapeutic development. The rising investments in drug discovery and development initiatives by pharmaceutical and biotechnology companies are creating significant market opportunities. The growing adoption of proteomics research in academic and industrial settings further contributes to market expansion. Technological advancements, such as the development of miniaturized and automated systems, are enhancing the efficiency and accuracy of protein characterization. The market is witnessing a shift towards next-generation technologies, including label-free methods, improving sensitivity and reducing assay costs. Evolving consumer behavior shows a preference for integrated solutions that streamline workflows and reduce processing time. The global market size was valued at xx Million in 2024, and it is expected to reach xx Million by 2033.
Key Markets & Segments Leading Protein Characterization And Quantification Market
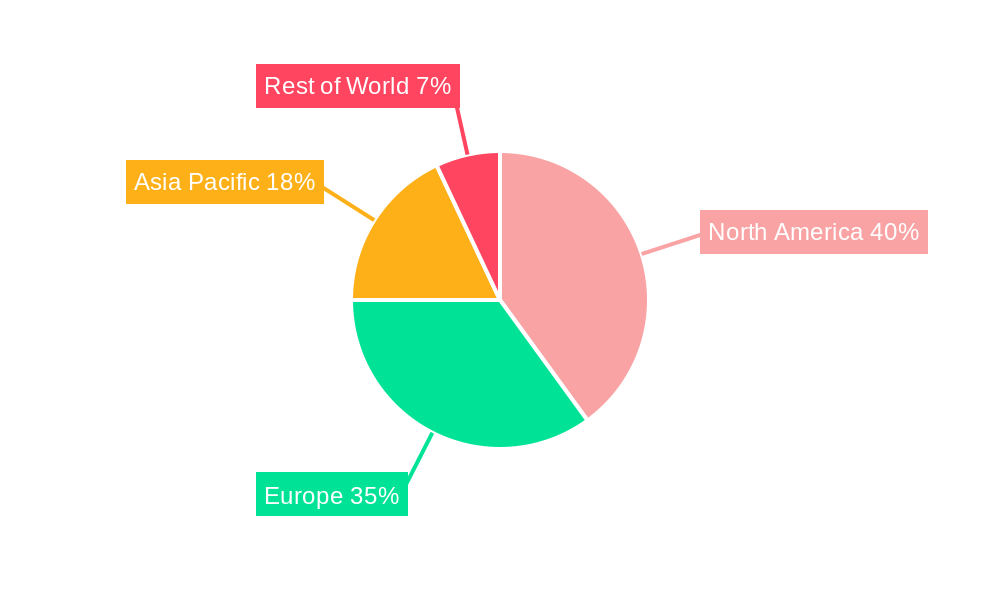
The North American region currently dominates the Protein Characterization and Quantification market, driven by strong research funding, a large pharmaceutical industry, and the presence of major instrument manufacturers. Within this region, the United States holds a significant market share.
Dominant Segments:
- Product & Services: Instruments and consumables account for the largest share of market revenue, reflecting the high demand for sophisticated analytical tools and essential reagents.
- Application: Drug discovery and development is the primary driver, followed by clinical diagnostics.
- End User: Biotechnology and pharmaceutical companies are the primary end-users, due to their extensive research and development activities.
Key Drivers:
- North America: Strong R&D investments, well-established pharmaceutical industry.
- Europe: Growing focus on personalized medicine and advanced diagnostics.
- Asia Pacific: Rapid economic growth, expanding healthcare infrastructure, and rising prevalence of chronic diseases.
Protein Characterization And Quantification Market Product Developments
Recent years have witnessed significant advancements in protein characterization technologies, with a focus on improving sensitivity, throughput, and automation. New mass spectrometry instruments offer enhanced resolution and sensitivity, enabling the analysis of complex protein mixtures. Advanced chromatographic techniques, such as high-performance liquid chromatography (HPLC) and ultra-high-performance liquid chromatography (UHPLC), provide improved separation and identification of proteins. The development of novel immunoassay formats, including multiplexed assays, is accelerating the speed and efficiency of protein quantification. These technological advancements are continuously driving market growth by expanding the scope of applications and enhancing the capabilities of existing methodologies.
Challenges in the Protein Characterization And Quantification Market Market
The Protein Characterization and Quantification market faces several challenges, including the high cost of advanced instrumentation and specialized reagents, which can limit accessibility for smaller research groups or laboratories. Regulatory hurdles associated with the approval of new diagnostic tools and therapeutic agents represent significant barriers to market entry. Supply chain disruptions impacting the availability of essential reagents and components have also been a concern, leading to increased costs and potential delays in research projects. Furthermore, intense competition among established players and emerging companies necessitates continuous innovation to maintain a competitive edge.
Forces Driving Protein Characterization And Quantification Market Growth
Several factors are driving the growth of the Protein Characterization and Quantification market. Technological advancements such as mass spectrometry and advanced chromatography techniques are improving the sensitivity and speed of analysis. Rising government investments in research and development across the globe are fueling the demand for higher-throughput and more sophisticated technologies. The rising prevalence of chronic diseases is driving the need for improved diagnostics and drug discovery tools. Regulatory support for the development and adoption of advanced proteomic technologies is further stimulating market growth. For example, the FDA's initiatives to streamline the approval process for novel diagnostic tools are accelerating market expansion.
Challenges in the Protein Characterization And Quantification Market Market
Long-term growth is expected to be fueled by continued innovation in mass spectrometry, novel labeling strategies, and advancements in data analysis software. Strategic partnerships between instrument manufacturers and software developers will provide more comprehensive solutions. The expansion into emerging markets and the increasing integration of proteomics technologies into personalized medicine initiatives will create significant long-term growth catalysts.
Emerging Opportunities in Protein Characterization And Quantification Market
Emerging opportunities include the development of point-of-care diagnostics for protein biomarkers, expanding the market reach for rapid and convenient testing. The integration of artificial intelligence (AI) and machine learning (ML) algorithms into data analysis workflows promises to improve the speed and accuracy of protein identification and quantification. The rising demand for personalized medicine is also driving opportunities for developing customized protein characterization solutions. Lastly, the exploration of new applications in areas such as food safety and environmental monitoring is creating new market avenues.
Leading Players in the Protein Characterization And Quantification Market Sector
- RayBiotech Inc
- Promega Corporation
- Merck KGaA
- Waters Corporation
- MS Bioworks
- Sartorius AG
- QIAGEN N V
- Shimadzu Corporation
- VProteomics
- Creative Proteomics
- Thermo Fisher Scientific
- Agilent Technologies
- HORIBA Ltd
Key Milestones in Protein Characterization And Quantification Market Industry
- April 2022: PerkinElmer, Inc. launched two ready-to-use HTRF and AlphaLISA no-wash assay kits for detecting and quantifying CHO HCP impurities in biopharmaceutical manufacturing. This launch streamlined workflows and enhanced the efficiency of impurity analysis, contributing to improved biotherapeutic quality.
- February 2023: Charles River Laboratories International, Inc. launched its first ELISA kit for detecting and quantifying residual host cell proteins (HCP) in CHO-based biotherapeutics. This product expansion broadened the company's portfolio and strengthened its position in biopharmaceutical quality control.
Strategic Outlook for Protein Characterization And Quantification Market Market
The Protein Characterization and Quantification market is poised for sustained growth driven by technological innovation, increasing R&D investments, and the growing adoption of proteomics across various applications. Strategic opportunities exist for companies to focus on developing integrated solutions that combine instrumentation, software, and services to streamline workflows. Expansion into emerging markets and focusing on personalized medicine applications are key strategies for future growth. Collaboration and partnerships are essential for companies to access diverse expertise and enhance their product offerings. The market is anticipated to witness continued consolidation and M&A activity as companies strive to gain a competitive edge and expand their market reach.
Protein Characterization And Quantification Market Segmentation
-
1. Product and Services
- 1.1. Consumables
-
1.2. Instruments
- 1.2.1. Mass Spectrometry Instruments
- 1.2.2. Chromatography Instruments
- 1.2.3. Electrophoresis Instruments
- 1.2.4. Label-free Detection Instruments
- 1.2.5. Spectroscopy Instruments
- 1.2.6. Other Instruments
-
2. Application
- 2.1. Drug Discovery & Development
- 2.2. Clinical Diagnosis
- 2.3. Other Applications
-
3. End User
- 3.1. Biotechnology & Pharmaceutical Companies
- 3.2. Contract Research Organization
- 3.3. Other End Users
Protein Characterization And Quantification Market Segmentation By Geography
-
1. North America
- 1.1. United States
- 1.2. Canada
- 1.3. Mexico
-
2. Europe
- 2.1. Germany
- 2.2. United Kingdom
- 2.3. France
- 2.4. Italy
- 2.5. Spain
- 2.6. Rest of Europe
-
3. Asia Pacific
- 3.1. China
- 3.2. Japan
- 3.3. India
- 3.4. Australia
- 3.5. South Korea
- 3.6. Rest of Asia Pacific
-
4. Middle East and Africa
- 4.1. GCC
- 4.2. South Africa
- 4.3. Rest of Middle East and Africa
-
5. South America
- 5.1. Brazil
- 5.2. Argentina
- 5.3. Rest of South America
Protein Characterization And Quantification Market Regional Market Share
Geographic Coverage of Protein Characterization And Quantification Market
Protein Characterization And Quantification Market REPORT HIGHLIGHTS
| Aspects | Details |
|---|---|
| Study Period | 2020-2034 |
| Base Year | 2025 |
| Estimated Year | 2026 |
| Forecast Period | 2026-2034 |
| Historical Period | 2020-2025 |
| Growth Rate | CAGR of 9% from 2020-2034 |
| Segmentation |
|
Table of Contents
- 1. Introduction
- 1.1. Research Scope
- 1.2. Market Segmentation
- 1.3. Research Objective
- 1.4. Definitions and Assumptions
- 2. Executive Summary
- 2.1. Market Snapshot
- 3. Market Dynamics
- 3.1. Market Drivers
- 3.2. Market Restrains
- 3.3. Market Trends
- 3.4. Market Opportunities
- 4. Market Factor Analysis
- 4.1. Porters Five Forces
- 4.1.1. Bargaining Power of Suppliers
- 4.1.2. Bargaining Power of Buyers
- 4.1.3. Threat of New Entrants
- 4.1.4. Threat of Substitutes
- 4.1.5. Competitive Rivalry
- 4.2. PESTEL analysis
- 4.3. BCG Analysis
- 4.3.1. Stars (High Growth, High Market Share)
- 4.3.2. Cash Cows (Low Growth, High Market Share)
- 4.3.3. Question Mark (High Growth, Low Market Share)
- 4.3.4. Dogs (Low Growth, Low Market Share)
- 4.4. Ansoff Matrix Analysis
- 4.5. Supply Chain Analysis
- 4.6. Regulatory Landscape
- 4.7. Current Market Potential and Opportunity Assessment (TAM–SAM–SOM Framework)
- 4.8. MSR Analyst Note
- 4.1. Porters Five Forces
- 5. Market Analysis, Insights and Forecast 2021-2033
- 5.1. Market Analysis, Insights and Forecast - by Product and Services
- 5.1.1. Consumables
- 5.1.2. Instruments
- 5.1.2.1. Mass Spectrometry Instruments
- 5.1.2.2. Chromatography Instruments
- 5.1.2.3. Electrophoresis Instruments
- 5.1.2.4. Label-free Detection Instruments
- 5.1.2.5. Spectroscopy Instruments
- 5.1.2.6. Other Instruments
- 5.2. Market Analysis, Insights and Forecast - by Application
- 5.2.1. Drug Discovery & Development
- 5.2.2. Clinical Diagnosis
- 5.2.3. Other Applications
- 5.3. Market Analysis, Insights and Forecast - by End User
- 5.3.1. Biotechnology & Pharmaceutical Companies
- 5.3.2. Contract Research Organization
- 5.3.3. Other End Users
- 5.4. Market Analysis, Insights and Forecast - by Region
- 5.4.1. North America
- 5.4.2. Europe
- 5.4.3. Asia Pacific
- 5.4.4. Middle East and Africa
- 5.4.5. South America
- 5.1. Market Analysis, Insights and Forecast - by Product and Services
- 6. Global Protein Characterization And Quantification Market Analysis, Insights and Forecast, 2021-2033
- 6.1. Market Analysis, Insights and Forecast - by Product and Services
- 6.1.1. Consumables
- 6.1.2. Instruments
- 6.1.2.1. Mass Spectrometry Instruments
- 6.1.2.2. Chromatography Instruments
- 6.1.2.3. Electrophoresis Instruments
- 6.1.2.4. Label-free Detection Instruments
- 6.1.2.5. Spectroscopy Instruments
- 6.1.2.6. Other Instruments
- 6.2. Market Analysis, Insights and Forecast - by Application
- 6.2.1. Drug Discovery & Development
- 6.2.2. Clinical Diagnosis
- 6.2.3. Other Applications
- 6.3. Market Analysis, Insights and Forecast - by End User
- 6.3.1. Biotechnology & Pharmaceutical Companies
- 6.3.2. Contract Research Organization
- 6.3.3. Other End Users
- 6.1. Market Analysis, Insights and Forecast - by Product and Services
- 7. North America Protein Characterization And Quantification Market Analysis, Insights and Forecast, 2020-2032
- 7.1. Market Analysis, Insights and Forecast - by Product and Services
- 7.1.1. Consumables
- 7.1.2. Instruments
- 7.1.2.1. Mass Spectrometry Instruments
- 7.1.2.2. Chromatography Instruments
- 7.1.2.3. Electrophoresis Instruments
- 7.1.2.4. Label-free Detection Instruments
- 7.1.2.5. Spectroscopy Instruments
- 7.1.2.6. Other Instruments
- 7.2. Market Analysis, Insights and Forecast - by Application
- 7.2.1. Drug Discovery & Development
- 7.2.2. Clinical Diagnosis
- 7.2.3. Other Applications
- 7.3. Market Analysis, Insights and Forecast - by End User
- 7.3.1. Biotechnology & Pharmaceutical Companies
- 7.3.2. Contract Research Organization
- 7.3.3. Other End Users
- 7.1. Market Analysis, Insights and Forecast - by Product and Services
- 8. Europe Protein Characterization And Quantification Market Analysis, Insights and Forecast, 2020-2032
- 8.1. Market Analysis, Insights and Forecast - by Product and Services
- 8.1.1. Consumables
- 8.1.2. Instruments
- 8.1.2.1. Mass Spectrometry Instruments
- 8.1.2.2. Chromatography Instruments
- 8.1.2.3. Electrophoresis Instruments
- 8.1.2.4. Label-free Detection Instruments
- 8.1.2.5. Spectroscopy Instruments
- 8.1.2.6. Other Instruments
- 8.2. Market Analysis, Insights and Forecast - by Application
- 8.2.1. Drug Discovery & Development
- 8.2.2. Clinical Diagnosis
- 8.2.3. Other Applications
- 8.3. Market Analysis, Insights and Forecast - by End User
- 8.3.1. Biotechnology & Pharmaceutical Companies
- 8.3.2. Contract Research Organization
- 8.3.3. Other End Users
- 8.1. Market Analysis, Insights and Forecast - by Product and Services
- 9. Asia Pacific Protein Characterization And Quantification Market Analysis, Insights and Forecast, 2020-2032
- 9.1. Market Analysis, Insights and Forecast - by Product and Services
- 9.1.1. Consumables
- 9.1.2. Instruments
- 9.1.2.1. Mass Spectrometry Instruments
- 9.1.2.2. Chromatography Instruments
- 9.1.2.3. Electrophoresis Instruments
- 9.1.2.4. Label-free Detection Instruments
- 9.1.2.5. Spectroscopy Instruments
- 9.1.2.6. Other Instruments
- 9.2. Market Analysis, Insights and Forecast - by Application
- 9.2.1. Drug Discovery & Development
- 9.2.2. Clinical Diagnosis
- 9.2.3. Other Applications
- 9.3. Market Analysis, Insights and Forecast - by End User
- 9.3.1. Biotechnology & Pharmaceutical Companies
- 9.3.2. Contract Research Organization
- 9.3.3. Other End Users
- 9.1. Market Analysis, Insights and Forecast - by Product and Services
- 10. Middle East and Africa Protein Characterization And Quantification Market Analysis, Insights and Forecast, 2020-2032
- 10.1. Market Analysis, Insights and Forecast - by Product and Services
- 10.1.1. Consumables
- 10.1.2. Instruments
- 10.1.2.1. Mass Spectrometry Instruments
- 10.1.2.2. Chromatography Instruments
- 10.1.2.3. Electrophoresis Instruments
- 10.1.2.4. Label-free Detection Instruments
- 10.1.2.5. Spectroscopy Instruments
- 10.1.2.6. Other Instruments
- 10.2. Market Analysis, Insights and Forecast - by Application
- 10.2.1. Drug Discovery & Development
- 10.2.2. Clinical Diagnosis
- 10.2.3. Other Applications
- 10.3. Market Analysis, Insights and Forecast - by End User
- 10.3.1. Biotechnology & Pharmaceutical Companies
- 10.3.2. Contract Research Organization
- 10.3.3. Other End Users
- 10.1. Market Analysis, Insights and Forecast - by Product and Services
- 11. South America Protein Characterization And Quantification Market Analysis, Insights and Forecast, 2020-2032
- 11.1. Market Analysis, Insights and Forecast - by Product and Services
- 11.1.1. Consumables
- 11.1.2. Instruments
- 11.1.2.1. Mass Spectrometry Instruments
- 11.1.2.2. Chromatography Instruments
- 11.1.2.3. Electrophoresis Instruments
- 11.1.2.4. Label-free Detection Instruments
- 11.1.2.5. Spectroscopy Instruments
- 11.1.2.6. Other Instruments
- 11.2. Market Analysis, Insights and Forecast - by Application
- 11.2.1. Drug Discovery & Development
- 11.2.2. Clinical Diagnosis
- 11.2.3. Other Applications
- 11.3. Market Analysis, Insights and Forecast - by End User
- 11.3.1. Biotechnology & Pharmaceutical Companies
- 11.3.2. Contract Research Organization
- 11.3.3. Other End Users
- 11.1. Market Analysis, Insights and Forecast - by Product and Services
- 12. Competitive Analysis
- 12.1. Company Profiles
- 12.1.1 RayBiotech Inc
- 12.1.1.1. Company Overview
- 12.1.1.2. Products
- 12.1.1.3. Company Financials
- 12.1.1.4. SWOT Analysis
- 12.1.2 Promega Corporation
- 12.1.2.1. Company Overview
- 12.1.2.2. Products
- 12.1.2.3. Company Financials
- 12.1.2.4. SWOT Analysis
- 12.1.3 Merck KGaA
- 12.1.3.1. Company Overview
- 12.1.3.2. Products
- 12.1.3.3. Company Financials
- 12.1.3.4. SWOT Analysis
- 12.1.4 Waters Corporation
- 12.1.4.1. Company Overview
- 12.1.4.2. Products
- 12.1.4.3. Company Financials
- 12.1.4.4. SWOT Analysis
- 12.1.5 MS Bioworks
- 12.1.5.1. Company Overview
- 12.1.5.2. Products
- 12.1.5.3. Company Financials
- 12.1.5.4. SWOT Analysis
- 12.1.6 Sartorius AG
- 12.1.6.1. Company Overview
- 12.1.6.2. Products
- 12.1.6.3. Company Financials
- 12.1.6.4. SWOT Analysis
- 12.1.7 QIAGEN N V
- 12.1.7.1. Company Overview
- 12.1.7.2. Products
- 12.1.7.3. Company Financials
- 12.1.7.4. SWOT Analysis
- 12.1.8 Shimadzu Corporation
- 12.1.8.1. Company Overview
- 12.1.8.2. Products
- 12.1.8.3. Company Financials
- 12.1.8.4. SWOT Analysis
- 12.1.9 VProteomics
- 12.1.9.1. Company Overview
- 12.1.9.2. Products
- 12.1.9.3. Company Financials
- 12.1.9.4. SWOT Analysis
- 12.1.10 Creative Proteomics
- 12.1.10.1. Company Overview
- 12.1.10.2. Products
- 12.1.10.3. Company Financials
- 12.1.10.4. SWOT Analysis
- 12.1.11 Thermo Fisher Scientific
- 12.1.11.1. Company Overview
- 12.1.11.2. Products
- 12.1.11.3. Company Financials
- 12.1.11.4. SWOT Analysis
- 12.1.12 Agilent Technologies
- 12.1.12.1. Company Overview
- 12.1.12.2. Products
- 12.1.12.3. Company Financials
- 12.1.12.4. SWOT Analysis
- 12.1.13 HORIBA Ltd
- 12.1.13.1. Company Overview
- 12.1.13.2. Products
- 12.1.13.3. Company Financials
- 12.1.13.4. SWOT Analysis
- 12.1.1 RayBiotech Inc
- 12.2. Market Entropy
- 12.2.1 Company's Key Areas Served
- 12.2.2 Recent Developments
- 12.3. Company Market Share Analysis 2025
- 12.3.1 Top 5 Companies Market Share Analysis
- 12.3.2 Top 3 Companies Market Share Analysis
- 12.4. List of Potential Customers
- 13. Research Methodology
List of Figures
- Figure 1: Global Protein Characterization And Quantification Market Revenue Breakdown (billion, %) by Region 2025 & 2033
- Figure 2: Global Protein Characterization And Quantification Market Volume Breakdown (K Unit, %) by Region 2025 & 2033
- Figure 3: North America Protein Characterization And Quantification Market Revenue (billion), by Product and Services 2025 & 2033
- Figure 4: North America Protein Characterization And Quantification Market Volume (K Unit), by Product and Services 2025 & 2033
- Figure 5: North America Protein Characterization And Quantification Market Revenue Share (%), by Product and Services 2025 & 2033
- Figure 6: North America Protein Characterization And Quantification Market Volume Share (%), by Product and Services 2025 & 2033
- Figure 7: North America Protein Characterization And Quantification Market Revenue (billion), by Application 2025 & 2033
- Figure 8: North America Protein Characterization And Quantification Market Volume (K Unit), by Application 2025 & 2033
- Figure 9: North America Protein Characterization And Quantification Market Revenue Share (%), by Application 2025 & 2033
- Figure 10: North America Protein Characterization And Quantification Market Volume Share (%), by Application 2025 & 2033
- Figure 11: North America Protein Characterization And Quantification Market Revenue (billion), by End User 2025 & 2033
- Figure 12: North America Protein Characterization And Quantification Market Volume (K Unit), by End User 2025 & 2033
- Figure 13: North America Protein Characterization And Quantification Market Revenue Share (%), by End User 2025 & 2033
- Figure 14: North America Protein Characterization And Quantification Market Volume Share (%), by End User 2025 & 2033
- Figure 15: North America Protein Characterization And Quantification Market Revenue (billion), by Country 2025 & 2033
- Figure 16: North America Protein Characterization And Quantification Market Volume (K Unit), by Country 2025 & 2033
- Figure 17: North America Protein Characterization And Quantification Market Revenue Share (%), by Country 2025 & 2033
- Figure 18: North America Protein Characterization And Quantification Market Volume Share (%), by Country 2025 & 2033
- Figure 19: Europe Protein Characterization And Quantification Market Revenue (billion), by Product and Services 2025 & 2033
- Figure 20: Europe Protein Characterization And Quantification Market Volume (K Unit), by Product and Services 2025 & 2033
- Figure 21: Europe Protein Characterization And Quantification Market Revenue Share (%), by Product and Services 2025 & 2033
- Figure 22: Europe Protein Characterization And Quantification Market Volume Share (%), by Product and Services 2025 & 2033
- Figure 23: Europe Protein Characterization And Quantification Market Revenue (billion), by Application 2025 & 2033
- Figure 24: Europe Protein Characterization And Quantification Market Volume (K Unit), by Application 2025 & 2033
- Figure 25: Europe Protein Characterization And Quantification Market Revenue Share (%), by Application 2025 & 2033
- Figure 26: Europe Protein Characterization And Quantification Market Volume Share (%), by Application 2025 & 2033
- Figure 27: Europe Protein Characterization And Quantification Market Revenue (billion), by End User 2025 & 2033
- Figure 28: Europe Protein Characterization And Quantification Market Volume (K Unit), by End User 2025 & 2033
- Figure 29: Europe Protein Characterization And Quantification Market Revenue Share (%), by End User 2025 & 2033
- Figure 30: Europe Protein Characterization And Quantification Market Volume Share (%), by End User 2025 & 2033
- Figure 31: Europe Protein Characterization And Quantification Market Revenue (billion), by Country 2025 & 2033
- Figure 32: Europe Protein Characterization And Quantification Market Volume (K Unit), by Country 2025 & 2033
- Figure 33: Europe Protein Characterization And Quantification Market Revenue Share (%), by Country 2025 & 2033
- Figure 34: Europe Protein Characterization And Quantification Market Volume Share (%), by Country 2025 & 2033
- Figure 35: Asia Pacific Protein Characterization And Quantification Market Revenue (billion), by Product and Services 2025 & 2033
- Figure 36: Asia Pacific Protein Characterization And Quantification Market Volume (K Unit), by Product and Services 2025 & 2033
- Figure 37: Asia Pacific Protein Characterization And Quantification Market Revenue Share (%), by Product and Services 2025 & 2033
- Figure 38: Asia Pacific Protein Characterization And Quantification Market Volume Share (%), by Product and Services 2025 & 2033
- Figure 39: Asia Pacific Protein Characterization And Quantification Market Revenue (billion), by Application 2025 & 2033
- Figure 40: Asia Pacific Protein Characterization And Quantification Market Volume (K Unit), by Application 2025 & 2033
- Figure 41: Asia Pacific Protein Characterization And Quantification Market Revenue Share (%), by Application 2025 & 2033
- Figure 42: Asia Pacific Protein Characterization And Quantification Market Volume Share (%), by Application 2025 & 2033
- Figure 43: Asia Pacific Protein Characterization And Quantification Market Revenue (billion), by End User 2025 & 2033
- Figure 44: Asia Pacific Protein Characterization And Quantification Market Volume (K Unit), by End User 2025 & 2033
- Figure 45: Asia Pacific Protein Characterization And Quantification Market Revenue Share (%), by End User 2025 & 2033
- Figure 46: Asia Pacific Protein Characterization And Quantification Market Volume Share (%), by End User 2025 & 2033
- Figure 47: Asia Pacific Protein Characterization And Quantification Market Revenue (billion), by Country 2025 & 2033
- Figure 48: Asia Pacific Protein Characterization And Quantification Market Volume (K Unit), by Country 2025 & 2033
- Figure 49: Asia Pacific Protein Characterization And Quantification Market Revenue Share (%), by Country 2025 & 2033
- Figure 50: Asia Pacific Protein Characterization And Quantification Market Volume Share (%), by Country 2025 & 2033
- Figure 51: Middle East and Africa Protein Characterization And Quantification Market Revenue (billion), by Product and Services 2025 & 2033
- Figure 52: Middle East and Africa Protein Characterization And Quantification Market Volume (K Unit), by Product and Services 2025 & 2033
- Figure 53: Middle East and Africa Protein Characterization And Quantification Market Revenue Share (%), by Product and Services 2025 & 2033
- Figure 54: Middle East and Africa Protein Characterization And Quantification Market Volume Share (%), by Product and Services 2025 & 2033
- Figure 55: Middle East and Africa Protein Characterization And Quantification Market Revenue (billion), by Application 2025 & 2033
- Figure 56: Middle East and Africa Protein Characterization And Quantification Market Volume (K Unit), by Application 2025 & 2033
- Figure 57: Middle East and Africa Protein Characterization And Quantification Market Revenue Share (%), by Application 2025 & 2033
- Figure 58: Middle East and Africa Protein Characterization And Quantification Market Volume Share (%), by Application 2025 & 2033
- Figure 59: Middle East and Africa Protein Characterization And Quantification Market Revenue (billion), by End User 2025 & 2033
- Figure 60: Middle East and Africa Protein Characterization And Quantification Market Volume (K Unit), by End User 2025 & 2033
- Figure 61: Middle East and Africa Protein Characterization And Quantification Market Revenue Share (%), by End User 2025 & 2033
- Figure 62: Middle East and Africa Protein Characterization And Quantification Market Volume Share (%), by End User 2025 & 2033
- Figure 63: Middle East and Africa Protein Characterization And Quantification Market Revenue (billion), by Country 2025 & 2033
- Figure 64: Middle East and Africa Protein Characterization And Quantification Market Volume (K Unit), by Country 2025 & 2033
- Figure 65: Middle East and Africa Protein Characterization And Quantification Market Revenue Share (%), by Country 2025 & 2033
- Figure 66: Middle East and Africa Protein Characterization And Quantification Market Volume Share (%), by Country 2025 & 2033
- Figure 67: South America Protein Characterization And Quantification Market Revenue (billion), by Product and Services 2025 & 2033
- Figure 68: South America Protein Characterization And Quantification Market Volume (K Unit), by Product and Services 2025 & 2033
- Figure 69: South America Protein Characterization And Quantification Market Revenue Share (%), by Product and Services 2025 & 2033
- Figure 70: South America Protein Characterization And Quantification Market Volume Share (%), by Product and Services 2025 & 2033
- Figure 71: South America Protein Characterization And Quantification Market Revenue (billion), by Application 2025 & 2033
- Figure 72: South America Protein Characterization And Quantification Market Volume (K Unit), by Application 2025 & 2033
- Figure 73: South America Protein Characterization And Quantification Market Revenue Share (%), by Application 2025 & 2033
- Figure 74: South America Protein Characterization And Quantification Market Volume Share (%), by Application 2025 & 2033
- Figure 75: South America Protein Characterization And Quantification Market Revenue (billion), by End User 2025 & 2033
- Figure 76: South America Protein Characterization And Quantification Market Volume (K Unit), by End User 2025 & 2033
- Figure 77: South America Protein Characterization And Quantification Market Revenue Share (%), by End User 2025 & 2033
- Figure 78: South America Protein Characterization And Quantification Market Volume Share (%), by End User 2025 & 2033
- Figure 79: South America Protein Characterization And Quantification Market Revenue (billion), by Country 2025 & 2033
- Figure 80: South America Protein Characterization And Quantification Market Volume (K Unit), by Country 2025 & 2033
- Figure 81: South America Protein Characterization And Quantification Market Revenue Share (%), by Country 2025 & 2033
- Figure 82: South America Protein Characterization And Quantification Market Volume Share (%), by Country 2025 & 2033
List of Tables
- Table 1: Global Protein Characterization And Quantification Market Revenue billion Forecast, by Product and Services 2020 & 2033
- Table 2: Global Protein Characterization And Quantification Market Volume K Unit Forecast, by Product and Services 2020 & 2033
- Table 3: Global Protein Characterization And Quantification Market Revenue billion Forecast, by Application 2020 & 2033
- Table 4: Global Protein Characterization And Quantification Market Volume K Unit Forecast, by Application 2020 & 2033
- Table 5: Global Protein Characterization And Quantification Market Revenue billion Forecast, by End User 2020 & 2033
- Table 6: Global Protein Characterization And Quantification Market Volume K Unit Forecast, by End User 2020 & 2033
- Table 7: Global Protein Characterization And Quantification Market Revenue billion Forecast, by Region 2020 & 2033
- Table 8: Global Protein Characterization And Quantification Market Volume K Unit Forecast, by Region 2020 & 2033
- Table 9: Global Protein Characterization And Quantification Market Revenue billion Forecast, by Product and Services 2020 & 2033
- Table 10: Global Protein Characterization And Quantification Market Volume K Unit Forecast, by Product and Services 2020 & 2033
- Table 11: Global Protein Characterization And Quantification Market Revenue billion Forecast, by Application 2020 & 2033
- Table 12: Global Protein Characterization And Quantification Market Volume K Unit Forecast, by Application 2020 & 2033
- Table 13: Global Protein Characterization And Quantification Market Revenue billion Forecast, by End User 2020 & 2033
- Table 14: Global Protein Characterization And Quantification Market Volume K Unit Forecast, by End User 2020 & 2033
- Table 15: Global Protein Characterization And Quantification Market Revenue billion Forecast, by Country 2020 & 2033
- Table 16: Global Protein Characterization And Quantification Market Volume K Unit Forecast, by Country 2020 & 2033
- Table 17: United States Protein Characterization And Quantification Market Revenue (billion) Forecast, by Application 2020 & 2033
- Table 18: United States Protein Characterization And Quantification Market Volume (K Unit) Forecast, by Application 2020 & 2033
- Table 19: Canada Protein Characterization And Quantification Market Revenue (billion) Forecast, by Application 2020 & 2033
- Table 20: Canada Protein Characterization And Quantification Market Volume (K Unit) Forecast, by Application 2020 & 2033
- Table 21: Mexico Protein Characterization And Quantification Market Revenue (billion) Forecast, by Application 2020 & 2033
- Table 22: Mexico Protein Characterization And Quantification Market Volume (K Unit) Forecast, by Application 2020 & 2033
- Table 23: Global Protein Characterization And Quantification Market Revenue billion Forecast, by Product and Services 2020 & 2033
- Table 24: Global Protein Characterization And Quantification Market Volume K Unit Forecast, by Product and Services 2020 & 2033
- Table 25: Global Protein Characterization And Quantification Market Revenue billion Forecast, by Application 2020 & 2033
- Table 26: Global Protein Characterization And Quantification Market Volume K Unit Forecast, by Application 2020 & 2033
- Table 27: Global Protein Characterization And Quantification Market Revenue billion Forecast, by End User 2020 & 2033
- Table 28: Global Protein Characterization And Quantification Market Volume K Unit Forecast, by End User 2020 & 2033
- Table 29: Global Protein Characterization And Quantification Market Revenue billion Forecast, by Country 2020 & 2033
- Table 30: Global Protein Characterization And Quantification Market Volume K Unit Forecast, by Country 2020 & 2033
- Table 31: Germany Protein Characterization And Quantification Market Revenue (billion) Forecast, by Application 2020 & 2033
- Table 32: Germany Protein Characterization And Quantification Market Volume (K Unit) Forecast, by Application 2020 & 2033
- Table 33: United Kingdom Protein Characterization And Quantification Market Revenue (billion) Forecast, by Application 2020 & 2033
- Table 34: United Kingdom Protein Characterization And Quantification Market Volume (K Unit) Forecast, by Application 2020 & 2033
- Table 35: France Protein Characterization And Quantification Market Revenue (billion) Forecast, by Application 2020 & 2033
- Table 36: France Protein Characterization And Quantification Market Volume (K Unit) Forecast, by Application 2020 & 2033
- Table 37: Italy Protein Characterization And Quantification Market Revenue (billion) Forecast, by Application 2020 & 2033
- Table 38: Italy Protein Characterization And Quantification Market Volume (K Unit) Forecast, by Application 2020 & 2033
- Table 39: Spain Protein Characterization And Quantification Market Revenue (billion) Forecast, by Application 2020 & 2033
- Table 40: Spain Protein Characterization And Quantification Market Volume (K Unit) Forecast, by Application 2020 & 2033
- Table 41: Rest of Europe Protein Characterization And Quantification Market Revenue (billion) Forecast, by Application 2020 & 2033
- Table 42: Rest of Europe Protein Characterization And Quantification Market Volume (K Unit) Forecast, by Application 2020 & 2033
- Table 43: Global Protein Characterization And Quantification Market Revenue billion Forecast, by Product and Services 2020 & 2033
- Table 44: Global Protein Characterization And Quantification Market Volume K Unit Forecast, by Product and Services 2020 & 2033
- Table 45: Global Protein Characterization And Quantification Market Revenue billion Forecast, by Application 2020 & 2033
- Table 46: Global Protein Characterization And Quantification Market Volume K Unit Forecast, by Application 2020 & 2033
- Table 47: Global Protein Characterization And Quantification Market Revenue billion Forecast, by End User 2020 & 2033
- Table 48: Global Protein Characterization And Quantification Market Volume K Unit Forecast, by End User 2020 & 2033
- Table 49: Global Protein Characterization And Quantification Market Revenue billion Forecast, by Country 2020 & 2033
- Table 50: Global Protein Characterization And Quantification Market Volume K Unit Forecast, by Country 2020 & 2033
- Table 51: China Protein Characterization And Quantification Market Revenue (billion) Forecast, by Application 2020 & 2033
- Table 52: China Protein Characterization And Quantification Market Volume (K Unit) Forecast, by Application 2020 & 2033
- Table 53: Japan Protein Characterization And Quantification Market Revenue (billion) Forecast, by Application 2020 & 2033
- Table 54: Japan Protein Characterization And Quantification Market Volume (K Unit) Forecast, by Application 2020 & 2033
- Table 55: India Protein Characterization And Quantification Market Revenue (billion) Forecast, by Application 2020 & 2033
- Table 56: India Protein Characterization And Quantification Market Volume (K Unit) Forecast, by Application 2020 & 2033
- Table 57: Australia Protein Characterization And Quantification Market Revenue (billion) Forecast, by Application 2020 & 2033
- Table 58: Australia Protein Characterization And Quantification Market Volume (K Unit) Forecast, by Application 2020 & 2033
- Table 59: South Korea Protein Characterization And Quantification Market Revenue (billion) Forecast, by Application 2020 & 2033
- Table 60: South Korea Protein Characterization And Quantification Market Volume (K Unit) Forecast, by Application 2020 & 2033
- Table 61: Rest of Asia Pacific Protein Characterization And Quantification Market Revenue (billion) Forecast, by Application 2020 & 2033
- Table 62: Rest of Asia Pacific Protein Characterization And Quantification Market Volume (K Unit) Forecast, by Application 2020 & 2033
- Table 63: Global Protein Characterization And Quantification Market Revenue billion Forecast, by Product and Services 2020 & 2033
- Table 64: Global Protein Characterization And Quantification Market Volume K Unit Forecast, by Product and Services 2020 & 2033
- Table 65: Global Protein Characterization And Quantification Market Revenue billion Forecast, by Application 2020 & 2033
- Table 66: Global Protein Characterization And Quantification Market Volume K Unit Forecast, by Application 2020 & 2033
- Table 67: Global Protein Characterization And Quantification Market Revenue billion Forecast, by End User 2020 & 2033
- Table 68: Global Protein Characterization And Quantification Market Volume K Unit Forecast, by End User 2020 & 2033
- Table 69: Global Protein Characterization And Quantification Market Revenue billion Forecast, by Country 2020 & 2033
- Table 70: Global Protein Characterization And Quantification Market Volume K Unit Forecast, by Country 2020 & 2033
- Table 71: GCC Protein Characterization And Quantification Market Revenue (billion) Forecast, by Application 2020 & 2033
- Table 72: GCC Protein Characterization And Quantification Market Volume (K Unit) Forecast, by Application 2020 & 2033
- Table 73: South Africa Protein Characterization And Quantification Market Revenue (billion) Forecast, by Application 2020 & 2033
- Table 74: South Africa Protein Characterization And Quantification Market Volume (K Unit) Forecast, by Application 2020 & 2033
- Table 75: Rest of Middle East and Africa Protein Characterization And Quantification Market Revenue (billion) Forecast, by Application 2020 & 2033
- Table 76: Rest of Middle East and Africa Protein Characterization And Quantification Market Volume (K Unit) Forecast, by Application 2020 & 2033
- Table 77: Global Protein Characterization And Quantification Market Revenue billion Forecast, by Product and Services 2020 & 2033
- Table 78: Global Protein Characterization And Quantification Market Volume K Unit Forecast, by Product and Services 2020 & 2033
- Table 79: Global Protein Characterization And Quantification Market Revenue billion Forecast, by Application 2020 & 2033
- Table 80: Global Protein Characterization And Quantification Market Volume K Unit Forecast, by Application 2020 & 2033
- Table 81: Global Protein Characterization And Quantification Market Revenue billion Forecast, by End User 2020 & 2033
- Table 82: Global Protein Characterization And Quantification Market Volume K Unit Forecast, by End User 2020 & 2033
- Table 83: Global Protein Characterization And Quantification Market Revenue billion Forecast, by Country 2020 & 2033
- Table 84: Global Protein Characterization And Quantification Market Volume K Unit Forecast, by Country 2020 & 2033
- Table 85: Brazil Protein Characterization And Quantification Market Revenue (billion) Forecast, by Application 2020 & 2033
- Table 86: Brazil Protein Characterization And Quantification Market Volume (K Unit) Forecast, by Application 2020 & 2033
- Table 87: Argentina Protein Characterization And Quantification Market Revenue (billion) Forecast, by Application 2020 & 2033
- Table 88: Argentina Protein Characterization And Quantification Market Volume (K Unit) Forecast, by Application 2020 & 2033
- Table 89: Rest of South America Protein Characterization And Quantification Market Revenue (billion) Forecast, by Application 2020 & 2033
- Table 90: Rest of South America Protein Characterization And Quantification Market Volume (K Unit) Forecast, by Application 2020 & 2033
Frequently Asked Questions
1. What is the projected Compound Annual Growth Rate (CAGR) of the Protein Characterization And Quantification Market?
The projected CAGR is approximately 9%.
2. Which companies are prominent players in the Protein Characterization And Quantification Market?
Key companies in the market include RayBiotech Inc, Promega Corporation, Merck KGaA, Waters Corporation, MS Bioworks, Sartorius AG, QIAGEN N V, Shimadzu Corporation, VProteomics, Creative Proteomics, Thermo Fisher Scientific, Agilent Technologies, HORIBA Ltd.
3. What are the main segments of the Protein Characterization And Quantification Market?
The market segments include Product and Services, Application, End User.
4. Can you provide details about the market size?
The market size is estimated to be USD 2.49 billion as of 2022.
5. What are some drivers contributing to market growth?
Increasing Adoption of Biologics; Increasing R&D Expenditure and Government Funding for Proteomics; Technological Advancements in Protein Characterization and Quantitation.
6. What are the notable trends driving market growth?
Mass Spectrometry Instruments Segment is Expected to Witness Significant Growth Over the Forecast Period.
7. Are there any restraints impacting market growth?
High Cost Associated with Instrumentation.
8. Can you provide examples of recent developments in the market?
February 2023: Charles River Laboratories International, Inc. launched its first Enzyme-Linked Immunosorbent Assay (ELISA) Kit. It is to detect and quantify residual host cell proteins (HCP) in CHO-based biotherapeutics.
9. What pricing options are available for accessing the report?
Pricing options include single-user, multi-user, and enterprise licenses priced at USD 4750, USD 5250, and USD 8750 respectively.
10. Is the market size provided in terms of value or volume?
The market size is provided in terms of value, measured in billion and volume, measured in K Unit.
11. Are there any specific market keywords associated with the report?
Yes, the market keyword associated with the report is "Protein Characterization And Quantification Market," which aids in identifying and referencing the specific market segment covered.
12. How do I determine which pricing option suits my needs best?
The pricing options vary based on user requirements and access needs. Individual users may opt for single-user licenses, while businesses requiring broader access may choose multi-user or enterprise licenses for cost-effective access to the report.
13. Are there any additional resources or data provided in the Protein Characterization And Quantification Market report?
While the report offers comprehensive insights, it's advisable to review the specific contents or supplementary materials provided to ascertain if additional resources or data are available.
14. How can I stay updated on further developments or reports in the Protein Characterization And Quantification Market?
To stay informed about further developments, trends, and reports in the Protein Characterization And Quantification Market, consider subscribing to industry newsletters, following relevant companies and organizations, or regularly checking reputable industry news sources and publications.
Methodology
Step 1 - Identification of Relevant Samples Size from Population Database


Step 2 - Approaches for Defining Global Market Size (Value, Volume* & Price*)

Note*: In applicable scenarios
Step 3 - Data Sources
Primary Research
- Web Analytics
- Survey Reports
- Research Institute
- Latest Research Reports
- Opinion Leaders
Secondary Research
- Annual Reports
- White Paper
- Latest Press Release
- Industry Association
- Paid Database
- Investor Presentations

Step 4 - Data Triangulation
Involves using different sources of information in order to increase the validity of a study
These sources are likely to be stakeholders in a program - participants, other researchers, program staff, other community members, and so on.
Then we put all data in single framework & apply various statistical tools to find out the dynamic on the market.
During the analysis stage, feedback from the stakeholder groups would be compared to determine areas of agreement as well as areas of divergence