

Key Insights
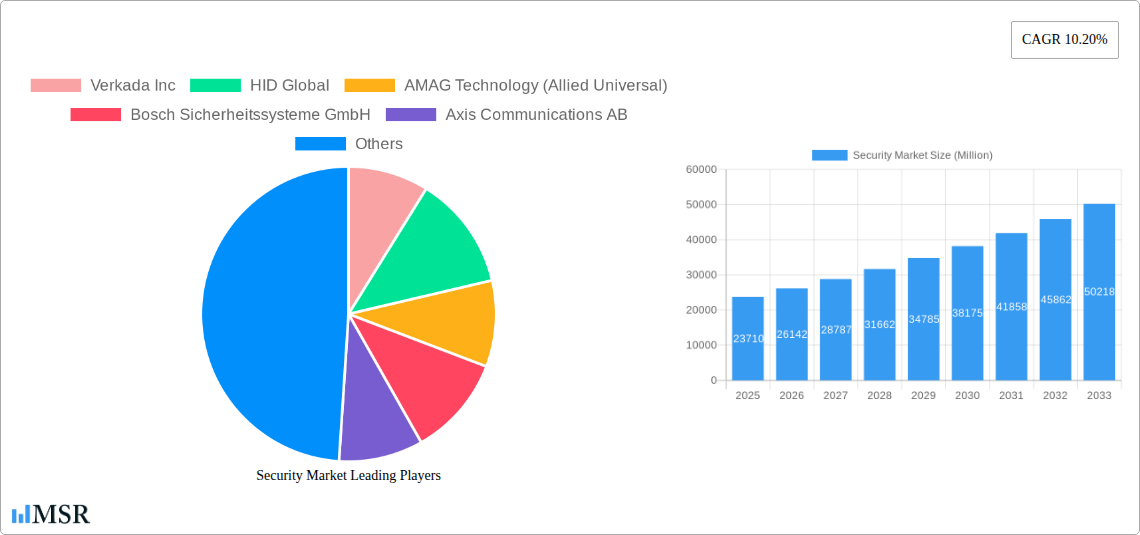
The global security market, valued at $23.71 billion in 2025, is projected to experience robust growth, exhibiting a Compound Annual Growth Rate (CAGR) of 10.20% from 2025 to 2033. This expansion is driven by several key factors. Increasing cyber threats, coupled with rising concerns about physical security in both commercial and residential settings, are fueling demand for advanced security solutions. The adoption of Internet of Things (IoT) devices and the proliferation of smart cities are further contributing to market growth, as these technologies create new opportunities for integrated security systems. Government regulations mandating enhanced security measures across various sectors, such as healthcare and finance, also significantly impact market expansion. Furthermore, the ongoing technological advancements in areas like artificial intelligence (AI), machine learning (ML), and cloud computing are enabling the development of more sophisticated and effective security systems, further stimulating market growth.
Key players in the market, including Verkada Inc, HID Global, AMAG Technology, and others, are continuously innovating to meet the evolving needs of consumers and businesses. The market is segmented by solution type (e.g., video surveillance, access control, intrusion detection), deployment type (cloud, on-premise), and end-user (residential, commercial, government). While the market faces certain restraints like high initial investment costs for advanced systems and concerns around data privacy, the overall growth trajectory remains positive, driven by the aforementioned factors. The market is geographically diverse, with North America and Europe likely holding significant market share due to higher adoption rates of advanced technologies and stringent security regulations. Future growth will likely be influenced by the pace of technological innovation, the evolving regulatory landscape, and the global economic climate.
Security Market Report: 2019-2033 – A Comprehensive Analysis of Growth, Innovation, and Key Players
This in-depth report provides a comprehensive analysis of the Security Market, projecting a robust growth trajectory from 2025 to 2033. The study covers market dynamics, industry trends, key players, emerging opportunities, and challenges, providing actionable insights for stakeholders across the security sector. With a detailed analysis spanning the historical period (2019-2024), base year (2025), and forecast period (2025-2033), this report is an indispensable resource for strategic decision-making. The global market size is projected to reach xx Million by 2033, exhibiting a CAGR of xx%.
Security Market Market Concentration & Dynamics
The Security Market exhibits a moderately concentrated landscape, with several major players holding significant market share. The top five companies – Honeywell International Inc, Johnson Controls, ADT Inc, Securitas Technology, and Assa Abloy Group – collectively account for an estimated xx% of the global market in 2025. However, the market is witnessing increased competition from smaller, specialized firms focusing on niche technologies.
- Market Share: Honeywell International Inc (xx%), Johnson Controls (xx%), ADT Inc (xx%), Securitas Technology (xx%), Assa Abloy Group (xx%), others (xx%).
- Innovation Ecosystems: Significant innovation is driven by advancements in AI, IoT, and cloud computing, fostering the development of smart security solutions.
- Regulatory Frameworks: Evolving data privacy regulations and cybersecurity standards influence product development and market adoption.
- Substitute Products: While traditional security systems remain prevalent, the market is experiencing a shift towards integrated and intelligent systems, posing a challenge to traditional players.
- End-User Trends: Increasing demand for integrated security solutions, remote monitoring capabilities, and proactive threat detection is shaping market growth.
- M&A Activities: An estimated xx M&A deals occurred between 2019 and 2024, indicating a high level of consolidation and strategic partnerships in the industry.
Security Market Industry Insights & Trends
The Security Market is experiencing significant growth, fueled by rising cybersecurity threats, increasing adoption of smart technologies, and growing awareness of security risks across various sectors. The market size is estimated at xx Million in 2025 and is projected to reach xx Million by 2033. Several factors drive this expansion:
- Technological Disruptions: The integration of AI, IoT, and cloud technologies is revolutionizing security solutions, enhancing their capabilities and efficiency. The rise of AI-powered threat detection and predictive analytics is a significant trend.
- Evolving Consumer Behaviors: Increased reliance on digital platforms and connected devices fuels the demand for comprehensive security solutions, including identity management and data protection. Consumers are increasingly seeking integrated and user-friendly systems.
- Market Growth Drivers: Government investments in security infrastructure, rising adoption of smart home and building technologies, and increasing demand for advanced surveillance systems are key drivers of market expansion.

Key Markets & Segments Leading Security Market
The North American region dominates the Security Market, driven by robust economic growth, substantial investments in security infrastructure, and high adoption of advanced security technologies. Strong government regulations and high awareness of cybersecurity threats further propel market growth in this region.
- Dominant Region: North America
- Key Drivers (North America): High disposable income, robust economic growth, stringent security regulations, increased adoption of smart technologies in both residential and commercial sectors.
- Dominance Analysis: The region's mature market, advanced technological infrastructure, and high adoption rates for smart security systems contribute to its leading position. Furthermore, government initiatives to strengthen national security and cybersecurity further fuel market growth.
Security Market Product Developments
Recent years have witnessed the introduction of innovative security products, including AI-powered video analytics, integrated access control systems, and advanced threat detection platforms. These advancements provide enhanced security capabilities and streamline operations for businesses and consumers alike. The integration of these technologies into existing systems offers significant competitive advantages.
Challenges in the Security Market Market
The Security Market faces several challenges: Stringent regulatory compliance requirements, particularly around data privacy and cybersecurity, pose significant hurdles. Supply chain disruptions and fluctuating raw material costs affect production and profitability. Intense competition, particularly from smaller, agile companies specializing in specific technologies, also creates pressure. The combined effect of these issues is estimated to reduce market growth by approximately xx% in 2025.
Forces Driving Security Market Growth
Several key factors drive growth: Advancements in AI, IoT, and cloud computing are enabling the development of sophisticated security solutions. Increased cybersecurity threats and data breaches are pushing organizations to adopt robust security measures. Government initiatives promoting cybersecurity and data protection are further boosting market expansion. The growing adoption of smart homes and buildings also contributes significantly to growth.
Challenges in the Security Market Market (Long-Term Growth Catalysts)
Long-term growth will be driven by continued innovation in areas such as predictive analytics, behavioral biometrics, and quantum-resistant cryptography. Strategic partnerships between technology providers and security integrators will play a crucial role in expanding market reach and delivering comprehensive solutions. Furthermore, the expansion of the market into developing economies presents significant long-term growth opportunities.
Emerging Opportunities in Security Market
The market presents several opportunities. The growing demand for cybersecurity solutions in critical infrastructure sectors, such as energy and healthcare, offers significant potential. The development of integrated security platforms combining physical and cybersecurity measures creates considerable room for growth. The rise of edge computing will enhance real-time threat detection and response capabilities, leading to new product opportunities.
Leading Players in the Security Market Sector
- Verkada Inc
- HID Global
- AMAG Technology (Allied Universal)
- Bosch Sicherheitssysteme GmbH
- Axis Communications AB
- Honeywell International Inc
- Johnson Controls
- ADT Inc
- Securitas Technology
- Assa Abloy Group
- Genetec Inc
- Palo Alto Networks
- Fortinet Inc
- IBM Corporation
- Cisco Systems Inc
Key Milestones in Security Market Industry
- August 2024: Alfred International launched its patented Alfred ML2 Smart Mortise Lock with Z-Wave Long Range, expanding the smart lock market.
- May 2024: Palo Alto Networks partnered with IBM to deliver AI-driven security solutions, highlighting the growing importance of AI in cybersecurity.
Strategic Outlook for Security Market Market
The Security Market is poised for significant growth driven by technological advancements, evolving consumer demands, and a growing awareness of security risks. Companies focusing on innovation, strategic partnerships, and expansion into new markets are well-positioned to capitalize on the market's considerable potential. The convergence of physical and cybersecurity solutions will be a key driver of future market expansion.
Security Market Segmentation
-
1. Security Type
-
1.1. Physical Security
- 1.1.1. Access Control
- 1.1.2. Video Surveillance
- 1.1.3. Intrusion Detection
- 1.1.4. Perimeter Security
-
1.2. Cyber Security
- 1.2.1. Network Security
- 1.2.2. End Point Security
- 1.2.3. Application Security
- 1.2.4. Cloud Security
- 1.2.5. Information Security
-
1.1. Physical Security
-
2. End-user Vertical
- 2.1. Government and Public Sector
- 2.2. Commercial
- 2.3. Industrial
- 2.4. Residential
- 2.5. Healthcare
- 2.6. Education
- 2.7. Critical Infrastructure
-
3. Solution Type
- 3.1. Hardware
- 3.2. Software
- 3.3. Services
-
4. Deployment Type
- 4.1. On-premise
- 4.2. Cloud-based
Security Market Segmentation By Geography
- 1. North America
- 2. Europe
- 3. Asia
- 4. Australia and New Zealand
- 5. Latin America
- 6. Middle East and Africa

Security Market REPORT HIGHLIGHTS
| Aspects | Details |
|---|---|
| Study Period | 2019-2033 |
| Base Year | 2024 |
| Estimated Year | 2025 |
| Forecast Period | 2025-2033 |
| Historical Period | 2019-2024 |
| Growth Rate | CAGR of 10.20% from 2019-2033 |
| Segmentation |
|
Table of Contents
- 1. Introduction
- 1.1. Research Scope
- 1.2. Market Segmentation
- 1.3. Research Methodology
- 1.4. Definitions and Assumptions
- 2. Executive Summary
- 2.1. Introduction
- 3. Market Dynamics
- 3.1. Introduction
- 3.2. Market Drivers
- 3.2.1. Increasing Cyber Threats; Growth in IoT Devices
- 3.3. Market Restrains
- 3.3.1. Increasing Cyber Threats; Growth in IoT Devices
- 3.4. Market Trends
- 3.4.1. Commercial Sector Witnessing Demand
- 4. Market Factor Analysis
- 4.1. Porters Five Forces
- 4.2. Supply/Value Chain
- 4.3. PESTEL analysis
- 4.4. Market Entropy
- 4.5. Patent/Trademark Analysis
- 5. Global Security Market Analysis, Insights and Forecast, 2019-2031
- 5.1. Market Analysis, Insights and Forecast - by Security Type
- 5.1.1. Physical Security
- 5.1.1.1. Access Control
- 5.1.1.2. Video Surveillance
- 5.1.1.3. Intrusion Detection
- 5.1.1.4. Perimeter Security
- 5.1.2. Cyber Security
- 5.1.2.1. Network Security
- 5.1.2.2. End Point Security
- 5.1.2.3. Application Security
- 5.1.2.4. Cloud Security
- 5.1.2.5. Information Security
- 5.1.1. Physical Security
- 5.2. Market Analysis, Insights and Forecast - by End-user Vertical
- 5.2.1. Government and Public Sector
- 5.2.2. Commercial
- 5.2.3. Industrial
- 5.2.4. Residential
- 5.2.5. Healthcare
- 5.2.6. Education
- 5.2.7. Critical Infrastructure
- 5.3. Market Analysis, Insights and Forecast - by Solution Type
- 5.3.1. Hardware
- 5.3.2. Software
- 5.3.3. Services
- 5.4. Market Analysis, Insights and Forecast - by Deployment Type
- 5.4.1. On-premise
- 5.4.2. Cloud-based
- 5.5. Market Analysis, Insights and Forecast - by Region
- 5.5.1. North America
- 5.5.2. Europe
- 5.5.3. Asia
- 5.5.4. Australia and New Zealand
- 5.5.5. Latin America
- 5.5.6. Middle East and Africa
- 5.1. Market Analysis, Insights and Forecast - by Security Type
- 6. North America Security Market Analysis, Insights and Forecast, 2019-2031
- 6.1. Market Analysis, Insights and Forecast - by Security Type
- 6.1.1. Physical Security
- 6.1.1.1. Access Control
- 6.1.1.2. Video Surveillance
- 6.1.1.3. Intrusion Detection
- 6.1.1.4. Perimeter Security
- 6.1.2. Cyber Security
- 6.1.2.1. Network Security
- 6.1.2.2. End Point Security
- 6.1.2.3. Application Security
- 6.1.2.4. Cloud Security
- 6.1.2.5. Information Security
- 6.1.1. Physical Security
- 6.2. Market Analysis, Insights and Forecast - by End-user Vertical
- 6.2.1. Government and Public Sector
- 6.2.2. Commercial
- 6.2.3. Industrial
- 6.2.4. Residential
- 6.2.5. Healthcare
- 6.2.6. Education
- 6.2.7. Critical Infrastructure
- 6.3. Market Analysis, Insights and Forecast - by Solution Type
- 6.3.1. Hardware
- 6.3.2. Software
- 6.3.3. Services
- 6.4. Market Analysis, Insights and Forecast - by Deployment Type
- 6.4.1. On-premise
- 6.4.2. Cloud-based
- 6.1. Market Analysis, Insights and Forecast - by Security Type
- 7. Europe Security Market Analysis, Insights and Forecast, 2019-2031
- 7.1. Market Analysis, Insights and Forecast - by Security Type
- 7.1.1. Physical Security
- 7.1.1.1. Access Control
- 7.1.1.2. Video Surveillance
- 7.1.1.3. Intrusion Detection
- 7.1.1.4. Perimeter Security
- 7.1.2. Cyber Security
- 7.1.2.1. Network Security
- 7.1.2.2. End Point Security
- 7.1.2.3. Application Security
- 7.1.2.4. Cloud Security
- 7.1.2.5. Information Security
- 7.1.1. Physical Security
- 7.2. Market Analysis, Insights and Forecast - by End-user Vertical
- 7.2.1. Government and Public Sector
- 7.2.2. Commercial
- 7.2.3. Industrial
- 7.2.4. Residential
- 7.2.5. Healthcare
- 7.2.6. Education
- 7.2.7. Critical Infrastructure
- 7.3. Market Analysis, Insights and Forecast - by Solution Type
- 7.3.1. Hardware
- 7.3.2. Software
- 7.3.3. Services
- 7.4. Market Analysis, Insights and Forecast - by Deployment Type
- 7.4.1. On-premise
- 7.4.2. Cloud-based
- 7.1. Market Analysis, Insights and Forecast - by Security Type
- 8. Asia Security Market Analysis, Insights and Forecast, 2019-2031
- 8.1. Market Analysis, Insights and Forecast - by Security Type
- 8.1.1. Physical Security
- 8.1.1.1. Access Control
- 8.1.1.2. Video Surveillance
- 8.1.1.3. Intrusion Detection
- 8.1.1.4. Perimeter Security
- 8.1.2. Cyber Security
- 8.1.2.1. Network Security
- 8.1.2.2. End Point Security
- 8.1.2.3. Application Security
- 8.1.2.4. Cloud Security
- 8.1.2.5. Information Security
- 8.1.1. Physical Security
- 8.2. Market Analysis, Insights and Forecast - by End-user Vertical
- 8.2.1. Government and Public Sector
- 8.2.2. Commercial
- 8.2.3. Industrial
- 8.2.4. Residential
- 8.2.5. Healthcare
- 8.2.6. Education
- 8.2.7. Critical Infrastructure
- 8.3. Market Analysis, Insights and Forecast - by Solution Type
- 8.3.1. Hardware
- 8.3.2. Software
- 8.3.3. Services
- 8.4. Market Analysis, Insights and Forecast - by Deployment Type
- 8.4.1. On-premise
- 8.4.2. Cloud-based
- 8.1. Market Analysis, Insights and Forecast - by Security Type
- 9. Australia and New Zealand Security Market Analysis, Insights and Forecast, 2019-2031
- 9.1. Market Analysis, Insights and Forecast - by Security Type
- 9.1.1. Physical Security
- 9.1.1.1. Access Control
- 9.1.1.2. Video Surveillance
- 9.1.1.3. Intrusion Detection
- 9.1.1.4. Perimeter Security
- 9.1.2. Cyber Security
- 9.1.2.1. Network Security
- 9.1.2.2. End Point Security
- 9.1.2.3. Application Security
- 9.1.2.4. Cloud Security
- 9.1.2.5. Information Security
- 9.1.1. Physical Security
- 9.2. Market Analysis, Insights and Forecast - by End-user Vertical
- 9.2.1. Government and Public Sector
- 9.2.2. Commercial
- 9.2.3. Industrial
- 9.2.4. Residential
- 9.2.5. Healthcare
- 9.2.6. Education
- 9.2.7. Critical Infrastructure
- 9.3. Market Analysis, Insights and Forecast - by Solution Type
- 9.3.1. Hardware
- 9.3.2. Software
- 9.3.3. Services
- 9.4. Market Analysis, Insights and Forecast - by Deployment Type
- 9.4.1. On-premise
- 9.4.2. Cloud-based
- 9.1. Market Analysis, Insights and Forecast - by Security Type
- 10. Latin America Security Market Analysis, Insights and Forecast, 2019-2031
- 10.1. Market Analysis, Insights and Forecast - by Security Type
- 10.1.1. Physical Security
- 10.1.1.1. Access Control
- 10.1.1.2. Video Surveillance
- 10.1.1.3. Intrusion Detection
- 10.1.1.4. Perimeter Security
- 10.1.2. Cyber Security
- 10.1.2.1. Network Security
- 10.1.2.2. End Point Security
- 10.1.2.3. Application Security
- 10.1.2.4. Cloud Security
- 10.1.2.5. Information Security
- 10.1.1. Physical Security
- 10.2. Market Analysis, Insights and Forecast - by End-user Vertical
- 10.2.1. Government and Public Sector
- 10.2.2. Commercial
- 10.2.3. Industrial
- 10.2.4. Residential
- 10.2.5. Healthcare
- 10.2.6. Education
- 10.2.7. Critical Infrastructure
- 10.3. Market Analysis, Insights and Forecast - by Solution Type
- 10.3.1. Hardware
- 10.3.2. Software
- 10.3.3. Services
- 10.4. Market Analysis, Insights and Forecast - by Deployment Type
- 10.4.1. On-premise
- 10.4.2. Cloud-based
- 10.1. Market Analysis, Insights and Forecast - by Security Type
- 11. Middle East and Africa Security Market Analysis, Insights and Forecast, 2019-2031
- 11.1. Market Analysis, Insights and Forecast - by Security Type
- 11.1.1. Physical Security
- 11.1.1.1. Access Control
- 11.1.1.2. Video Surveillance
- 11.1.1.3. Intrusion Detection
- 11.1.1.4. Perimeter Security
- 11.1.2. Cyber Security
- 11.1.2.1. Network Security
- 11.1.2.2. End Point Security
- 11.1.2.3. Application Security
- 11.1.2.4. Cloud Security
- 11.1.2.5. Information Security
- 11.1.1. Physical Security
- 11.2. Market Analysis, Insights and Forecast - by End-user Vertical
- 11.2.1. Government and Public Sector
- 11.2.2. Commercial
- 11.2.3. Industrial
- 11.2.4. Residential
- 11.2.5. Healthcare
- 11.2.6. Education
- 11.2.7. Critical Infrastructure
- 11.3. Market Analysis, Insights and Forecast - by Solution Type
- 11.3.1. Hardware
- 11.3.2. Software
- 11.3.3. Services
- 11.4. Market Analysis, Insights and Forecast - by Deployment Type
- 11.4.1. On-premise
- 11.4.2. Cloud-based
- 11.1. Market Analysis, Insights and Forecast - by Security Type
- 12. Competitive Analysis
- 12.1. Global Market Share Analysis 2024
- 12.2. Company Profiles
- 12.2.1 Verkada Inc
- 12.2.1.1. Overview
- 12.2.1.2. Products
- 12.2.1.3. SWOT Analysis
- 12.2.1.4. Recent Developments
- 12.2.1.5. Financials (Based on Availability)
- 12.2.2 HID Global
- 12.2.2.1. Overview
- 12.2.2.2. Products
- 12.2.2.3. SWOT Analysis
- 12.2.2.4. Recent Developments
- 12.2.2.5. Financials (Based on Availability)
- 12.2.3 AMAG Technology (Allied Universal)
- 12.2.3.1. Overview
- 12.2.3.2. Products
- 12.2.3.3. SWOT Analysis
- 12.2.3.4. Recent Developments
- 12.2.3.5. Financials (Based on Availability)
- 12.2.4 Bosch Sicherheitssysteme GmbH
- 12.2.4.1. Overview
- 12.2.4.2. Products
- 12.2.4.3. SWOT Analysis
- 12.2.4.4. Recent Developments
- 12.2.4.5. Financials (Based on Availability)
- 12.2.5 Axis Communications AB
- 12.2.5.1. Overview
- 12.2.5.2. Products
- 12.2.5.3. SWOT Analysis
- 12.2.5.4. Recent Developments
- 12.2.5.5. Financials (Based on Availability)
- 12.2.6 Honeywell International Inc
- 12.2.6.1. Overview
- 12.2.6.2. Products
- 12.2.6.3. SWOT Analysis
- 12.2.6.4. Recent Developments
- 12.2.6.5. Financials (Based on Availability)
- 12.2.7 Johnson Controls
- 12.2.7.1. Overview
- 12.2.7.2. Products
- 12.2.7.3. SWOT Analysis
- 12.2.7.4. Recent Developments
- 12.2.7.5. Financials (Based on Availability)
- 12.2.8 ADT Inc
- 12.2.8.1. Overview
- 12.2.8.2. Products
- 12.2.8.3. SWOT Analysis
- 12.2.8.4. Recent Developments
- 12.2.8.5. Financials (Based on Availability)
- 12.2.9 Securitas Technology
- 12.2.9.1. Overview
- 12.2.9.2. Products
- 12.2.9.3. SWOT Analysis
- 12.2.9.4. Recent Developments
- 12.2.9.5. Financials (Based on Availability)
- 12.2.10 Assa Abloy Group
- 12.2.10.1. Overview
- 12.2.10.2. Products
- 12.2.10.3. SWOT Analysis
- 12.2.10.4. Recent Developments
- 12.2.10.5. Financials (Based on Availability)
- 12.2.11 Genetec Inc
- 12.2.11.1. Overview
- 12.2.11.2. Products
- 12.2.11.3. SWOT Analysis
- 12.2.11.4. Recent Developments
- 12.2.11.5. Financials (Based on Availability)
- 12.2.12 Palo Alto Networks
- 12.2.12.1. Overview
- 12.2.12.2. Products
- 12.2.12.3. SWOT Analysis
- 12.2.12.4. Recent Developments
- 12.2.12.5. Financials (Based on Availability)
- 12.2.13 Fortinet Inc
- 12.2.13.1. Overview
- 12.2.13.2. Products
- 12.2.13.3. SWOT Analysis
- 12.2.13.4. Recent Developments
- 12.2.13.5. Financials (Based on Availability)
- 12.2.14 IBM Corporation
- 12.2.14.1. Overview
- 12.2.14.2. Products
- 12.2.14.3. SWOT Analysis
- 12.2.14.4. Recent Developments
- 12.2.14.5. Financials (Based on Availability)
- 12.2.15 Cisco Systems Inc
- 12.2.15.1. Overview
- 12.2.15.2. Products
- 12.2.15.3. SWOT Analysis
- 12.2.15.4. Recent Developments
- 12.2.15.5. Financials (Based on Availability)
- 12.2.1 Verkada Inc
List of Figures
- Figure 1: Global Security Market Revenue Breakdown (Million, %) by Region 2024 & 2032
- Figure 2: Global Security Market Volume Breakdown (Billion, %) by Region 2024 & 2032
- Figure 3: North America Security Market Revenue (Million), by Security Type 2024 & 2032
- Figure 4: North America Security Market Volume (Billion), by Security Type 2024 & 2032
- Figure 5: North America Security Market Revenue Share (%), by Security Type 2024 & 2032
- Figure 6: North America Security Market Volume Share (%), by Security Type 2024 & 2032
- Figure 7: North America Security Market Revenue (Million), by End-user Vertical 2024 & 2032
- Figure 8: North America Security Market Volume (Billion), by End-user Vertical 2024 & 2032
- Figure 9: North America Security Market Revenue Share (%), by End-user Vertical 2024 & 2032
- Figure 10: North America Security Market Volume Share (%), by End-user Vertical 2024 & 2032
- Figure 11: North America Security Market Revenue (Million), by Solution Type 2024 & 2032
- Figure 12: North America Security Market Volume (Billion), by Solution Type 2024 & 2032
- Figure 13: North America Security Market Revenue Share (%), by Solution Type 2024 & 2032
- Figure 14: North America Security Market Volume Share (%), by Solution Type 2024 & 2032
- Figure 15: North America Security Market Revenue (Million), by Deployment Type 2024 & 2032
- Figure 16: North America Security Market Volume (Billion), by Deployment Type 2024 & 2032
- Figure 17: North America Security Market Revenue Share (%), by Deployment Type 2024 & 2032
- Figure 18: North America Security Market Volume Share (%), by Deployment Type 2024 & 2032
- Figure 19: North America Security Market Revenue (Million), by Country 2024 & 2032
- Figure 20: North America Security Market Volume (Billion), by Country 2024 & 2032
- Figure 21: North America Security Market Revenue Share (%), by Country 2024 & 2032
- Figure 22: North America Security Market Volume Share (%), by Country 2024 & 2032
- Figure 23: Europe Security Market Revenue (Million), by Security Type 2024 & 2032
- Figure 24: Europe Security Market Volume (Billion), by Security Type 2024 & 2032
- Figure 25: Europe Security Market Revenue Share (%), by Security Type 2024 & 2032
- Figure 26: Europe Security Market Volume Share (%), by Security Type 2024 & 2032
- Figure 27: Europe Security Market Revenue (Million), by End-user Vertical 2024 & 2032
- Figure 28: Europe Security Market Volume (Billion), by End-user Vertical 2024 & 2032
- Figure 29: Europe Security Market Revenue Share (%), by End-user Vertical 2024 & 2032
- Figure 30: Europe Security Market Volume Share (%), by End-user Vertical 2024 & 2032
- Figure 31: Europe Security Market Revenue (Million), by Solution Type 2024 & 2032
- Figure 32: Europe Security Market Volume (Billion), by Solution Type 2024 & 2032
- Figure 33: Europe Security Market Revenue Share (%), by Solution Type 2024 & 2032
- Figure 34: Europe Security Market Volume Share (%), by Solution Type 2024 & 2032
- Figure 35: Europe Security Market Revenue (Million), by Deployment Type 2024 & 2032
- Figure 36: Europe Security Market Volume (Billion), by Deployment Type 2024 & 2032
- Figure 37: Europe Security Market Revenue Share (%), by Deployment Type 2024 & 2032
- Figure 38: Europe Security Market Volume Share (%), by Deployment Type 2024 & 2032
- Figure 39: Europe Security Market Revenue (Million), by Country 2024 & 2032
- Figure 40: Europe Security Market Volume (Billion), by Country 2024 & 2032
- Figure 41: Europe Security Market Revenue Share (%), by Country 2024 & 2032
- Figure 42: Europe Security Market Volume Share (%), by Country 2024 & 2032
- Figure 43: Asia Security Market Revenue (Million), by Security Type 2024 & 2032
- Figure 44: Asia Security Market Volume (Billion), by Security Type 2024 & 2032
- Figure 45: Asia Security Market Revenue Share (%), by Security Type 2024 & 2032
- Figure 46: Asia Security Market Volume Share (%), by Security Type 2024 & 2032
- Figure 47: Asia Security Market Revenue (Million), by End-user Vertical 2024 & 2032
- Figure 48: Asia Security Market Volume (Billion), by End-user Vertical 2024 & 2032
- Figure 49: Asia Security Market Revenue Share (%), by End-user Vertical 2024 & 2032
- Figure 50: Asia Security Market Volume Share (%), by End-user Vertical 2024 & 2032
- Figure 51: Asia Security Market Revenue (Million), by Solution Type 2024 & 2032
- Figure 52: Asia Security Market Volume (Billion), by Solution Type 2024 & 2032
- Figure 53: Asia Security Market Revenue Share (%), by Solution Type 2024 & 2032
- Figure 54: Asia Security Market Volume Share (%), by Solution Type 2024 & 2032
- Figure 55: Asia Security Market Revenue (Million), by Deployment Type 2024 & 2032
- Figure 56: Asia Security Market Volume (Billion), by Deployment Type 2024 & 2032
- Figure 57: Asia Security Market Revenue Share (%), by Deployment Type 2024 & 2032
- Figure 58: Asia Security Market Volume Share (%), by Deployment Type 2024 & 2032
- Figure 59: Asia Security Market Revenue (Million), by Country 2024 & 2032
- Figure 60: Asia Security Market Volume (Billion), by Country 2024 & 2032
- Figure 61: Asia Security Market Revenue Share (%), by Country 2024 & 2032
- Figure 62: Asia Security Market Volume Share (%), by Country 2024 & 2032
- Figure 63: Australia and New Zealand Security Market Revenue (Million), by Security Type 2024 & 2032
- Figure 64: Australia and New Zealand Security Market Volume (Billion), by Security Type 2024 & 2032
- Figure 65: Australia and New Zealand Security Market Revenue Share (%), by Security Type 2024 & 2032
- Figure 66: Australia and New Zealand Security Market Volume Share (%), by Security Type 2024 & 2032
- Figure 67: Australia and New Zealand Security Market Revenue (Million), by End-user Vertical 2024 & 2032
- Figure 68: Australia and New Zealand Security Market Volume (Billion), by End-user Vertical 2024 & 2032
- Figure 69: Australia and New Zealand Security Market Revenue Share (%), by End-user Vertical 2024 & 2032
- Figure 70: Australia and New Zealand Security Market Volume Share (%), by End-user Vertical 2024 & 2032
- Figure 71: Australia and New Zealand Security Market Revenue (Million), by Solution Type 2024 & 2032
- Figure 72: Australia and New Zealand Security Market Volume (Billion), by Solution Type 2024 & 2032
- Figure 73: Australia and New Zealand Security Market Revenue Share (%), by Solution Type 2024 & 2032
- Figure 74: Australia and New Zealand Security Market Volume Share (%), by Solution Type 2024 & 2032
- Figure 75: Australia and New Zealand Security Market Revenue (Million), by Deployment Type 2024 & 2032
- Figure 76: Australia and New Zealand Security Market Volume (Billion), by Deployment Type 2024 & 2032
- Figure 77: Australia and New Zealand Security Market Revenue Share (%), by Deployment Type 2024 & 2032
- Figure 78: Australia and New Zealand Security Market Volume Share (%), by Deployment Type 2024 & 2032
- Figure 79: Australia and New Zealand Security Market Revenue (Million), by Country 2024 & 2032
- Figure 80: Australia and New Zealand Security Market Volume (Billion), by Country 2024 & 2032
- Figure 81: Australia and New Zealand Security Market Revenue Share (%), by Country 2024 & 2032
- Figure 82: Australia and New Zealand Security Market Volume Share (%), by Country 2024 & 2032
- Figure 83: Latin America Security Market Revenue (Million), by Security Type 2024 & 2032
- Figure 84: Latin America Security Market Volume (Billion), by Security Type 2024 & 2032
- Figure 85: Latin America Security Market Revenue Share (%), by Security Type 2024 & 2032
- Figure 86: Latin America Security Market Volume Share (%), by Security Type 2024 & 2032
- Figure 87: Latin America Security Market Revenue (Million), by End-user Vertical 2024 & 2032
- Figure 88: Latin America Security Market Volume (Billion), by End-user Vertical 2024 & 2032
- Figure 89: Latin America Security Market Revenue Share (%), by End-user Vertical 2024 & 2032
- Figure 90: Latin America Security Market Volume Share (%), by End-user Vertical 2024 & 2032
- Figure 91: Latin America Security Market Revenue (Million), by Solution Type 2024 & 2032
- Figure 92: Latin America Security Market Volume (Billion), by Solution Type 2024 & 2032
- Figure 93: Latin America Security Market Revenue Share (%), by Solution Type 2024 & 2032
- Figure 94: Latin America Security Market Volume Share (%), by Solution Type 2024 & 2032
- Figure 95: Latin America Security Market Revenue (Million), by Deployment Type 2024 & 2032
- Figure 96: Latin America Security Market Volume (Billion), by Deployment Type 2024 & 2032
- Figure 97: Latin America Security Market Revenue Share (%), by Deployment Type 2024 & 2032
- Figure 98: Latin America Security Market Volume Share (%), by Deployment Type 2024 & 2032
- Figure 99: Latin America Security Market Revenue (Million), by Country 2024 & 2032
- Figure 100: Latin America Security Market Volume (Billion), by Country 2024 & 2032
- Figure 101: Latin America Security Market Revenue Share (%), by Country 2024 & 2032
- Figure 102: Latin America Security Market Volume Share (%), by Country 2024 & 2032
- Figure 103: Middle East and Africa Security Market Revenue (Million), by Security Type 2024 & 2032
- Figure 104: Middle East and Africa Security Market Volume (Billion), by Security Type 2024 & 2032
- Figure 105: Middle East and Africa Security Market Revenue Share (%), by Security Type 2024 & 2032
- Figure 106: Middle East and Africa Security Market Volume Share (%), by Security Type 2024 & 2032
- Figure 107: Middle East and Africa Security Market Revenue (Million), by End-user Vertical 2024 & 2032
- Figure 108: Middle East and Africa Security Market Volume (Billion), by End-user Vertical 2024 & 2032
- Figure 109: Middle East and Africa Security Market Revenue Share (%), by End-user Vertical 2024 & 2032
- Figure 110: Middle East and Africa Security Market Volume Share (%), by End-user Vertical 2024 & 2032
- Figure 111: Middle East and Africa Security Market Revenue (Million), by Solution Type 2024 & 2032
- Figure 112: Middle East and Africa Security Market Volume (Billion), by Solution Type 2024 & 2032
- Figure 113: Middle East and Africa Security Market Revenue Share (%), by Solution Type 2024 & 2032
- Figure 114: Middle East and Africa Security Market Volume Share (%), by Solution Type 2024 & 2032
- Figure 115: Middle East and Africa Security Market Revenue (Million), by Deployment Type 2024 & 2032
- Figure 116: Middle East and Africa Security Market Volume (Billion), by Deployment Type 2024 & 2032
- Figure 117: Middle East and Africa Security Market Revenue Share (%), by Deployment Type 2024 & 2032
- Figure 118: Middle East and Africa Security Market Volume Share (%), by Deployment Type 2024 & 2032
- Figure 119: Middle East and Africa Security Market Revenue (Million), by Country 2024 & 2032
- Figure 120: Middle East and Africa Security Market Volume (Billion), by Country 2024 & 2032
- Figure 121: Middle East and Africa Security Market Revenue Share (%), by Country 2024 & 2032
- Figure 122: Middle East and Africa Security Market Volume Share (%), by Country 2024 & 2032
List of Tables
- Table 1: Global Security Market Revenue Million Forecast, by Region 2019 & 2032
- Table 2: Global Security Market Volume Billion Forecast, by Region 2019 & 2032
- Table 3: Global Security Market Revenue Million Forecast, by Security Type 2019 & 2032
- Table 4: Global Security Market Volume Billion Forecast, by Security Type 2019 & 2032
- Table 5: Global Security Market Revenue Million Forecast, by End-user Vertical 2019 & 2032
- Table 6: Global Security Market Volume Billion Forecast, by End-user Vertical 2019 & 2032
- Table 7: Global Security Market Revenue Million Forecast, by Solution Type 2019 & 2032
- Table 8: Global Security Market Volume Billion Forecast, by Solution Type 2019 & 2032
- Table 9: Global Security Market Revenue Million Forecast, by Deployment Type 2019 & 2032
- Table 10: Global Security Market Volume Billion Forecast, by Deployment Type 2019 & 2032
- Table 11: Global Security Market Revenue Million Forecast, by Region 2019 & 2032
- Table 12: Global Security Market Volume Billion Forecast, by Region 2019 & 2032
- Table 13: Global Security Market Revenue Million Forecast, by Security Type 2019 & 2032
- Table 14: Global Security Market Volume Billion Forecast, by Security Type 2019 & 2032
- Table 15: Global Security Market Revenue Million Forecast, by End-user Vertical 2019 & 2032
- Table 16: Global Security Market Volume Billion Forecast, by End-user Vertical 2019 & 2032
- Table 17: Global Security Market Revenue Million Forecast, by Solution Type 2019 & 2032
- Table 18: Global Security Market Volume Billion Forecast, by Solution Type 2019 & 2032
- Table 19: Global Security Market Revenue Million Forecast, by Deployment Type 2019 & 2032
- Table 20: Global Security Market Volume Billion Forecast, by Deployment Type 2019 & 2032
- Table 21: Global Security Market Revenue Million Forecast, by Country 2019 & 2032
- Table 22: Global Security Market Volume Billion Forecast, by Country 2019 & 2032
- Table 23: Global Security Market Revenue Million Forecast, by Security Type 2019 & 2032
- Table 24: Global Security Market Volume Billion Forecast, by Security Type 2019 & 2032
- Table 25: Global Security Market Revenue Million Forecast, by End-user Vertical 2019 & 2032
- Table 26: Global Security Market Volume Billion Forecast, by End-user Vertical 2019 & 2032
- Table 27: Global Security Market Revenue Million Forecast, by Solution Type 2019 & 2032
- Table 28: Global Security Market Volume Billion Forecast, by Solution Type 2019 & 2032
- Table 29: Global Security Market Revenue Million Forecast, by Deployment Type 2019 & 2032
- Table 30: Global Security Market Volume Billion Forecast, by Deployment Type 2019 & 2032
- Table 31: Global Security Market Revenue Million Forecast, by Country 2019 & 2032
- Table 32: Global Security Market Volume Billion Forecast, by Country 2019 & 2032
- Table 33: Global Security Market Revenue Million Forecast, by Security Type 2019 & 2032
- Table 34: Global Security Market Volume Billion Forecast, by Security Type 2019 & 2032
- Table 35: Global Security Market Revenue Million Forecast, by End-user Vertical 2019 & 2032
- Table 36: Global Security Market Volume Billion Forecast, by End-user Vertical 2019 & 2032
- Table 37: Global Security Market Revenue Million Forecast, by Solution Type 2019 & 2032
- Table 38: Global Security Market Volume Billion Forecast, by Solution Type 2019 & 2032
- Table 39: Global Security Market Revenue Million Forecast, by Deployment Type 2019 & 2032
- Table 40: Global Security Market Volume Billion Forecast, by Deployment Type 2019 & 2032
- Table 41: Global Security Market Revenue Million Forecast, by Country 2019 & 2032
- Table 42: Global Security Market Volume Billion Forecast, by Country 2019 & 2032
- Table 43: Global Security Market Revenue Million Forecast, by Security Type 2019 & 2032
- Table 44: Global Security Market Volume Billion Forecast, by Security Type 2019 & 2032
- Table 45: Global Security Market Revenue Million Forecast, by End-user Vertical 2019 & 2032
- Table 46: Global Security Market Volume Billion Forecast, by End-user Vertical 2019 & 2032
- Table 47: Global Security Market Revenue Million Forecast, by Solution Type 2019 & 2032
- Table 48: Global Security Market Volume Billion Forecast, by Solution Type 2019 & 2032
- Table 49: Global Security Market Revenue Million Forecast, by Deployment Type 2019 & 2032
- Table 50: Global Security Market Volume Billion Forecast, by Deployment Type 2019 & 2032
- Table 51: Global Security Market Revenue Million Forecast, by Country 2019 & 2032
- Table 52: Global Security Market Volume Billion Forecast, by Country 2019 & 2032
- Table 53: Global Security Market Revenue Million Forecast, by Security Type 2019 & 2032
- Table 54: Global Security Market Volume Billion Forecast, by Security Type 2019 & 2032
- Table 55: Global Security Market Revenue Million Forecast, by End-user Vertical 2019 & 2032
- Table 56: Global Security Market Volume Billion Forecast, by End-user Vertical 2019 & 2032
- Table 57: Global Security Market Revenue Million Forecast, by Solution Type 2019 & 2032
- Table 58: Global Security Market Volume Billion Forecast, by Solution Type 2019 & 2032
- Table 59: Global Security Market Revenue Million Forecast, by Deployment Type 2019 & 2032
- Table 60: Global Security Market Volume Billion Forecast, by Deployment Type 2019 & 2032
- Table 61: Global Security Market Revenue Million Forecast, by Country 2019 & 2032
- Table 62: Global Security Market Volume Billion Forecast, by Country 2019 & 2032
- Table 63: Global Security Market Revenue Million Forecast, by Security Type 2019 & 2032
- Table 64: Global Security Market Volume Billion Forecast, by Security Type 2019 & 2032
- Table 65: Global Security Market Revenue Million Forecast, by End-user Vertical 2019 & 2032
- Table 66: Global Security Market Volume Billion Forecast, by End-user Vertical 2019 & 2032
- Table 67: Global Security Market Revenue Million Forecast, by Solution Type 2019 & 2032
- Table 68: Global Security Market Volume Billion Forecast, by Solution Type 2019 & 2032
- Table 69: Global Security Market Revenue Million Forecast, by Deployment Type 2019 & 2032
- Table 70: Global Security Market Volume Billion Forecast, by Deployment Type 2019 & 2032
- Table 71: Global Security Market Revenue Million Forecast, by Country 2019 & 2032
- Table 72: Global Security Market Volume Billion Forecast, by Country 2019 & 2032
Frequently Asked Questions
1. What is the projected Compound Annual Growth Rate (CAGR) of the Security Market?
The projected CAGR is approximately 10.20%.
2. Which companies are prominent players in the Security Market?
Key companies in the market include Verkada Inc, HID Global, AMAG Technology (Allied Universal), Bosch Sicherheitssysteme GmbH, Axis Communications AB, Honeywell International Inc, Johnson Controls, ADT Inc, Securitas Technology, Assa Abloy Group, Genetec Inc, Palo Alto Networks, Fortinet Inc, IBM Corporation, Cisco Systems Inc.
3. What are the main segments of the Security Market?
The market segments include Security Type, End-user Vertical, Solution Type, Deployment Type.
4. Can you provide details about the market size?
The market size is estimated to be USD 23.71 Million as of 2022.
5. What are some drivers contributing to market growth?
Increasing Cyber Threats; Growth in IoT Devices.
6. What are the notable trends driving market growth?
Commercial Sector Witnessing Demand.
7. Are there any restraints impacting market growth?
Increasing Cyber Threats; Growth in IoT Devices.
8. Can you provide examples of recent developments in the market?
August 2024: Alfred International, a subsidiary of GHT Door Hardware specializing in smart and connected locks, launched its patented Alfred ML2 Smart Mortise Lock with Z-Wave Long Range in the United States. The ML2, as per the company's claims, merges cutting-edge technology with a modern keypad and a unique design. This patented drive mechanism enables dealers to retrofit the ML2 into properties that previously used older mortise-style locks. Now available in the United States, the ML2 caters to property managers and homeowners who wish to upgrade to a smart mortise lock. This upgrade can be done without entirely replacing or re-keying the existing lock, thus sidestepping common installation challenges.
9. What pricing options are available for accessing the report?
Pricing options include single-user, multi-user, and enterprise licenses priced at USD 4750, USD 5250, and USD 8750 respectively.
10. Is the market size provided in terms of value or volume?
The market size is provided in terms of value, measured in Million and volume, measured in Billion.
11. Are there any specific market keywords associated with the report?
Yes, the market keyword associated with the report is "Security Market," which aids in identifying and referencing the specific market segment covered.
12. How do I determine which pricing option suits my needs best?
The pricing options vary based on user requirements and access needs. Individual users may opt for single-user licenses, while businesses requiring broader access may choose multi-user or enterprise licenses for cost-effective access to the report.
13. Are there any additional resources or data provided in the Security Market report?
While the report offers comprehensive insights, it's advisable to review the specific contents or supplementary materials provided to ascertain if additional resources or data are available.
14. How can I stay updated on further developments or reports in the Security Market?
To stay informed about further developments, trends, and reports in the Security Market, consider subscribing to industry newsletters, following relevant companies and organizations, or regularly checking reputable industry news sources and publications.
Methodology
Step 1 - Identification of Relevant Samples Size from Population Database


Step 2 - Approaches for Defining Global Market Size (Value, Volume* & Price*)

Note*: In applicable scenarios
Step 3 - Data Sources
Primary Research
- Web Analytics
- Survey Reports
- Research Institute
- Latest Research Reports
- Opinion Leaders
Secondary Research
- Annual Reports
- White Paper
- Latest Press Release
- Industry Association
- Paid Database
- Investor Presentations

Step 4 - Data Triangulation
Involves using different sources of information in order to increase the validity of a study
These sources are likely to be stakeholders in a program - participants, other researchers, program staff, other community members, and so on.
Then we put all data in single framework & apply various statistical tools to find out the dynamic on the market.
During the analysis stage, feedback from the stakeholder groups would be compared to determine areas of agreement as well as areas of divergence
