

Key Insights
The global self-balancing unicycle market is poised for significant expansion, projected to reach $179 million by 2025, demonstrating robust growth with a Compound Annual Growth Rate (CAGR) of 4.2% from 2019 to 2033. This upward trajectory is fueled by a confluence of factors including increasing adoption for personal mobility solutions, especially in urban environments, and growing recreational use. The market is seeing a surge in demand for lightweight and portable unicycles, particularly those categorized as "Below 500W," appealing to a broad consumer base seeking convenient and eco-friendly transportation. Children's applications are also becoming a notable segment, as these devices offer an engaging and adventurous mode of transport, contributing to the market's diversification. Emerging economies, particularly in the Asia Pacific region, are expected to be key growth drivers due to rapid urbanization and a burgeoning middle class with disposable income.
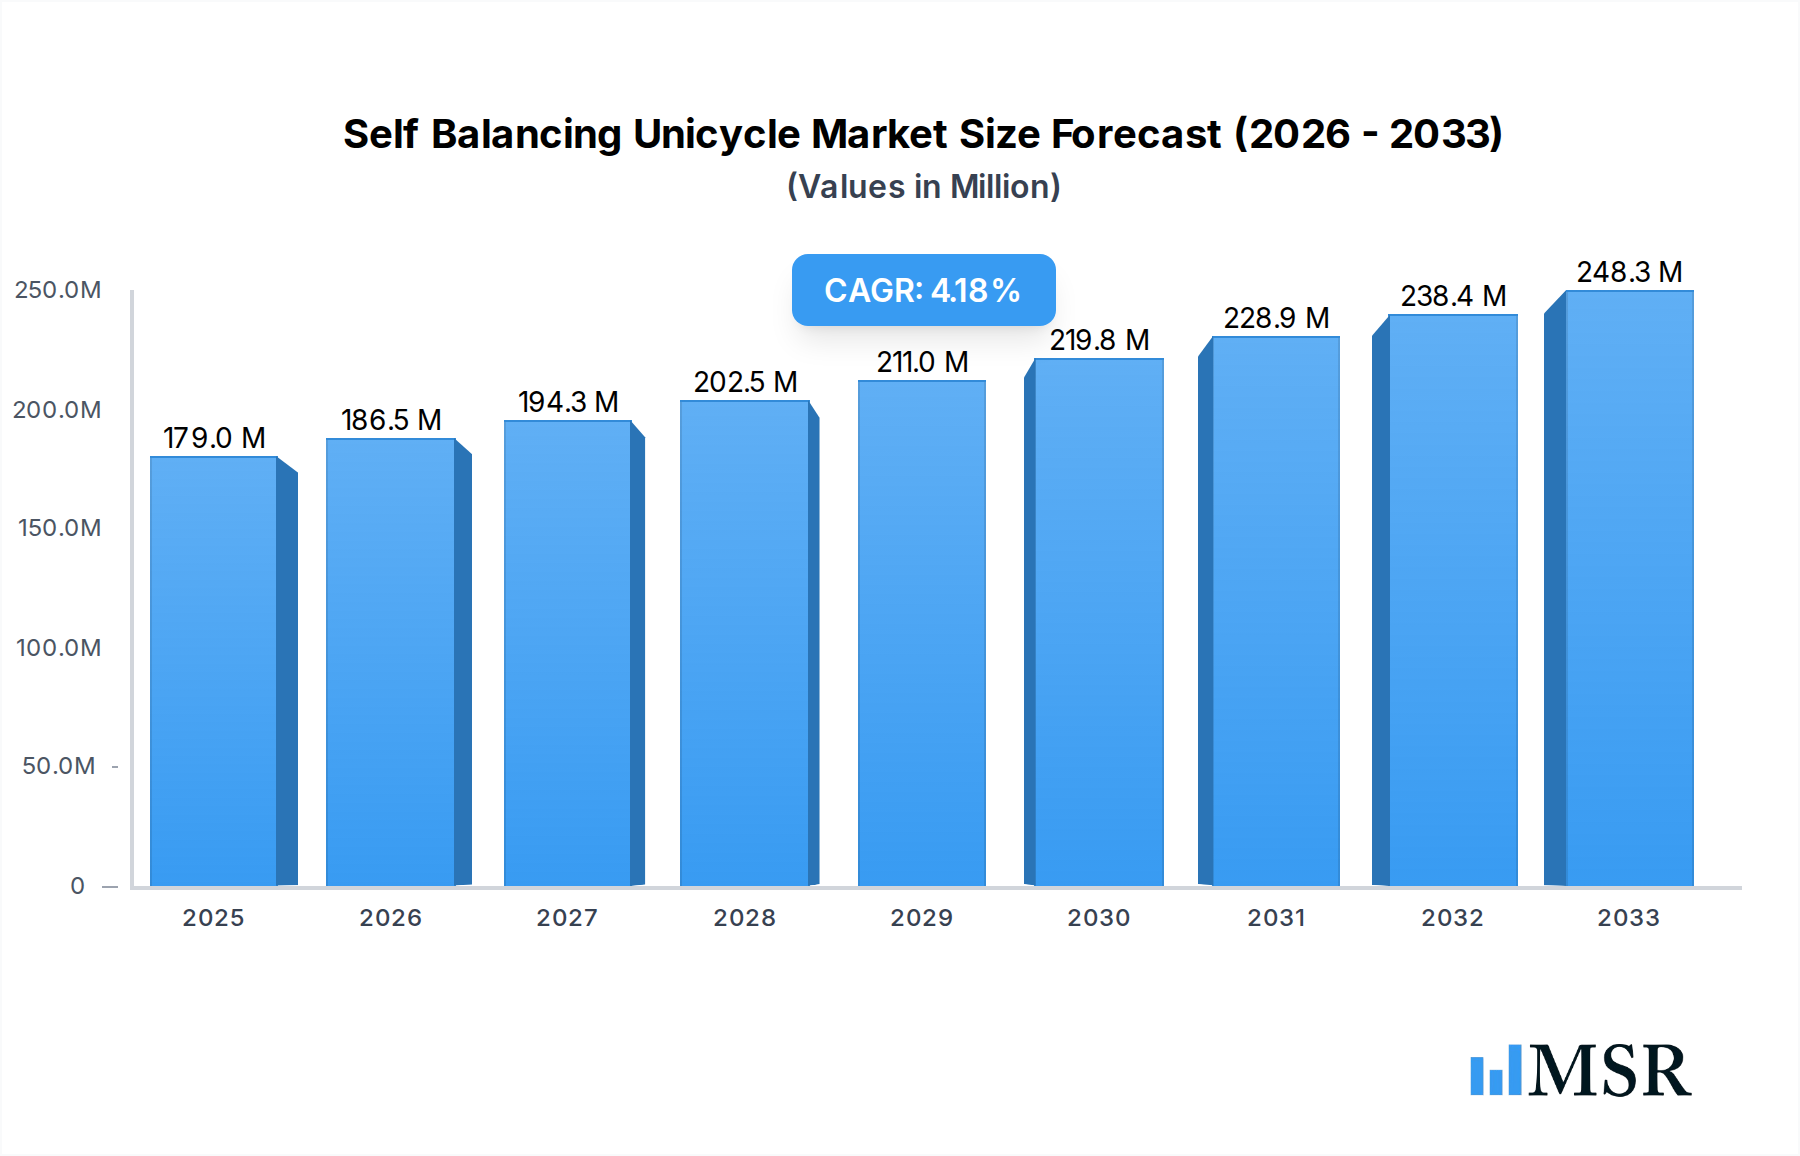
Self Balancing Unicycle Market Size (In Million)
The market's expansion is further supported by advancements in battery technology, enhancing range and reducing charging times, alongside improvements in safety features. Innovations in design and user experience are also contributing to wider consumer acceptance. However, the market faces certain restraints, including the need for rider proficiency, which can present a learning curve, and regulatory uncertainties in some regions regarding their use on public roads. Despite these challenges, the inherent convenience, maneuverability, and the growing trend towards micro-mobility solutions position the self-balancing unicycle market for sustained and dynamic growth. Key players like Ninebot, Airwheel, and KingSong are actively investing in research and development to introduce innovative products and capture a larger market share in this evolving landscape.

Self Balancing Unicycle Company Market Share
Self Balancing Unicycle Market Report: Comprehensive Analysis & Future Outlook (2019–2033)
Unlock the future of personal mobility with our in-depth Self Balancing Unicycle market report. This definitive research provides unparalleled insights into a rapidly evolving sector, projecting significant growth and identifying key opportunities. Covering the historical period of 2019–2024 and a robust forecast period of 2025–2033, with a base year of 2025, this report is essential for industry stakeholders seeking to navigate and capitalize on the burgeoning self-balancing unicycle market.
Self Balancing Unicycle Market Concentration & Dynamics
The self-balancing unicycle market exhibits a moderately concentrated landscape, driven by a handful of dominant players and a vibrant ecosystem of innovation. Companies such as Ninebot, Airwheel, KingSong, Gotway, IPS, Solowheel, Rockwheel, Firewheel, ESWAY, Inmotion, Segway, Fosjoas, MonoRover, and F-WHEEL are actively shaping the competitive environment. Innovation hubs are concentrated in regions with strong technological infrastructure, fostering rapid advancements in battery technology, motor efficiency, and user interface design. Regulatory frameworks are gradually evolving, with an increasing focus on safety standards and urban integration. Substitute products, including electric scooters and hoverboards, present ongoing competition, yet the unique agility and rider experience of self-balancing unicycles continue to carve out a distinct market niche. End-user trends reveal a growing demand for personal, eco-friendly transportation solutions, particularly among younger demographics and urban commuters. Mergers and acquisitions (M&A) activities are anticipated to increase as larger players seek to consolidate market share and acquire innovative technologies. The market share distribution is dynamic, with leading companies holding substantial portions, while a growing number of startups are introducing specialized products. M&A deal counts are projected to see a steady rise, reflecting the market's maturity and consolidation phase.
Self Balancing Unicycle Industry Insights & Trends
The global self-balancing unicycle market is poised for substantial expansion, driven by a confluence of technological advancements, shifting consumer preferences, and a growing emphasis on sustainable urban mobility. The market size, estimated at xx million in the base year of 2025, is projected to reach xx million by 2033, exhibiting a Compound Annual Growth Rate (CAGR) of xx% during the forecast period. Market growth drivers are multifaceted, including the increasing adoption of electric personal transportation devices for last-mile connectivity, the demand for compact and agile urban commuting solutions, and continuous improvements in battery life and charging speed. Technological disruptions are at the forefront of this growth, with advancements in motor power, intelligent control systems, and integrated safety features enhancing both performance and user experience. Consumers are increasingly valuing convenience, environmental consciousness, and the unique recreational aspects offered by self-balancing unicycles. The desire for efficient and enjoyable personal mobility solutions in congested urban environments is a significant catalyst. Furthermore, the development of more robust and aesthetically pleasing designs is broadening the appeal of these devices across a wider demographic. The integration of smart features, such as GPS tracking and mobile app connectivity, is also contributing to market traction.
Key Markets & Segments Leading Self Balancing Unicycle
The self-balancing unicycle market's dominance is largely dictated by regions and segments that prioritize innovation, urban mobility, and a receptive consumer base.
Dominant Region Analysis: Asia-Pacific currently leads the global self-balancing unicycle market, propelled by its dense urban populations, rapid technological adoption, and government initiatives promoting green transportation. Countries like China are at the forefront, driven by a strong manufacturing base and a burgeoning middle class seeking convenient commuting alternatives. North America and Europe are also significant markets, with increasing interest in personal electric vehicles for recreational use and last-mile commuting.
Application Dominance:
- Adults: This segment forms the largest consumer base, driven by commuters seeking an efficient and eco-friendly alternative to traditional transportation. Factors contributing to this dominance include the need for quick, single-person transport in urban environments, recreational use, and the growing trend of embracing personal electric vehicles.
- Children: While a smaller segment currently, the market for children's self-balancing unicycles is poised for growth, fueled by parental interest in providing fun, active, and technologically engaging recreational products. Safety features and ease of use are paramount for this segment.
Type Dominance:
- Above 1000W: This category is witnessing robust growth, catering to enthusiasts and experienced riders seeking higher speeds, greater torque for inclines, and extended range. The demand is driven by performance-oriented users and those looking for unicycles capable of handling varied terrains.
- 500-1000W: This segment represents the sweet spot for many urban commuters, offering a good balance of power, range, and portability. It is expected to maintain a significant market share due to its versatility and appeal to a broad range of users.
- Below 500W: While initially popular for entry-level users and younger riders, this segment is gradually being overshadowed by higher-powered options offering better performance. However, it remains relevant for specific recreational purposes and for users prioritizing extreme portability and lower cost.
Economic growth, coupled with developing urban infrastructure that accommodates micro-mobility solutions, directly fuels the expansion of these key markets and segments. The increasing availability of charging stations and dedicated lanes for personal electric vehicles further bolsters their adoption.
Self Balancing Unicycle Product Developments
Product innovations in the self-balancing unicycle sector are consistently enhancing performance, safety, and user experience. Manufacturers are focusing on developing lighter yet more durable frames, integrating advanced battery management systems for extended range and faster charging, and refining motor technology for smoother acceleration and superior hill-climbing capabilities. Smart connectivity features, including smartphone app integration for diagnostics, ride tracking, and customization, are becoming standard. Advancements in gyroscopic stabilization and intelligent control algorithms are improving ride stability and ease of learning, making these devices more accessible to a wider audience. The competitive edge is increasingly being defined by sophisticated aesthetic designs and robust build quality, catering to discerning consumers.
Challenges in the Self Balancing Unicycle Market
The self-balancing unicycle market faces several inherent challenges that impact its widespread adoption and growth trajectory. Regulatory hurdles remain a significant concern, with varying classifications and restrictions across different cities and countries regarding the use of personal electric vehicles on public pathways and roads. Supply chain disruptions, particularly concerning battery components and microchips, can affect production volumes and cost. Furthermore, intense competitive pressure from established players and emerging low-cost manufacturers can lead to price wars, impacting profit margins. Public perception and safety concerns, stemming from occasional accidents, also pose a barrier to mainstream acceptance. The initial learning curve for new users can also deter potential customers, necessitating ongoing efforts in user education and product design simplification.
Forces Driving Self Balancing Unicycle Growth
Several powerful forces are propelling the growth of the self-balancing unicycle market. Technological advancements in battery efficiency and motor power are enabling longer ranges and more robust performance, directly addressing key consumer needs. The escalating global focus on environmental sustainability and the reduction of carbon footprints is driving demand for eco-friendly personal transportation. Economic factors, such as rising fuel costs and increasing urbanization, make compact, efficient personal mobility solutions increasingly attractive. Government incentives and supportive policies promoting electric micro-mobility also play a crucial role. The growing popularity of outdoor recreational activities and the desire for unique, engaging personal transport experiences further contribute to market expansion.
Challenges in the Self Balancing Unicycle Market
Long-term growth catalysts for the self-balancing unicycle market are deeply intertwined with ongoing innovation and strategic market expansion. Continued research and development in battery technology, aiming for even greater energy density and faster charging capabilities, will be paramount. Strategic partnerships between manufacturers and urban planners can facilitate the integration of self-balancing unicycles into existing public transportation networks and infrastructure. Market expansions into developing regions with a growing middle class and increasing demand for personal mobility solutions present significant growth potential. Furthermore, the development of specialized models catering to specific niche applications, such as delivery services or enhanced off-road capabilities, can unlock new revenue streams.
Emerging Opportunities in Self Balancing Unicycle
Emerging opportunities in the self-balancing unicycle market are presenting new avenues for growth and innovation. The integration of advanced AI and predictive maintenance features can enhance user safety and device longevity. The development of modular designs, allowing for easy customization and repair, can broaden appeal and reduce long-term ownership costs. Exploring subscription-based models and shared mobility services in urban centers can tap into a new consumer segment. Furthermore, the growing trend of smart city initiatives and the demand for integrated personal mobility solutions offer significant potential for collaboration with local governments and technology providers. The development of robust, all-weather models will also open up previously inaccessible markets.
Leading Players in the Self Balancing Unicycle Sector
- Ninebot
- Airwheel
- KingSong
- Gotway
- IPS
- Solowheel
- Rockwheel
- Firewheel
- ESWAY
- Inmotion
- Segway
- Fosjoas
- MonoRover
- F-WHEEL
Key Milestones in Self Balancing Unicycle Industry
- 2019: Introduction of advanced battery management systems leading to improved range and durability in many models.
- 2020: Significant increase in smartphone app integration for diagnostics and customization across leading brands.
- 2021: Enhanced motor efficiency and torque improvements, enabling better hill-climbing capabilities.
- 2022: Emergence of more robust and aesthetically refined designs, broadening market appeal.
- 2023: Increased focus on safety features, including improved lighting and braking systems, driven by evolving regulations.
- 2024: Growing interest and development of models specifically targeting beginner riders with enhanced stability and learning modes.
Strategic Outlook for Self Balancing Unicycle Market
The strategic outlook for the self-balancing unicycle market is overwhelmingly positive, characterized by sustained innovation and expanding market penetration. Growth accelerators will include continued advancements in battery technology, leading to extended range and faster charging, which are critical for commuters. The ongoing drive towards sustainable urban mobility will further fuel demand for these eco-friendly personal transport devices. Strategic opportunities lie in deepening market penetration in developing economies, forging strategic alliances with urban planners to integrate self-balancing unicycles into smart city ecosystems, and the development of specialized models for commercial and recreational applications. The market is expected to witness a consolidation phase, with leading players expanding their portfolios and acquiring innovative startups, thereby shaping a more mature and dynamic industry landscape.
Self Balancing Unicycle Segmentation
-
1. Application
- 1.1. Adults
- 1.2. Children
-
2. Type
- 2.1. Below 500W
- 2.2. 500-1000W
- 2.3. Above 1000W
Self Balancing Unicycle Segmentation By Geography
-
1. North America
- 1.1. United States
- 1.2. Canada
- 1.3. Mexico
-
2. South America
- 2.1. Brazil
- 2.2. Argentina
- 2.3. Rest of South America
-
3. Europe
- 3.1. United Kingdom
- 3.2. Germany
- 3.3. France
- 3.4. Italy
- 3.5. Spain
- 3.6. Russia
- 3.7. Benelux
- 3.8. Nordics
- 3.9. Rest of Europe
-
4. Middle East & Africa
- 4.1. Turkey
- 4.2. Israel
- 4.3. GCC
- 4.4. North Africa
- 4.5. South Africa
- 4.6. Rest of Middle East & Africa
-
5. Asia Pacific
- 5.1. China
- 5.2. India
- 5.3. Japan
- 5.4. South Korea
- 5.5. ASEAN
- 5.6. Oceania
- 5.7. Rest of Asia Pacific
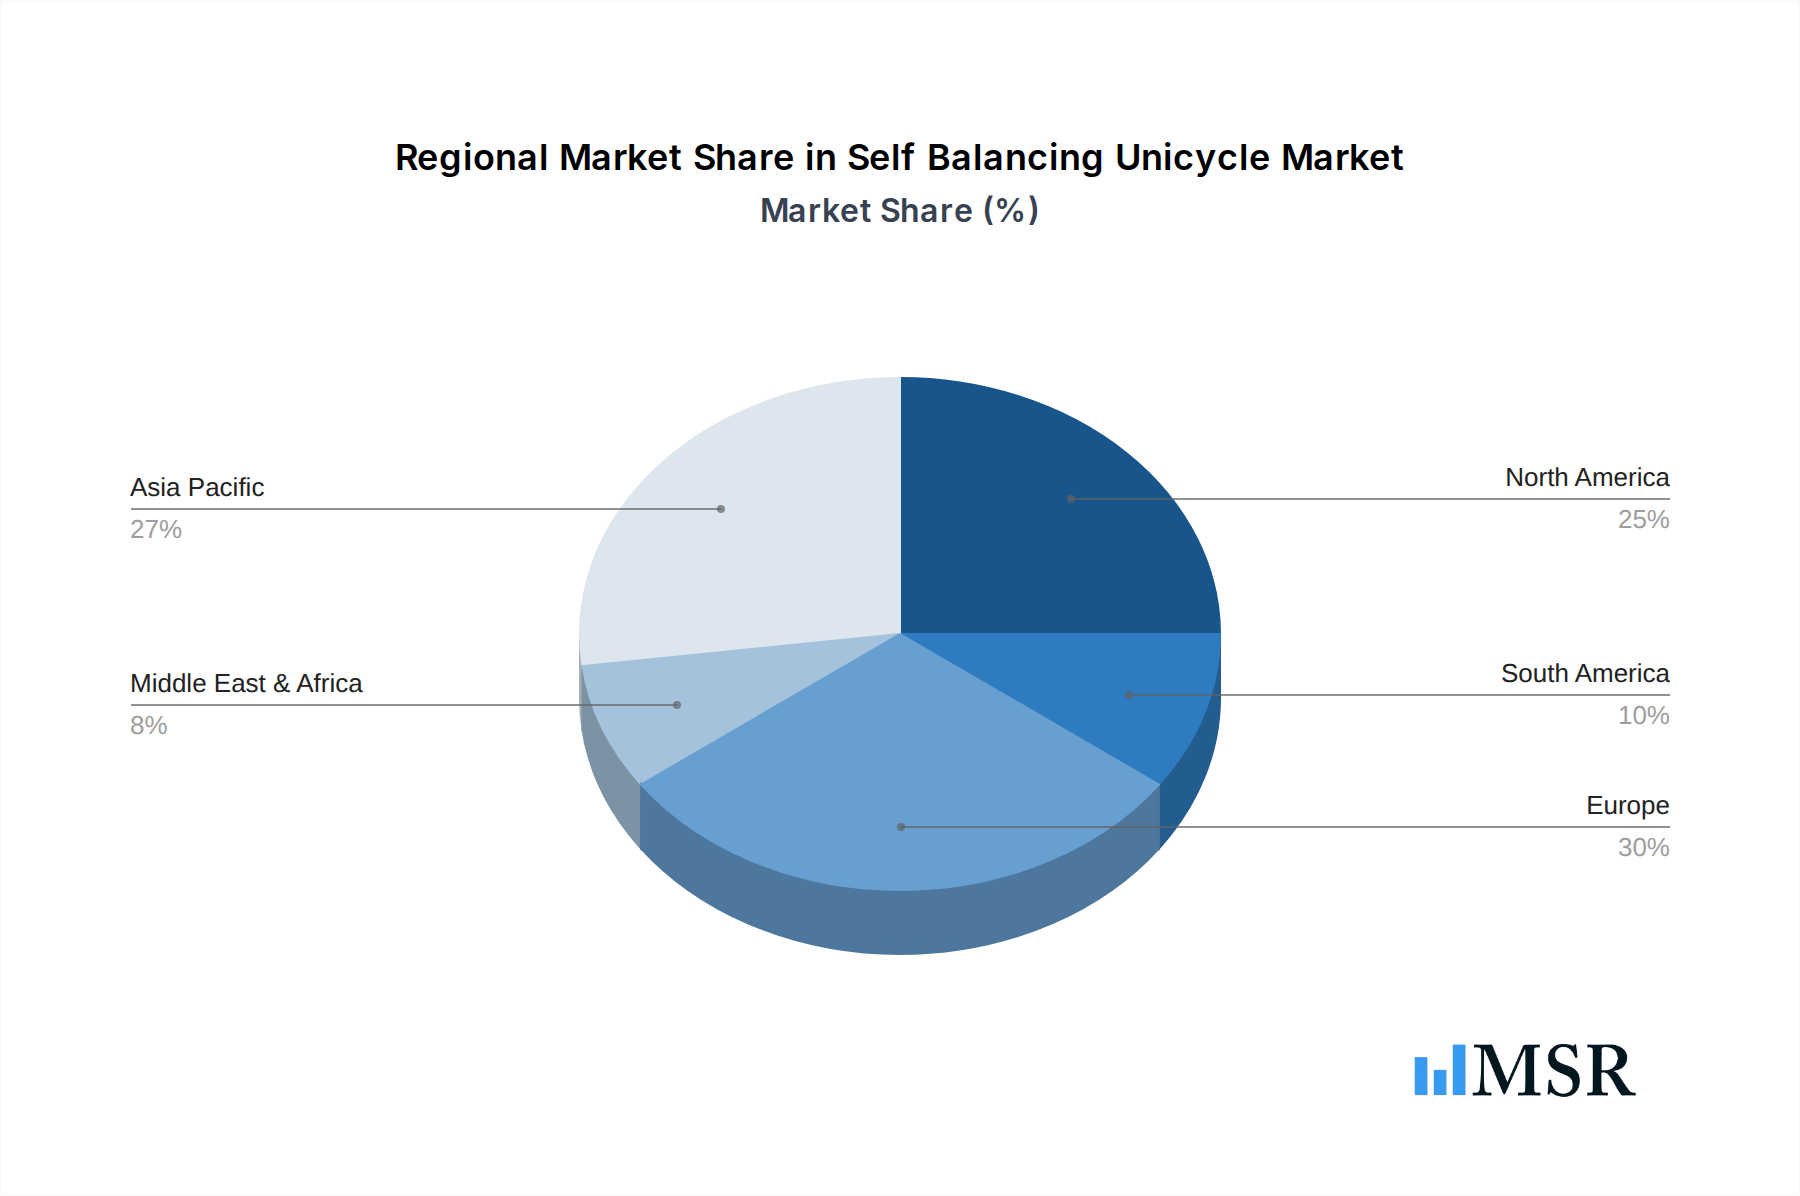
Self Balancing Unicycle Regional Market Share
Geographic Coverage of Self Balancing Unicycle
Self Balancing Unicycle REPORT HIGHLIGHTS
| Aspects | Details |
|---|---|
| Study Period | 2020-2034 |
| Base Year | 2025 |
| Estimated Year | 2026 |
| Forecast Period | 2026-2034 |
| Historical Period | 2020-2025 |
| Growth Rate | CAGR of 4.2% from 2020-2034 |
| Segmentation |
|
Table of Contents
- 1. Introduction
- 1.1. Research Scope
- 1.2. Market Segmentation
- 1.3. Research Methodology
- 1.4. Definitions and Assumptions
- 2. Executive Summary
- 2.1. Introduction
- 3. Market Dynamics
- 3.1. Introduction
- 3.2. Market Drivers
- 3.3. Market Restrains
- 3.4. Market Trends
- 4. Market Factor Analysis
- 4.1. Porters Five Forces
- 4.2. Supply/Value Chain
- 4.3. PESTEL analysis
- 4.4. Market Entropy
- 4.5. Patent/Trademark Analysis
- 5. Global Self Balancing Unicycle Analysis, Insights and Forecast, 2020-2032
- 5.1. Market Analysis, Insights and Forecast - by Application
- 5.1.1. Adults
- 5.1.2. Children
- 5.2. Market Analysis, Insights and Forecast - by Type
- 5.2.1. Below 500W
- 5.2.2. 500-1000W
- 5.2.3. Above 1000W
- 5.3. Market Analysis, Insights and Forecast - by Region
- 5.3.1. North America
- 5.3.2. South America
- 5.3.3. Europe
- 5.3.4. Middle East & Africa
- 5.3.5. Asia Pacific
- 5.1. Market Analysis, Insights and Forecast - by Application
- 6. North America Self Balancing Unicycle Analysis, Insights and Forecast, 2020-2032
- 6.1. Market Analysis, Insights and Forecast - by Application
- 6.1.1. Adults
- 6.1.2. Children
- 6.2. Market Analysis, Insights and Forecast - by Type
- 6.2.1. Below 500W
- 6.2.2. 500-1000W
- 6.2.3. Above 1000W
- 6.1. Market Analysis, Insights and Forecast - by Application
- 7. South America Self Balancing Unicycle Analysis, Insights and Forecast, 2020-2032
- 7.1. Market Analysis, Insights and Forecast - by Application
- 7.1.1. Adults
- 7.1.2. Children
- 7.2. Market Analysis, Insights and Forecast - by Type
- 7.2.1. Below 500W
- 7.2.2. 500-1000W
- 7.2.3. Above 1000W
- 7.1. Market Analysis, Insights and Forecast - by Application
- 8. Europe Self Balancing Unicycle Analysis, Insights and Forecast, 2020-2032
- 8.1. Market Analysis, Insights and Forecast - by Application
- 8.1.1. Adults
- 8.1.2. Children
- 8.2. Market Analysis, Insights and Forecast - by Type
- 8.2.1. Below 500W
- 8.2.2. 500-1000W
- 8.2.3. Above 1000W
- 8.1. Market Analysis, Insights and Forecast - by Application
- 9. Middle East & Africa Self Balancing Unicycle Analysis, Insights and Forecast, 2020-2032
- 9.1. Market Analysis, Insights and Forecast - by Application
- 9.1.1. Adults
- 9.1.2. Children
- 9.2. Market Analysis, Insights and Forecast - by Type
- 9.2.1. Below 500W
- 9.2.2. 500-1000W
- 9.2.3. Above 1000W
- 9.1. Market Analysis, Insights and Forecast - by Application
- 10. Asia Pacific Self Balancing Unicycle Analysis, Insights and Forecast, 2020-2032
- 10.1. Market Analysis, Insights and Forecast - by Application
- 10.1.1. Adults
- 10.1.2. Children
- 10.2. Market Analysis, Insights and Forecast - by Type
- 10.2.1. Below 500W
- 10.2.2. 500-1000W
- 10.2.3. Above 1000W
- 10.1. Market Analysis, Insights and Forecast - by Application
- 11. Competitive Analysis
- 11.1. Global Market Share Analysis 2025
- 11.2. Company Profiles
- 11.2.1 Ninebot
- 11.2.1.1. Overview
- 11.2.1.2. Products
- 11.2.1.3. SWOT Analysis
- 11.2.1.4. Recent Developments
- 11.2.1.5. Financials (Based on Availability)
- 11.2.2 Airwheel
- 11.2.2.1. Overview
- 11.2.2.2. Products
- 11.2.2.3. SWOT Analysis
- 11.2.2.4. Recent Developments
- 11.2.2.5. Financials (Based on Availability)
- 11.2.3 KingSong
- 11.2.3.1. Overview
- 11.2.3.2. Products
- 11.2.3.3. SWOT Analysis
- 11.2.3.4. Recent Developments
- 11.2.3.5. Financials (Based on Availability)
- 11.2.4 Gotway
- 11.2.4.1. Overview
- 11.2.4.2. Products
- 11.2.4.3. SWOT Analysis
- 11.2.4.4. Recent Developments
- 11.2.4.5. Financials (Based on Availability)
- 11.2.5 IPS
- 11.2.5.1. Overview
- 11.2.5.2. Products
- 11.2.5.3. SWOT Analysis
- 11.2.5.4. Recent Developments
- 11.2.5.5. Financials (Based on Availability)
- 11.2.6 Solowheel
- 11.2.6.1. Overview
- 11.2.6.2. Products
- 11.2.6.3. SWOT Analysis
- 11.2.6.4. Recent Developments
- 11.2.6.5. Financials (Based on Availability)
- 11.2.7 Rockwheel
- 11.2.7.1. Overview
- 11.2.7.2. Products
- 11.2.7.3. SWOT Analysis
- 11.2.7.4. Recent Developments
- 11.2.7.5. Financials (Based on Availability)
- 11.2.8 Firewheel
- 11.2.8.1. Overview
- 11.2.8.2. Products
- 11.2.8.3. SWOT Analysis
- 11.2.8.4. Recent Developments
- 11.2.8.5. Financials (Based on Availability)
- 11.2.9 ESWAY
- 11.2.9.1. Overview
- 11.2.9.2. Products
- 11.2.9.3. SWOT Analysis
- 11.2.9.4. Recent Developments
- 11.2.9.5. Financials (Based on Availability)
- 11.2.10 Inmotion
- 11.2.10.1. Overview
- 11.2.10.2. Products
- 11.2.10.3. SWOT Analysis
- 11.2.10.4. Recent Developments
- 11.2.10.5. Financials (Based on Availability)
- 11.2.11 Segway
- 11.2.11.1. Overview
- 11.2.11.2. Products
- 11.2.11.3. SWOT Analysis
- 11.2.11.4. Recent Developments
- 11.2.11.5. Financials (Based on Availability)
- 11.2.12 Fosjoas
- 11.2.12.1. Overview
- 11.2.12.2. Products
- 11.2.12.3. SWOT Analysis
- 11.2.12.4. Recent Developments
- 11.2.12.5. Financials (Based on Availability)
- 11.2.13 MonoRover
- 11.2.13.1. Overview
- 11.2.13.2. Products
- 11.2.13.3. SWOT Analysis
- 11.2.13.4. Recent Developments
- 11.2.13.5. Financials (Based on Availability)
- 11.2.14 F-WHEEL
- 11.2.14.1. Overview
- 11.2.14.2. Products
- 11.2.14.3. SWOT Analysis
- 11.2.14.4. Recent Developments
- 11.2.14.5. Financials (Based on Availability)
- 11.2.1 Ninebot
List of Figures
- Figure 1: Global Self Balancing Unicycle Revenue Breakdown (million, %) by Region 2025 & 2033
- Figure 2: Global Self Balancing Unicycle Volume Breakdown (K, %) by Region 2025 & 2033
- Figure 3: North America Self Balancing Unicycle Revenue (million), by Application 2025 & 2033
- Figure 4: North America Self Balancing Unicycle Volume (K), by Application 2025 & 2033
- Figure 5: North America Self Balancing Unicycle Revenue Share (%), by Application 2025 & 2033
- Figure 6: North America Self Balancing Unicycle Volume Share (%), by Application 2025 & 2033
- Figure 7: North America Self Balancing Unicycle Revenue (million), by Type 2025 & 2033
- Figure 8: North America Self Balancing Unicycle Volume (K), by Type 2025 & 2033
- Figure 9: North America Self Balancing Unicycle Revenue Share (%), by Type 2025 & 2033
- Figure 10: North America Self Balancing Unicycle Volume Share (%), by Type 2025 & 2033
- Figure 11: North America Self Balancing Unicycle Revenue (million), by Country 2025 & 2033
- Figure 12: North America Self Balancing Unicycle Volume (K), by Country 2025 & 2033
- Figure 13: North America Self Balancing Unicycle Revenue Share (%), by Country 2025 & 2033
- Figure 14: North America Self Balancing Unicycle Volume Share (%), by Country 2025 & 2033
- Figure 15: South America Self Balancing Unicycle Revenue (million), by Application 2025 & 2033
- Figure 16: South America Self Balancing Unicycle Volume (K), by Application 2025 & 2033
- Figure 17: South America Self Balancing Unicycle Revenue Share (%), by Application 2025 & 2033
- Figure 18: South America Self Balancing Unicycle Volume Share (%), by Application 2025 & 2033
- Figure 19: South America Self Balancing Unicycle Revenue (million), by Type 2025 & 2033
- Figure 20: South America Self Balancing Unicycle Volume (K), by Type 2025 & 2033
- Figure 21: South America Self Balancing Unicycle Revenue Share (%), by Type 2025 & 2033
- Figure 22: South America Self Balancing Unicycle Volume Share (%), by Type 2025 & 2033
- Figure 23: South America Self Balancing Unicycle Revenue (million), by Country 2025 & 2033
- Figure 24: South America Self Balancing Unicycle Volume (K), by Country 2025 & 2033
- Figure 25: South America Self Balancing Unicycle Revenue Share (%), by Country 2025 & 2033
- Figure 26: South America Self Balancing Unicycle Volume Share (%), by Country 2025 & 2033
- Figure 27: Europe Self Balancing Unicycle Revenue (million), by Application 2025 & 2033
- Figure 28: Europe Self Balancing Unicycle Volume (K), by Application 2025 & 2033
- Figure 29: Europe Self Balancing Unicycle Revenue Share (%), by Application 2025 & 2033
- Figure 30: Europe Self Balancing Unicycle Volume Share (%), by Application 2025 & 2033
- Figure 31: Europe Self Balancing Unicycle Revenue (million), by Type 2025 & 2033
- Figure 32: Europe Self Balancing Unicycle Volume (K), by Type 2025 & 2033
- Figure 33: Europe Self Balancing Unicycle Revenue Share (%), by Type 2025 & 2033
- Figure 34: Europe Self Balancing Unicycle Volume Share (%), by Type 2025 & 2033
- Figure 35: Europe Self Balancing Unicycle Revenue (million), by Country 2025 & 2033
- Figure 36: Europe Self Balancing Unicycle Volume (K), by Country 2025 & 2033
- Figure 37: Europe Self Balancing Unicycle Revenue Share (%), by Country 2025 & 2033
- Figure 38: Europe Self Balancing Unicycle Volume Share (%), by Country 2025 & 2033
- Figure 39: Middle East & Africa Self Balancing Unicycle Revenue (million), by Application 2025 & 2033
- Figure 40: Middle East & Africa Self Balancing Unicycle Volume (K), by Application 2025 & 2033
- Figure 41: Middle East & Africa Self Balancing Unicycle Revenue Share (%), by Application 2025 & 2033
- Figure 42: Middle East & Africa Self Balancing Unicycle Volume Share (%), by Application 2025 & 2033
- Figure 43: Middle East & Africa Self Balancing Unicycle Revenue (million), by Type 2025 & 2033
- Figure 44: Middle East & Africa Self Balancing Unicycle Volume (K), by Type 2025 & 2033
- Figure 45: Middle East & Africa Self Balancing Unicycle Revenue Share (%), by Type 2025 & 2033
- Figure 46: Middle East & Africa Self Balancing Unicycle Volume Share (%), by Type 2025 & 2033
- Figure 47: Middle East & Africa Self Balancing Unicycle Revenue (million), by Country 2025 & 2033
- Figure 48: Middle East & Africa Self Balancing Unicycle Volume (K), by Country 2025 & 2033
- Figure 49: Middle East & Africa Self Balancing Unicycle Revenue Share (%), by Country 2025 & 2033
- Figure 50: Middle East & Africa Self Balancing Unicycle Volume Share (%), by Country 2025 & 2033
- Figure 51: Asia Pacific Self Balancing Unicycle Revenue (million), by Application 2025 & 2033
- Figure 52: Asia Pacific Self Balancing Unicycle Volume (K), by Application 2025 & 2033
- Figure 53: Asia Pacific Self Balancing Unicycle Revenue Share (%), by Application 2025 & 2033
- Figure 54: Asia Pacific Self Balancing Unicycle Volume Share (%), by Application 2025 & 2033
- Figure 55: Asia Pacific Self Balancing Unicycle Revenue (million), by Type 2025 & 2033
- Figure 56: Asia Pacific Self Balancing Unicycle Volume (K), by Type 2025 & 2033
- Figure 57: Asia Pacific Self Balancing Unicycle Revenue Share (%), by Type 2025 & 2033
- Figure 58: Asia Pacific Self Balancing Unicycle Volume Share (%), by Type 2025 & 2033
- Figure 59: Asia Pacific Self Balancing Unicycle Revenue (million), by Country 2025 & 2033
- Figure 60: Asia Pacific Self Balancing Unicycle Volume (K), by Country 2025 & 2033
- Figure 61: Asia Pacific Self Balancing Unicycle Revenue Share (%), by Country 2025 & 2033
- Figure 62: Asia Pacific Self Balancing Unicycle Volume Share (%), by Country 2025 & 2033
List of Tables
- Table 1: Global Self Balancing Unicycle Revenue million Forecast, by Application 2020 & 2033
- Table 2: Global Self Balancing Unicycle Volume K Forecast, by Application 2020 & 2033
- Table 3: Global Self Balancing Unicycle Revenue million Forecast, by Type 2020 & 2033
- Table 4: Global Self Balancing Unicycle Volume K Forecast, by Type 2020 & 2033
- Table 5: Global Self Balancing Unicycle Revenue million Forecast, by Region 2020 & 2033
- Table 6: Global Self Balancing Unicycle Volume K Forecast, by Region 2020 & 2033
- Table 7: Global Self Balancing Unicycle Revenue million Forecast, by Application 2020 & 2033
- Table 8: Global Self Balancing Unicycle Volume K Forecast, by Application 2020 & 2033
- Table 9: Global Self Balancing Unicycle Revenue million Forecast, by Type 2020 & 2033
- Table 10: Global Self Balancing Unicycle Volume K Forecast, by Type 2020 & 2033
- Table 11: Global Self Balancing Unicycle Revenue million Forecast, by Country 2020 & 2033
- Table 12: Global Self Balancing Unicycle Volume K Forecast, by Country 2020 & 2033
- Table 13: United States Self Balancing Unicycle Revenue (million) Forecast, by Application 2020 & 2033
- Table 14: United States Self Balancing Unicycle Volume (K) Forecast, by Application 2020 & 2033
- Table 15: Canada Self Balancing Unicycle Revenue (million) Forecast, by Application 2020 & 2033
- Table 16: Canada Self Balancing Unicycle Volume (K) Forecast, by Application 2020 & 2033
- Table 17: Mexico Self Balancing Unicycle Revenue (million) Forecast, by Application 2020 & 2033
- Table 18: Mexico Self Balancing Unicycle Volume (K) Forecast, by Application 2020 & 2033
- Table 19: Global Self Balancing Unicycle Revenue million Forecast, by Application 2020 & 2033
- Table 20: Global Self Balancing Unicycle Volume K Forecast, by Application 2020 & 2033
- Table 21: Global Self Balancing Unicycle Revenue million Forecast, by Type 2020 & 2033
- Table 22: Global Self Balancing Unicycle Volume K Forecast, by Type 2020 & 2033
- Table 23: Global Self Balancing Unicycle Revenue million Forecast, by Country 2020 & 2033
- Table 24: Global Self Balancing Unicycle Volume K Forecast, by Country 2020 & 2033
- Table 25: Brazil Self Balancing Unicycle Revenue (million) Forecast, by Application 2020 & 2033
- Table 26: Brazil Self Balancing Unicycle Volume (K) Forecast, by Application 2020 & 2033
- Table 27: Argentina Self Balancing Unicycle Revenue (million) Forecast, by Application 2020 & 2033
- Table 28: Argentina Self Balancing Unicycle Volume (K) Forecast, by Application 2020 & 2033
- Table 29: Rest of South America Self Balancing Unicycle Revenue (million) Forecast, by Application 2020 & 2033
- Table 30: Rest of South America Self Balancing Unicycle Volume (K) Forecast, by Application 2020 & 2033
- Table 31: Global Self Balancing Unicycle Revenue million Forecast, by Application 2020 & 2033
- Table 32: Global Self Balancing Unicycle Volume K Forecast, by Application 2020 & 2033
- Table 33: Global Self Balancing Unicycle Revenue million Forecast, by Type 2020 & 2033
- Table 34: Global Self Balancing Unicycle Volume K Forecast, by Type 2020 & 2033
- Table 35: Global Self Balancing Unicycle Revenue million Forecast, by Country 2020 & 2033
- Table 36: Global Self Balancing Unicycle Volume K Forecast, by Country 2020 & 2033
- Table 37: United Kingdom Self Balancing Unicycle Revenue (million) Forecast, by Application 2020 & 2033
- Table 38: United Kingdom Self Balancing Unicycle Volume (K) Forecast, by Application 2020 & 2033
- Table 39: Germany Self Balancing Unicycle Revenue (million) Forecast, by Application 2020 & 2033
- Table 40: Germany Self Balancing Unicycle Volume (K) Forecast, by Application 2020 & 2033
- Table 41: France Self Balancing Unicycle Revenue (million) Forecast, by Application 2020 & 2033
- Table 42: France Self Balancing Unicycle Volume (K) Forecast, by Application 2020 & 2033
- Table 43: Italy Self Balancing Unicycle Revenue (million) Forecast, by Application 2020 & 2033
- Table 44: Italy Self Balancing Unicycle Volume (K) Forecast, by Application 2020 & 2033
- Table 45: Spain Self Balancing Unicycle Revenue (million) Forecast, by Application 2020 & 2033
- Table 46: Spain Self Balancing Unicycle Volume (K) Forecast, by Application 2020 & 2033
- Table 47: Russia Self Balancing Unicycle Revenue (million) Forecast, by Application 2020 & 2033
- Table 48: Russia Self Balancing Unicycle Volume (K) Forecast, by Application 2020 & 2033
- Table 49: Benelux Self Balancing Unicycle Revenue (million) Forecast, by Application 2020 & 2033
- Table 50: Benelux Self Balancing Unicycle Volume (K) Forecast, by Application 2020 & 2033
- Table 51: Nordics Self Balancing Unicycle Revenue (million) Forecast, by Application 2020 & 2033
- Table 52: Nordics Self Balancing Unicycle Volume (K) Forecast, by Application 2020 & 2033
- Table 53: Rest of Europe Self Balancing Unicycle Revenue (million) Forecast, by Application 2020 & 2033
- Table 54: Rest of Europe Self Balancing Unicycle Volume (K) Forecast, by Application 2020 & 2033
- Table 55: Global Self Balancing Unicycle Revenue million Forecast, by Application 2020 & 2033
- Table 56: Global Self Balancing Unicycle Volume K Forecast, by Application 2020 & 2033
- Table 57: Global Self Balancing Unicycle Revenue million Forecast, by Type 2020 & 2033
- Table 58: Global Self Balancing Unicycle Volume K Forecast, by Type 2020 & 2033
- Table 59: Global Self Balancing Unicycle Revenue million Forecast, by Country 2020 & 2033
- Table 60: Global Self Balancing Unicycle Volume K Forecast, by Country 2020 & 2033
- Table 61: Turkey Self Balancing Unicycle Revenue (million) Forecast, by Application 2020 & 2033
- Table 62: Turkey Self Balancing Unicycle Volume (K) Forecast, by Application 2020 & 2033
- Table 63: Israel Self Balancing Unicycle Revenue (million) Forecast, by Application 2020 & 2033
- Table 64: Israel Self Balancing Unicycle Volume (K) Forecast, by Application 2020 & 2033
- Table 65: GCC Self Balancing Unicycle Revenue (million) Forecast, by Application 2020 & 2033
- Table 66: GCC Self Balancing Unicycle Volume (K) Forecast, by Application 2020 & 2033
- Table 67: North Africa Self Balancing Unicycle Revenue (million) Forecast, by Application 2020 & 2033
- Table 68: North Africa Self Balancing Unicycle Volume (K) Forecast, by Application 2020 & 2033
- Table 69: South Africa Self Balancing Unicycle Revenue (million) Forecast, by Application 2020 & 2033
- Table 70: South Africa Self Balancing Unicycle Volume (K) Forecast, by Application 2020 & 2033
- Table 71: Rest of Middle East & Africa Self Balancing Unicycle Revenue (million) Forecast, by Application 2020 & 2033
- Table 72: Rest of Middle East & Africa Self Balancing Unicycle Volume (K) Forecast, by Application 2020 & 2033
- Table 73: Global Self Balancing Unicycle Revenue million Forecast, by Application 2020 & 2033
- Table 74: Global Self Balancing Unicycle Volume K Forecast, by Application 2020 & 2033
- Table 75: Global Self Balancing Unicycle Revenue million Forecast, by Type 2020 & 2033
- Table 76: Global Self Balancing Unicycle Volume K Forecast, by Type 2020 & 2033
- Table 77: Global Self Balancing Unicycle Revenue million Forecast, by Country 2020 & 2033
- Table 78: Global Self Balancing Unicycle Volume K Forecast, by Country 2020 & 2033
- Table 79: China Self Balancing Unicycle Revenue (million) Forecast, by Application 2020 & 2033
- Table 80: China Self Balancing Unicycle Volume (K) Forecast, by Application 2020 & 2033
- Table 81: India Self Balancing Unicycle Revenue (million) Forecast, by Application 2020 & 2033
- Table 82: India Self Balancing Unicycle Volume (K) Forecast, by Application 2020 & 2033
- Table 83: Japan Self Balancing Unicycle Revenue (million) Forecast, by Application 2020 & 2033
- Table 84: Japan Self Balancing Unicycle Volume (K) Forecast, by Application 2020 & 2033
- Table 85: South Korea Self Balancing Unicycle Revenue (million) Forecast, by Application 2020 & 2033
- Table 86: South Korea Self Balancing Unicycle Volume (K) Forecast, by Application 2020 & 2033
- Table 87: ASEAN Self Balancing Unicycle Revenue (million) Forecast, by Application 2020 & 2033
- Table 88: ASEAN Self Balancing Unicycle Volume (K) Forecast, by Application 2020 & 2033
- Table 89: Oceania Self Balancing Unicycle Revenue (million) Forecast, by Application 2020 & 2033
- Table 90: Oceania Self Balancing Unicycle Volume (K) Forecast, by Application 2020 & 2033
- Table 91: Rest of Asia Pacific Self Balancing Unicycle Revenue (million) Forecast, by Application 2020 & 2033
- Table 92: Rest of Asia Pacific Self Balancing Unicycle Volume (K) Forecast, by Application 2020 & 2033
Frequently Asked Questions
1. What is the projected Compound Annual Growth Rate (CAGR) of the Self Balancing Unicycle?
The projected CAGR is approximately 4.2%.
2. Which companies are prominent players in the Self Balancing Unicycle?
Key companies in the market include Ninebot, Airwheel, KingSong, Gotway, IPS, Solowheel, Rockwheel, Firewheel, ESWAY, Inmotion, Segway, Fosjoas, MonoRover, F-WHEEL.
3. What are the main segments of the Self Balancing Unicycle?
The market segments include Application, Type.
4. Can you provide details about the market size?
The market size is estimated to be USD 179 million as of 2022.
5. What are some drivers contributing to market growth?
N/A
6. What are the notable trends driving market growth?
N/A
7. Are there any restraints impacting market growth?
N/A
8. Can you provide examples of recent developments in the market?
N/A
9. What pricing options are available for accessing the report?
Pricing options include single-user, multi-user, and enterprise licenses priced at USD 3950.00, USD 5925.00, and USD 7900.00 respectively.
10. Is the market size provided in terms of value or volume?
The market size is provided in terms of value, measured in million and volume, measured in K.
11. Are there any specific market keywords associated with the report?
Yes, the market keyword associated with the report is "Self Balancing Unicycle," which aids in identifying and referencing the specific market segment covered.
12. How do I determine which pricing option suits my needs best?
The pricing options vary based on user requirements and access needs. Individual users may opt for single-user licenses, while businesses requiring broader access may choose multi-user or enterprise licenses for cost-effective access to the report.
13. Are there any additional resources or data provided in the Self Balancing Unicycle report?
While the report offers comprehensive insights, it's advisable to review the specific contents or supplementary materials provided to ascertain if additional resources or data are available.
14. How can I stay updated on further developments or reports in the Self Balancing Unicycle?
To stay informed about further developments, trends, and reports in the Self Balancing Unicycle, consider subscribing to industry newsletters, following relevant companies and organizations, or regularly checking reputable industry news sources and publications.
Methodology
Step 1 - Identification of Relevant Samples Size from Population Database


Step 2 - Approaches for Defining Global Market Size (Value, Volume* & Price*)

Note*: In applicable scenarios
Step 3 - Data Sources
Primary Research
- Web Analytics
- Survey Reports
- Research Institute
- Latest Research Reports
- Opinion Leaders
Secondary Research
- Annual Reports
- White Paper
- Latest Press Release
- Industry Association
- Paid Database
- Investor Presentations

Step 4 - Data Triangulation
Involves using different sources of information in order to increase the validity of a study
These sources are likely to be stakeholders in a program - participants, other researchers, program staff, other community members, and so on.
Then we put all data in single framework & apply various statistical tools to find out the dynamic on the market.
During the analysis stage, feedback from the stakeholder groups would be compared to determine areas of agreement as well as areas of divergence