

Key Insights
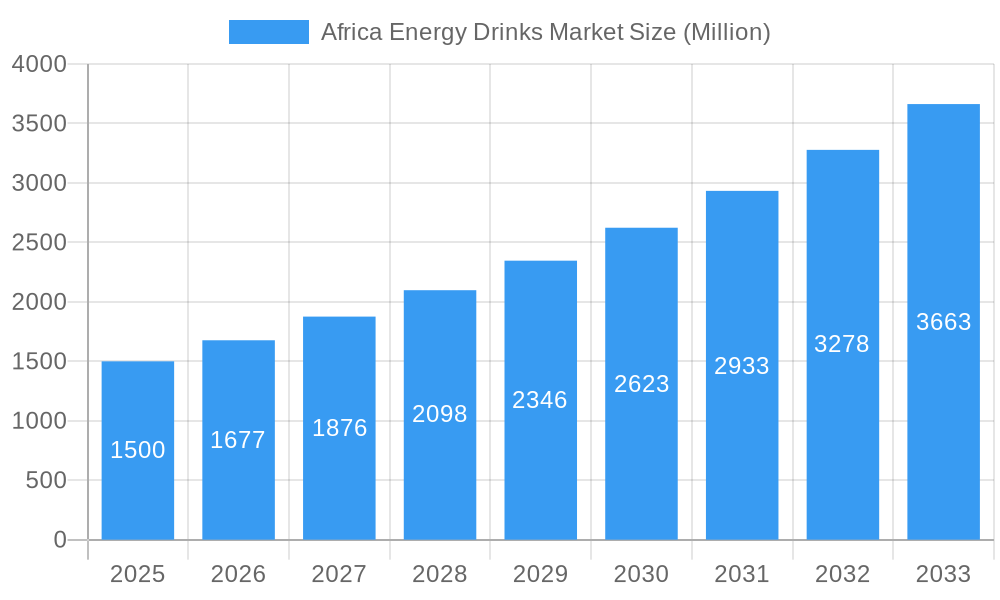
The African energy drinks market, valued at approximately 3.65 billion in 2025, is projected for robust expansion with a Compound Annual Growth Rate (CAGR) of 10.19% from 2025 to 2033. This growth is propelled by a youthful, increasingly Westernized population seeking convenient energy solutions. Rapid urbanization and rising disposable incomes further stimulate consumption. The market benefits from diversified product innovation, including natural/organic and sugar-free options addressing health-conscious consumers, alongside the enduring appeal of traditional formulations. South Africa, Nigeria, and Egypt lead the market, driven by strong economies and established distribution. Significant growth potential exists across other African nations as market awareness and accessibility expand. Key global players such as Red Bull, Coca-Cola, and PepsiCo, alongside regional brands like Aje Group and Mutalo Group, foster a dynamic competitive environment. Challenges include raw material price volatility and potential regulatory shifts concerning sugar content. Despite these, the African energy drinks market demonstrates a positive long-term outlook, supported by sustained economic development and evolving consumer demands.
Africa Energy Drinks Market Market Size (In Billion)
Market segmentation reveals a rising preference for healthier alternatives, evident in the growing popularity of sugar-free and natural/organic energy drinks, though traditional formulations retain a significant share. Both on-trade and off-trade distribution channels are substantial contributors, indicating broad product accessibility. Packaging trends are likely to align with global preferences, favoring cost-effective and recyclable PET bottles, while glass bottles and metal cans cater to premium branding and perceived quality. The continued growth in the African energy drinks market presents substantial opportunities for both established and emerging players, necessitating strategic product innovation, efficient distribution, and competitive pricing tailored to the regional landscape.
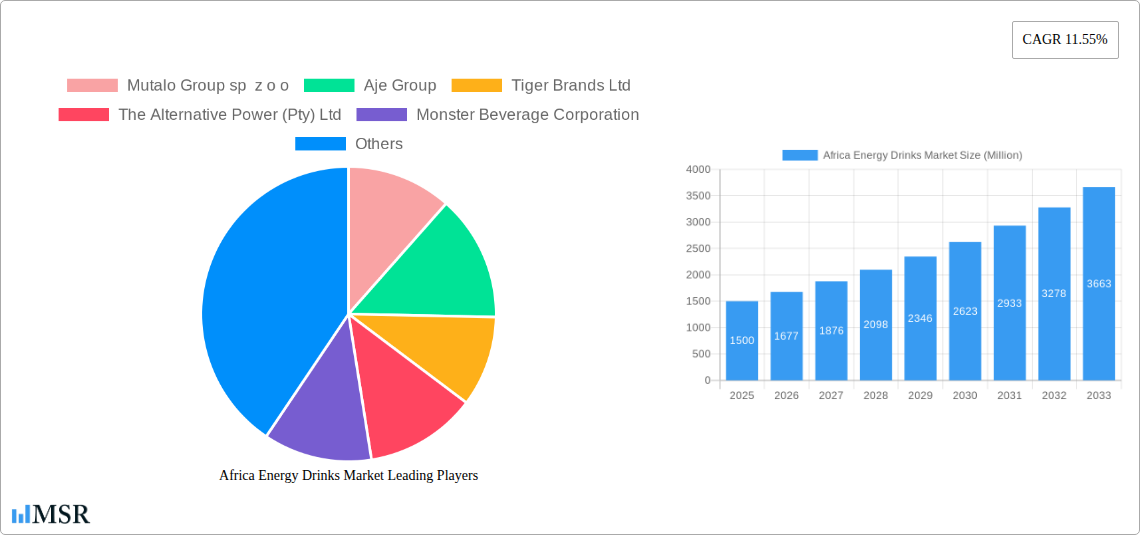
Africa Energy Drinks Market Company Market Share
Africa Energy Drinks Market: A Comprehensive Report (2019-2033)
This in-depth report provides a comprehensive analysis of the Africa energy drinks market, covering the period from 2019 to 2033. With a base year of 2025 and a forecast period spanning 2025-2033, this study offers invaluable insights for industry stakeholders, investors, and businesses seeking to navigate this dynamic market. The report delves into market dynamics, key segments, leading players like The Coca-Cola Company, Red Bull GmbH, and PepsiCo Inc., and emerging trends shaping the future of the African energy drink landscape. The market is projected to reach xx Million by 2033, demonstrating significant growth potential.
Africa Energy Drinks Market Concentration & Dynamics
The Africa energy drinks market exhibits a moderately concentrated structure, with a handful of multinational players holding significant market share alongside a growing number of regional and local brands. Market share data for 2024 suggests that The Coca-Cola Company and Red Bull GmbH collectively hold approximately xx% of the market, while regional players such as Aje Group and Mutalo Group sp z o o command a combined xx%. Innovation is crucial, driven by the introduction of new flavors, functional ingredients, and sustainable packaging options.
Regulatory frameworks vary across African countries, impacting product labeling, taxation, and marketing strategies. The presence of substitute products, such as fruit juices and sports drinks, presents competitive challenges. Consumer trends favor healthier options, including sugar-free and natural energy drinks. M&A activity has been moderate, with a recorded xx M&A deals in the past five years, primarily focused on expanding distribution networks and acquiring local brands.
- Market Concentration: Moderately concentrated, with multinational and regional players.
- Innovation Ecosystem: Strong focus on new flavors, functional ingredients, and sustainable packaging.
- Regulatory Frameworks: Vary across countries, impacting product regulations and marketing.
- Substitute Products: Fruit juices and sports drinks pose competition.
- End-User Trends: Growing preference for healthier, sugar-free, and natural options.
- M&A Activity: Moderate, with xx deals in the past five years, primarily focused on expansion and acquisition.
Africa Energy Drinks Market Industry Insights & Trends
The Africa energy drinks market is experiencing robust growth, driven by rising disposable incomes, urbanization, a burgeoning youth population, and changing lifestyle preferences. The market size in 2024 was estimated at xx Million, and is projected to reach xx Million by 2033, exhibiting a CAGR of xx%. Key growth drivers include increased consumer spending, the rising popularity of energy drinks amongst young adults, and the expanding distribution networks across the continent. Technological advancements are influencing production efficiency, marketing strategies, and product innovation. Evolving consumer behaviors, such as a growing demand for healthier and more sustainable energy drink options, are reshaping the market landscape.
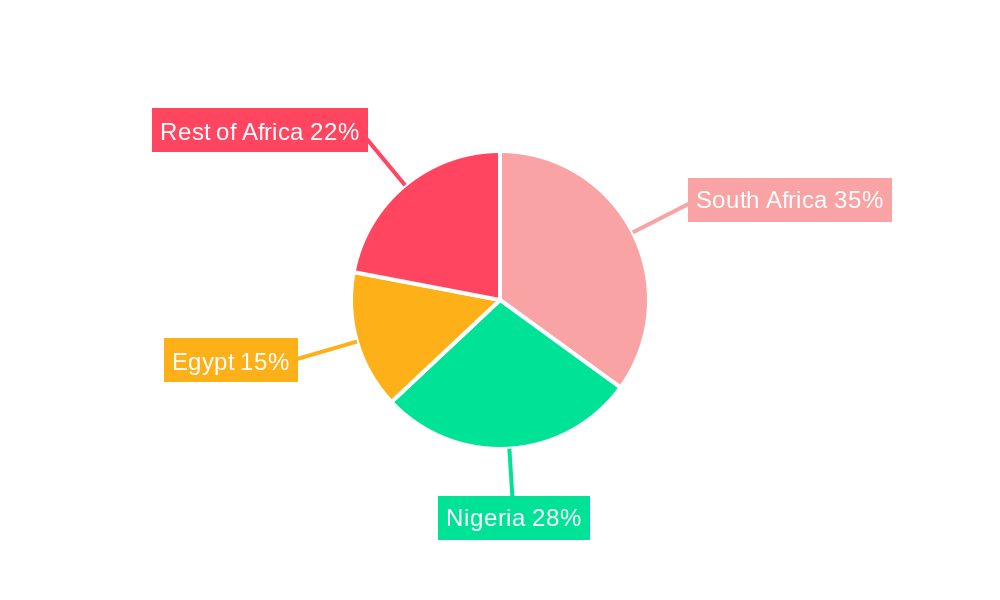
Key Markets & Segments Leading Africa Energy Drinks Market
South Africa, Nigeria, and Egypt represent the leading national markets, accounting for a significant portion of the overall market volume. The PET Bottles segment dominates the packaging type category, driven by its cost-effectiveness and convenience. The Off-trade distribution channel holds the largest share, reflecting the widespread availability of energy drinks in retail stores and supermarkets. Traditional energy drinks currently comprise the largest soft drink type segment. Growth drivers vary by region:
South Africa: Strong economic growth, established retail infrastructure, and a sophisticated consumer base.
Nigeria: Large and rapidly expanding population, increasing disposable incomes, and a growing demand for convenient beverages.
Egypt: Expanding middle class, increasing urbanization, and rising consumption of convenience foods and beverages.
Rest of Africa: Diverse market dynamics with significant growth potential driven by increasing urbanization and economic development.
- Dominant Region: South Africa followed by Nigeria and Egypt
- Dominant Packaging Type: PET Bottles
- Dominant Distribution Channel: Off-trade
- Dominant Soft Drink Type: Traditional Energy Drinks
Africa Energy Drinks Market Product Developments
Recent product innovations highlight a trend toward healthier and more diverse product offerings. Companies are introducing sugar-free and low-calorie options, natural and organic energy drinks, and functional energy drinks with added vitamins and antioxidants. Technological advancements in manufacturing processes enhance efficiency and reduce production costs. The competitive edge lies in delivering innovative product formulations, appealing branding, and efficient distribution networks.
Challenges in the Africa Energy Drinks Market Market
Challenges include inconsistent regulatory frameworks across different African countries, creating difficulties in standardizing product development and marketing. Supply chain complexities and infrastructure limitations can impede efficient distribution, especially in remote areas. Intense competition from established multinational brands and the emergence of local players further exert pressure on market participants. These challenges can lead to higher production costs and reduced profit margins.
Forces Driving Africa Energy Drinks Market Growth
The Africa energy drinks market is propelled by several key factors: rapid urbanization leading to increased consumption of convenience products; rising disposable incomes empowering a greater number of consumers to purchase non-essential products; and an increasingly youthful population. The expanding retail infrastructure across Africa improves product accessibility, driving higher sales volume. Supportive government policies focused on boosting local industries also contribute to market growth.
Long-Term Growth Catalysts in Africa Energy Drinks Market
Long-term growth will depend on the adoption of innovative technologies, strategic partnerships with local distributors, and successful expansion into new and underserved markets. The development of healthier and more sustainable products will play a key role in attracting health-conscious consumers. Continued investment in research and development will be crucial for maintaining a competitive edge.
Emerging Opportunities in Africa Energy Drinks Market
Emerging opportunities lie in penetrating underserved rural markets, leveraging e-commerce platforms for distribution, and introducing customized products to cater to specific regional tastes and preferences. The growing demand for healthier options creates opportunities for organic, natural, and sugar-free energy drinks. Collaborations with local influencers and strategic partnerships with retailers will expand reach and market penetration.
Leading Players in the Africa Energy Drinks Market Sector
- Mutalo Group sp z o o
- Aje Group
- Tiger Brands Ltd
- The Alternative Power (Pty) Ltd
- Monster Beverage Corporation
- PepsiCo Inc
- Mofaya Beverage Company (PTY) Ltd
- S Spitz GmbH
- Suntory Holdings Limited
- Red Bull GmbH
- Halewood International South Africa (Pty) Ltd
- The Coca-Cola Company
Key Milestones in Africa Energy Drinks Market Industry
- September 2023: Switch Energy Drink launched a limited-edition flavor for South African Heritage Day, enhancing brand loyalty and market visibility.
- October 2023: Switch Energy Drink introduced three new limited-edition flavors (Sour Worms, Naartjie & Grape, and Kiwi, Mango & Strawberry), expanding its product portfolio and attracting new consumers.
- October 2023: Miss South Africa Natasha Joubert launched a Berry Queen-flavored energy drink under the MoFaya brand, leveraging celebrity endorsement to boost brand awareness and sales.
Strategic Outlook for Africa Energy Drinks Market Market
The Africa energy drinks market presents significant growth potential in the coming years, driven by sustained economic development, a young and growing population, and evolving consumer preferences. Strategic opportunities exist in developing innovative products, enhancing distribution networks, and building strong brand loyalty. Companies that effectively adapt to changing consumer demands and navigate the unique challenges of the African market will be well-positioned for long-term success.
Africa Energy Drinks Market Segmentation
-
1. Soft Drink Type
- 1.1. Energy Shots
- 1.2. Natural/Organic Energy Drinks
- 1.3. Sugar-free or Low-calories Energy Drinks
- 1.4. Traditional Energy Drinks
- 1.5. Other Energy Drinks
-
2. Packaging Type
- 2.1. Glass Bottles
- 2.2. Metal Can
- 2.3. PET Bottles
-
3. Distribution Channel
-
3.1. Off-trade
- 3.1.1. Convenience Stores
- 3.1.2. Online Retail
- 3.1.3. Supermarket/Hypermarket
- 3.1.4. Others
- 3.2. On-trade
-
3.1. Off-trade
Africa Energy Drinks Market Segmentation By Geography
-
1. Africa
- 1.1. Nigeria
- 1.2. South Africa
- 1.3. Egypt
- 1.4. Kenya
- 1.5. Ethiopia
- 1.6. Morocco
- 1.7. Ghana
- 1.8. Algeria
- 1.9. Tanzania
- 1.10. Ivory Coast
Africa Energy Drinks Market Regional Market Share
Geographic Coverage of Africa Energy Drinks Market
Africa Energy Drinks Market REPORT HIGHLIGHTS
| Aspects | Details |
|---|---|
| Study Period | 2020-2034 |
| Base Year | 2025 |
| Estimated Year | 2026 |
| Forecast Period | 2026-2034 |
| Historical Period | 2020-2025 |
| Growth Rate | CAGR of 10.19% from 2020-2034 |
| Segmentation |
|
Table of Contents
- 1. Introduction
- 1.1. Research Scope
- 1.2. Market Segmentation
- 1.3. Research Objective
- 1.4. Definitions and Assumptions
- 2. Executive Summary
- 2.1. Market Snapshot
- 3. Market Dynamics
- 3.1. Market Drivers
- 3.2. Market Restrains
- 3.3. Market Trends
- 3.4. Market Opportunities
- 4. Market Factor Analysis
- 4.1. Porters Five Forces
- 4.1.1. Bargaining Power of Suppliers
- 4.1.2. Bargaining Power of Buyers
- 4.1.3. Threat of New Entrants
- 4.1.4. Threat of Substitutes
- 4.1.5. Competitive Rivalry
- 4.2. PESTEL analysis
- 4.3. BCG Analysis
- 4.3.1. Stars (High Growth, High Market Share)
- 4.3.2. Cash Cows (Low Growth, High Market Share)
- 4.3.3. Question Mark (High Growth, Low Market Share)
- 4.3.4. Dogs (Low Growth, Low Market Share)
- 4.4. Ansoff Matrix Analysis
- 4.5. Supply Chain Analysis
- 4.6. Regulatory Landscape
- 4.7. Current Market Potential and Opportunity Assessment (TAM–SAM–SOM Framework)
- 4.8. MSR Analyst Note
- 4.1. Porters Five Forces
- 5. Market Analysis, Insights and Forecast 2021-2033
- 5.1. Market Analysis, Insights and Forecast - by Soft Drink Type
- 5.1.1. Energy Shots
- 5.1.2. Natural/Organic Energy Drinks
- 5.1.3. Sugar-free or Low-calories Energy Drinks
- 5.1.4. Traditional Energy Drinks
- 5.1.5. Other Energy Drinks
- 5.2. Market Analysis, Insights and Forecast - by Packaging Type
- 5.2.1. Glass Bottles
- 5.2.2. Metal Can
- 5.2.3. PET Bottles
- 5.3. Market Analysis, Insights and Forecast - by Distribution Channel
- 5.3.1. Off-trade
- 5.3.1.1. Convenience Stores
- 5.3.1.2. Online Retail
- 5.3.1.3. Supermarket/Hypermarket
- 5.3.1.4. Others
- 5.3.2. On-trade
- 5.3.1. Off-trade
- 5.4. Market Analysis, Insights and Forecast - by Region
- 5.4.1. Africa
- 5.1. Market Analysis, Insights and Forecast - by Soft Drink Type
- 6. Africa Energy Drinks Market Analysis, Insights and Forecast, 2021-2033
- 6.1. Market Analysis, Insights and Forecast - by Soft Drink Type
- 6.1.1. Energy Shots
- 6.1.2. Natural/Organic Energy Drinks
- 6.1.3. Sugar-free or Low-calories Energy Drinks
- 6.1.4. Traditional Energy Drinks
- 6.1.5. Other Energy Drinks
- 6.2. Market Analysis, Insights and Forecast - by Packaging Type
- 6.2.1. Glass Bottles
- 6.2.2. Metal Can
- 6.2.3. PET Bottles
- 6.3. Market Analysis, Insights and Forecast - by Distribution Channel
- 6.3.1. Off-trade
- 6.3.1.1. Convenience Stores
- 6.3.1.2. Online Retail
- 6.3.1.3. Supermarket/Hypermarket
- 6.3.1.4. Others
- 6.3.2. On-trade
- 6.3.1. Off-trade
- 6.1. Market Analysis, Insights and Forecast - by Soft Drink Type
- 7. Competitive Analysis
- 7.1. Company Profiles
- 7.1.1 Mutalo Group sp z o o
- 7.1.1.1. Company Overview
- 7.1.1.2. Products
- 7.1.1.3. Company Financials
- 7.1.1.4. SWOT Analysis
- 7.1.2 Aje Group
- 7.1.2.1. Company Overview
- 7.1.2.2. Products
- 7.1.2.3. Company Financials
- 7.1.2.4. SWOT Analysis
- 7.1.3 Tiger Brands Ltd
- 7.1.3.1. Company Overview
- 7.1.3.2. Products
- 7.1.3.3. Company Financials
- 7.1.3.4. SWOT Analysis
- 7.1.4 The Alternative Power (Pty) Ltd
- 7.1.4.1. Company Overview
- 7.1.4.2. Products
- 7.1.4.3. Company Financials
- 7.1.4.4. SWOT Analysis
- 7.1.5 Monster Beverage Corporation
- 7.1.5.1. Company Overview
- 7.1.5.2. Products
- 7.1.5.3. Company Financials
- 7.1.5.4. SWOT Analysis
- 7.1.6 PepsiCo Inc
- 7.1.6.1. Company Overview
- 7.1.6.2. Products
- 7.1.6.3. Company Financials
- 7.1.6.4. SWOT Analysis
- 7.1.7 Mofaya Beverage Company (PTY) Ltd
- 7.1.7.1. Company Overview
- 7.1.7.2. Products
- 7.1.7.3. Company Financials
- 7.1.7.4. SWOT Analysis
- 7.1.8 S Spitz GmbH
- 7.1.8.1. Company Overview
- 7.1.8.2. Products
- 7.1.8.3. Company Financials
- 7.1.8.4. SWOT Analysis
- 7.1.9 Suntory Holdings Limited
- 7.1.9.1. Company Overview
- 7.1.9.2. Products
- 7.1.9.3. Company Financials
- 7.1.9.4. SWOT Analysis
- 7.1.10 Red Bull GmbH
- 7.1.10.1. Company Overview
- 7.1.10.2. Products
- 7.1.10.3. Company Financials
- 7.1.10.4. SWOT Analysis
- 7.1.11 Halewood International South Africa (Pty) Ltd
- 7.1.11.1. Company Overview
- 7.1.11.2. Products
- 7.1.11.3. Company Financials
- 7.1.11.4. SWOT Analysis
- 7.1.12 The Coca-Cola Company
- 7.1.12.1. Company Overview
- 7.1.12.2. Products
- 7.1.12.3. Company Financials
- 7.1.12.4. SWOT Analysis
- 7.1.1 Mutalo Group sp z o o
- 7.2. Market Entropy
- 7.2.1 Company's Key Areas Served
- 7.2.2 Recent Developments
- 7.3. Company Market Share Analysis 2025
- 7.3.1 Top 5 Companies Market Share Analysis
- 7.3.2 Top 3 Companies Market Share Analysis
- 7.4. List of Potential Customers
- 8. Research Methodology
List of Figures
- Figure 1: Africa Energy Drinks Market Revenue Breakdown (billion, %) by Product 2025 & 2033
- Figure 2: Africa Energy Drinks Market Share (%) by Company 2025
List of Tables
- Table 1: Africa Energy Drinks Market Revenue billion Forecast, by Soft Drink Type 2020 & 2033
- Table 2: Africa Energy Drinks Market Volume K Tons Forecast, by Soft Drink Type 2020 & 2033
- Table 3: Africa Energy Drinks Market Revenue billion Forecast, by Packaging Type 2020 & 2033
- Table 4: Africa Energy Drinks Market Volume K Tons Forecast, by Packaging Type 2020 & 2033
- Table 5: Africa Energy Drinks Market Revenue billion Forecast, by Distribution Channel 2020 & 2033
- Table 6: Africa Energy Drinks Market Volume K Tons Forecast, by Distribution Channel 2020 & 2033
- Table 7: Africa Energy Drinks Market Revenue billion Forecast, by Region 2020 & 2033
- Table 8: Africa Energy Drinks Market Volume K Tons Forecast, by Region 2020 & 2033
- Table 9: Africa Energy Drinks Market Revenue billion Forecast, by Soft Drink Type 2020 & 2033
- Table 10: Africa Energy Drinks Market Volume K Tons Forecast, by Soft Drink Type 2020 & 2033
- Table 11: Africa Energy Drinks Market Revenue billion Forecast, by Packaging Type 2020 & 2033
- Table 12: Africa Energy Drinks Market Volume K Tons Forecast, by Packaging Type 2020 & 2033
- Table 13: Africa Energy Drinks Market Revenue billion Forecast, by Distribution Channel 2020 & 2033
- Table 14: Africa Energy Drinks Market Volume K Tons Forecast, by Distribution Channel 2020 & 2033
- Table 15: Africa Energy Drinks Market Revenue billion Forecast, by Country 2020 & 2033
- Table 16: Africa Energy Drinks Market Volume K Tons Forecast, by Country 2020 & 2033
- Table 17: Nigeria Africa Energy Drinks Market Revenue (billion) Forecast, by Application 2020 & 2033
- Table 18: Nigeria Africa Energy Drinks Market Volume (K Tons) Forecast, by Application 2020 & 2033
- Table 19: South Africa Africa Energy Drinks Market Revenue (billion) Forecast, by Application 2020 & 2033
- Table 20: South Africa Africa Energy Drinks Market Volume (K Tons) Forecast, by Application 2020 & 2033
- Table 21: Egypt Africa Energy Drinks Market Revenue (billion) Forecast, by Application 2020 & 2033
- Table 22: Egypt Africa Energy Drinks Market Volume (K Tons) Forecast, by Application 2020 & 2033
- Table 23: Kenya Africa Energy Drinks Market Revenue (billion) Forecast, by Application 2020 & 2033
- Table 24: Kenya Africa Energy Drinks Market Volume (K Tons) Forecast, by Application 2020 & 2033
- Table 25: Ethiopia Africa Energy Drinks Market Revenue (billion) Forecast, by Application 2020 & 2033
- Table 26: Ethiopia Africa Energy Drinks Market Volume (K Tons) Forecast, by Application 2020 & 2033
- Table 27: Morocco Africa Energy Drinks Market Revenue (billion) Forecast, by Application 2020 & 2033
- Table 28: Morocco Africa Energy Drinks Market Volume (K Tons) Forecast, by Application 2020 & 2033
- Table 29: Ghana Africa Energy Drinks Market Revenue (billion) Forecast, by Application 2020 & 2033
- Table 30: Ghana Africa Energy Drinks Market Volume (K Tons) Forecast, by Application 2020 & 2033
- Table 31: Algeria Africa Energy Drinks Market Revenue (billion) Forecast, by Application 2020 & 2033
- Table 32: Algeria Africa Energy Drinks Market Volume (K Tons) Forecast, by Application 2020 & 2033
- Table 33: Tanzania Africa Energy Drinks Market Revenue (billion) Forecast, by Application 2020 & 2033
- Table 34: Tanzania Africa Energy Drinks Market Volume (K Tons) Forecast, by Application 2020 & 2033
- Table 35: Ivory Coast Africa Energy Drinks Market Revenue (billion) Forecast, by Application 2020 & 2033
- Table 36: Ivory Coast Africa Energy Drinks Market Volume (K Tons) Forecast, by Application 2020 & 2033
Frequently Asked Questions
1. What is the projected Compound Annual Growth Rate (CAGR) of the Africa Energy Drinks Market?
The projected CAGR is approximately 10.19%.
2. Which companies are prominent players in the Africa Energy Drinks Market?
Key companies in the market include Mutalo Group sp z o o, Aje Group, Tiger Brands Ltd, The Alternative Power (Pty) Ltd, Monster Beverage Corporation, PepsiCo Inc, Mofaya Beverage Company (PTY) Ltd, S Spitz GmbH, Suntory Holdings Limited, Red Bull GmbH, Halewood International South Africa (Pty) Ltd, The Coca-Cola Company.
3. What are the main segments of the Africa Energy Drinks Market?
The market segments include Soft Drink Type, Packaging Type, Distribution Channel.
4. Can you provide details about the market size?
The market size is estimated to be USD 3.65 billion as of 2022.
5. What are some drivers contributing to market growth?
Increasing Demand for Protein-Rich Food; Increasing Demand for Plant-Based and Organic Ingredients.
6. What are the notable trends driving market growth?
OTHER KEY INDUSTRY TRENDS COVERED IN THE REPORT.
7. Are there any restraints impacting market growth?
Presence of Counterfeit Products.
8. Can you provide examples of recent developments in the market?
October 2023: Miss South Africa Natasha Joubert has expanded her business venture by collaborating with the MoFaya energy drink business. Joubert has launched the Berry Queen-flavoured energy drink under the MoFaya energy drink brand.October 2023: Switch Energy Drink introduced 3 new flavors in the African region. The three new limited-edition flavors are Sour Worms, Naartjie & Grape, and Kiwi, Mango & Strawberry.September 2023: Switch Energy Drink launched a special limited-edition flavor in celebration of South African Heritage Day. As a brand deeply rooted in the South African spirit, Switch Energy Drink is excited to contribute to the festivities with this special edition.
9. What pricing options are available for accessing the report?
Pricing options include single-user, multi-user, and enterprise licenses priced at USD 3800, USD 4500, and USD 5800 respectively.
10. Is the market size provided in terms of value or volume?
The market size is provided in terms of value, measured in billion and volume, measured in K Tons.
11. Are there any specific market keywords associated with the report?
Yes, the market keyword associated with the report is "Africa Energy Drinks Market," which aids in identifying and referencing the specific market segment covered.
12. How do I determine which pricing option suits my needs best?
The pricing options vary based on user requirements and access needs. Individual users may opt for single-user licenses, while businesses requiring broader access may choose multi-user or enterprise licenses for cost-effective access to the report.
13. Are there any additional resources or data provided in the Africa Energy Drinks Market report?
While the report offers comprehensive insights, it's advisable to review the specific contents or supplementary materials provided to ascertain if additional resources or data are available.
14. How can I stay updated on further developments or reports in the Africa Energy Drinks Market?
To stay informed about further developments, trends, and reports in the Africa Energy Drinks Market, consider subscribing to industry newsletters, following relevant companies and organizations, or regularly checking reputable industry news sources and publications.
Methodology
Step 1 - Identification of Relevant Samples Size from Population Database


Step 2 - Approaches for Defining Global Market Size (Value, Volume* & Price*)

Note*: In applicable scenarios
Step 3 - Data Sources
Primary Research
- Web Analytics
- Survey Reports
- Research Institute
- Latest Research Reports
- Opinion Leaders
Secondary Research
- Annual Reports
- White Paper
- Latest Press Release
- Industry Association
- Paid Database
- Investor Presentations

Step 4 - Data Triangulation
Involves using different sources of information in order to increase the validity of a study
These sources are likely to be stakeholders in a program - participants, other researchers, program staff, other community members, and so on.
Then we put all data in single framework & apply various statistical tools to find out the dynamic on the market.
During the analysis stage, feedback from the stakeholder groups would be compared to determine areas of agreement as well as areas of divergence