

Key Insights
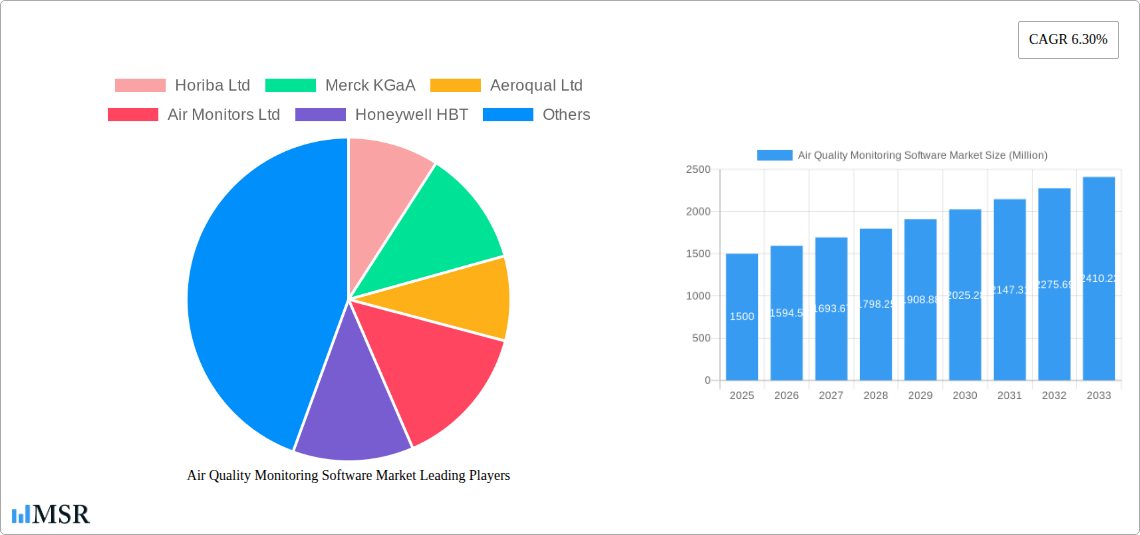
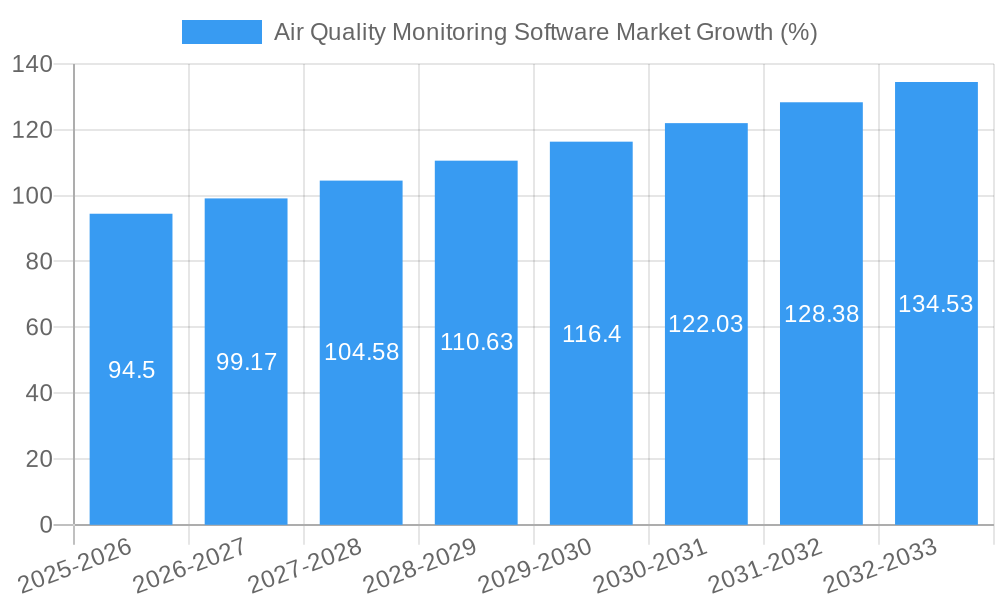
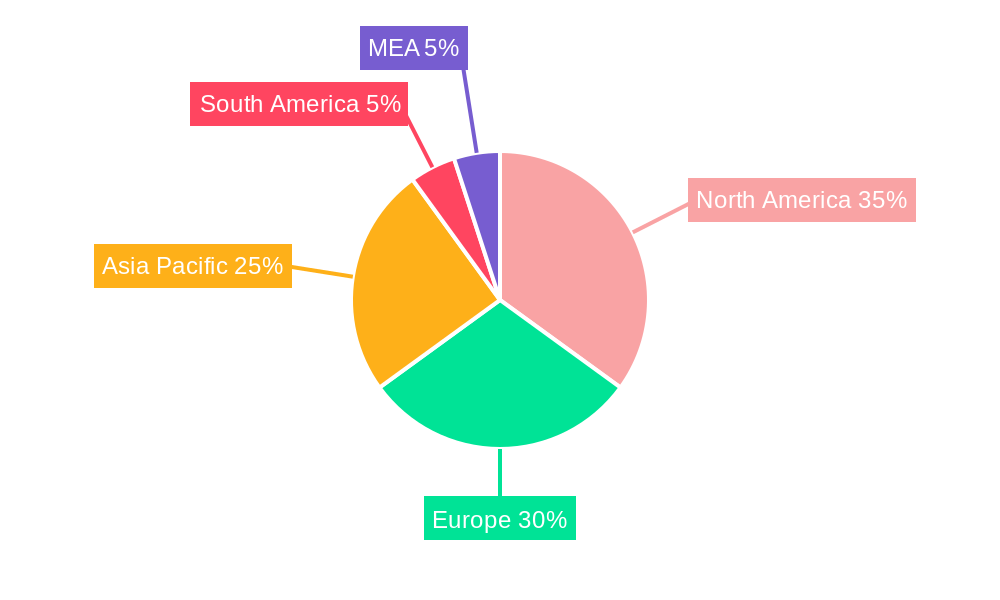
The Air Quality Monitoring Software market is experiencing robust growth, projected to reach a substantial size by 2033, driven by increasing environmental concerns, stringent government regulations, and the rising adoption of smart city initiatives. A Compound Annual Growth Rate (CAGR) of 6.30% from 2025 to 2033 indicates a significant expansion in market value. Key drivers include the urgent need to monitor air quality for public health and environmental protection, advancements in sensor technology leading to more accurate and cost-effective monitoring solutions, and the growing demand for real-time data analysis and predictive modeling to mitigate air pollution events. The market is segmented by software type (indoor and outdoor) and end-user (residential, commercial, industrial, and public agencies). The increasing adoption of indoor air quality monitoring software in commercial buildings and residential spaces is a prominent trend, fueled by awareness of indoor air pollutants and their impact on health and productivity. Furthermore, the burgeoning adoption of cloud-based solutions and IoT-enabled devices for remote monitoring and data analysis is shaping the market landscape. Geographical growth is expected across North America, Europe, and the Asia-Pacific region, driven by differing regulatory landscapes and varying levels of industrial activity. While factors like high initial investment costs and the need for skilled professionals to operate and maintain these systems pose challenges, the overall positive trajectory of the market is sustained by the escalating global demand for cleaner air and better environmental management.
The competitive landscape is characterized by a mix of established players like Honeywell, Thermo Fisher Scientific, and Siemens, and specialized smaller companies offering niche solutions. The presence of these companies promotes innovation and competition, ultimately benefiting consumers through the development of more sophisticated and affordable products. Future growth will likely be driven by the integration of AI and machine learning capabilities into air quality monitoring software, allowing for more effective prediction and management of air pollution events. The expansion of 5G networks also presents opportunities for improved real-time data transmission and remote monitoring capabilities. The market's future success will hinge on continued technological advancement, favorable government policies, and increasing public awareness of air quality issues. Specific regional variances in market penetration will depend on factors such as regulatory environments, economic development, and public health priorities.
Air Quality Monitoring Software Market: A Comprehensive Report (2019-2033)
This comprehensive report provides an in-depth analysis of the Air Quality Monitoring Software Market, offering valuable insights for industry stakeholders, investors, and researchers. The study covers the period from 2019 to 2033, with a focus on the forecast period from 2025 to 2033 (Base Year: 2025, Estimated Year: 2025). The market is segmented by type (Indoor Air Quality Monitoring Software, Outdoor Air Quality Monitoring Software) and end-user (Residential and Commercial, Industries, Public Agencies). Key players analyzed include Horiba Ltd, Merck KGaA, Aeroqual Ltd, Air Monitors Ltd, Honeywell HBT, Thermo Fisher Scientific Inc, Hawa Dawa GmbH, Teledyne Technologies Incorporated, Siemens AG, Cambridge Environmental Research Consultants Ltd, Envirotech Online, Robert Bosch GmbH, and Lakes Environmental Software. The report projects a xx Million market value by 2033, exhibiting a CAGR of xx%.
Air Quality Monitoring Software Market Concentration & Dynamics
The Air Quality Monitoring Software market exhibits a moderately consolidated structure, with a few major players holding significant market share. However, the presence of numerous smaller companies and startups indicates a dynamic competitive landscape. Innovation is a key driver, with continuous advancements in sensor technology, data analytics, and software capabilities shaping market dynamics. Stringent environmental regulations globally are further propelling market growth, necessitating robust air quality monitoring solutions across various sectors.
Market Concentration Metrics:
- Top 5 players hold approximately xx% of the market share (2024).
- The market is characterized by both organic growth (product innovation) and inorganic growth (M&A).
- The number of M&A deals in the last five years totaled approximately xx.
Substitute Products: Traditional methods of air quality monitoring, while still relevant in some applications, are increasingly being replaced by software-driven solutions due to their efficiency, cost-effectiveness, and scalability.
End-User Trends: The increasing awareness of air quality's impact on public health and the environment is driving demand across various end-user segments, particularly in industries, public agencies, and increasingly, residential and commercial sectors.
Air Quality Monitoring Software Market Industry Insights & Trends
The Air Quality Monitoring Software market is experiencing robust growth, fueled by several key factors. The rising prevalence of air pollution in urban areas and industrial zones, coupled with stringent government regulations worldwide, are primary drivers. Technological advancements, such as the development of more accurate and cost-effective sensors and sophisticated data analytics capabilities, are further contributing to market expansion. Increasing adoption of smart cities initiatives is also boosting demand for intelligent air quality monitoring systems. The market size was valued at approximately xx Million in 2024 and is projected to reach xx Million by 2033, demonstrating a substantial growth trajectory.
Key Markets & Segments Leading Air Quality Monitoring Software Market
The outdoor air quality monitoring software segment currently dominates the market, driven by the increasing need for comprehensive air quality surveillance in urban areas and industrial regions. Public agencies (government, research institutes, and UAQMA) represent a significant end-user segment, owing to their crucial role in monitoring and regulating air quality. The Asia-Pacific region is poised for significant growth due to rapid urbanization and industrialization in countries like China and India.
Key Drivers by Segment:
- Outdoor Air Quality Monitoring Software: Stringent environmental regulations, rising air pollution levels in urban areas, and growing awareness of public health concerns.
- Public Agencies: Government mandates for air quality monitoring, research initiatives on air pollution, and the need for accurate and reliable data for policymaking.
- Asia-Pacific Region: Rapid urbanization, industrialization, and increasing government investments in environmental monitoring infrastructure.
Air Quality Monitoring Software Market Product Developments
Recent years have witnessed significant innovation in air quality monitoring software, driven by advancements in sensor technology, artificial intelligence (AI), and machine learning (ML). New products offer enhanced accuracy, real-time data analysis, remote monitoring capabilities, and improved user interfaces. These innovations are providing competitive advantages to companies and creating new market opportunities.
Challenges in the Air Quality Monitoring Software Market
The market faces several challenges, including the high initial investment costs associated with setting up comprehensive monitoring systems, the need for skilled professionals to operate and interpret data, and the potential for data security breaches. Interoperability issues between different monitoring systems and the complexity of regulatory compliance across various jurisdictions also pose significant hurdles.
Forces Driving Air Quality Monitoring Software Market Growth
Technological advancements in sensor technology, improved data analytics capabilities, and the growing adoption of cloud-based platforms are driving significant growth. Stringent environmental regulations imposed by governments worldwide, coupled with increased public awareness regarding air quality's impact on health, are further bolstering market expansion. Government initiatives promoting smart cities and investments in environmental monitoring infrastructure are additional key growth drivers.
Long-Term Growth Catalysts in the Air Quality Monitoring Software Market
Long-term growth will be fueled by continuous innovation in sensor technologies, the integration of AI and machine learning for enhanced data analysis and predictive modeling, and the expansion of monitoring networks to cover wider geographical areas. Strategic partnerships between software providers, sensor manufacturers, and data analytics firms will play a pivotal role in shaping market growth. Increased adoption in emerging economies with growing environmental concerns will also contribute significantly.
Emerging Opportunities in Air Quality Monitoring Software Market
Emerging opportunities include the integration of air quality monitoring data with other environmental sensors to provide holistic environmental assessments, the development of mobile applications for real-time air quality monitoring, and the growing need for personalized air quality solutions for residential and commercial applications. The expansion into new geographical markets and the development of specialized monitoring solutions for specific industries will also create significant opportunities.
Leading Players in the Air Quality Monitoring Software Market Sector
- Horiba Ltd
- Merck KGaA
- Aeroqual Ltd
- Air Monitors Ltd
- Honeywell HBT
- Thermo Fisher Scientific Inc
- Hawa Dawa GmbH
- Teledyne Technologies Incorporated
- Siemens AG
- Cambridge Environmental Research Consultants Ltd
- Envirotech Online
- Robert Bosch GmbH
- Lakes Environmental Software
Key Milestones in Air Quality Monitoring Software Market Industry
- July 2022: Merck launched a global network to foster innovation and sustainability in the laboratory sector. This initiative highlights the growing importance of technological advancements in the air quality monitoring space.
- February 2022: Thermo Fisher Scientific Inc. unveiled the Renvo Rapid PCR Test, a fast environmental test for pathogen surveillance. This development underscores the increasing role of rapid testing in addressing public health concerns related to air quality.
Strategic Outlook for Air Quality Monitoring Software Market
The Air Quality Monitoring Software market is poised for continued growth, driven by technological innovation, increasing regulatory pressure, and rising public awareness. Strategic opportunities exist for companies to expand into new markets, develop innovative solutions, and forge strategic partnerships to enhance their market position. The focus on data analytics, AI, and IoT integration will be key to unlocking future market potential.
Air Quality Monitoring Software Market Segmentation
-
1. Type
- 1.1. Indoor Air Quality Monitoring Software
- 1.2. Outdoor Air Quality Monitoring Software
-
2. End User
- 2.1. Residential and Commercial
- 2.2. Industries
- 2.3. Public A
Air Quality Monitoring Software Market Segmentation By Geography
- 1. North America
- 2. Europe
- 3. Asia Pacific
- 4. Latin America
- 5. Middle East and Africa
Air Quality Monitoring Software Market REPORT HIGHLIGHTS
| Aspects | Details |
|---|---|
| Study Period | 2019-2033 |
| Base Year | 2024 |
| Estimated Year | 2025 |
| Forecast Period | 2025-2033 |
| Historical Period | 2019-2024 |
| Growth Rate | CAGR of 6.30% from 2019-2033 |
| Segmentation |
|
Table of Contents
- 1. Introduction
- 1.1. Research Scope
- 1.2. Market Segmentation
- 1.3. Research Methodology
- 1.4. Definitions and Assumptions
- 2. Executive Summary
- 2.1. Introduction
- 3. Market Dynamics
- 3.1. Introduction
- 3.2. Market Drivers
- 3.2.1. Strong Demand for Indoor AQM; High-Credibility of IoT and AI-Based Systems
- 3.3. Market Restrains
- 3.3.1. Cost Woes for Monitoring and Maintenance
- 3.4. Market Trends
- 3.4.1. Indoor Air Quality Monitoring (IAQM) Demand Propelling Growth
- 4. Market Factor Analysis
- 4.1. Porters Five Forces
- 4.2. Supply/Value Chain
- 4.3. PESTEL analysis
- 4.4. Market Entropy
- 4.5. Patent/Trademark Analysis
- 5. Global Air Quality Monitoring Software Market Analysis, Insights and Forecast, 2019-2031
- 5.1. Market Analysis, Insights and Forecast - by Type
- 5.1.1. Indoor Air Quality Monitoring Software
- 5.1.2. Outdoor Air Quality Monitoring Software
- 5.2. Market Analysis, Insights and Forecast - by End User
- 5.2.1. Residential and Commercial
- 5.2.2. Industries
- 5.2.3. Public A
- 5.3. Market Analysis, Insights and Forecast - by Region
- 5.3.1. North America
- 5.3.2. Europe
- 5.3.3. Asia Pacific
- 5.3.4. Latin America
- 5.3.5. Middle East and Africa
- 5.1. Market Analysis, Insights and Forecast - by Type
- 6. North America Air Quality Monitoring Software Market Analysis, Insights and Forecast, 2019-2031
- 6.1. Market Analysis, Insights and Forecast - by Type
- 6.1.1. Indoor Air Quality Monitoring Software
- 6.1.2. Outdoor Air Quality Monitoring Software
- 6.2. Market Analysis, Insights and Forecast - by End User
- 6.2.1. Residential and Commercial
- 6.2.2. Industries
- 6.2.3. Public A
- 6.1. Market Analysis, Insights and Forecast - by Type
- 7. Europe Air Quality Monitoring Software Market Analysis, Insights and Forecast, 2019-2031
- 7.1. Market Analysis, Insights and Forecast - by Type
- 7.1.1. Indoor Air Quality Monitoring Software
- 7.1.2. Outdoor Air Quality Monitoring Software
- 7.2. Market Analysis, Insights and Forecast - by End User
- 7.2.1. Residential and Commercial
- 7.2.2. Industries
- 7.2.3. Public A
- 7.1. Market Analysis, Insights and Forecast - by Type
- 8. Asia Pacific Air Quality Monitoring Software Market Analysis, Insights and Forecast, 2019-2031
- 8.1. Market Analysis, Insights and Forecast - by Type
- 8.1.1. Indoor Air Quality Monitoring Software
- 8.1.2. Outdoor Air Quality Monitoring Software
- 8.2. Market Analysis, Insights and Forecast - by End User
- 8.2.1. Residential and Commercial
- 8.2.2. Industries
- 8.2.3. Public A
- 8.1. Market Analysis, Insights and Forecast - by Type
- 9. Latin America Air Quality Monitoring Software Market Analysis, Insights and Forecast, 2019-2031
- 9.1. Market Analysis, Insights and Forecast - by Type
- 9.1.1. Indoor Air Quality Monitoring Software
- 9.1.2. Outdoor Air Quality Monitoring Software
- 9.2. Market Analysis, Insights and Forecast - by End User
- 9.2.1. Residential and Commercial
- 9.2.2. Industries
- 9.2.3. Public A
- 9.1. Market Analysis, Insights and Forecast - by Type
- 10. Middle East and Africa Air Quality Monitoring Software Market Analysis, Insights and Forecast, 2019-2031
- 10.1. Market Analysis, Insights and Forecast - by Type
- 10.1.1. Indoor Air Quality Monitoring Software
- 10.1.2. Outdoor Air Quality Monitoring Software
- 10.2. Market Analysis, Insights and Forecast - by End User
- 10.2.1. Residential and Commercial
- 10.2.2. Industries
- 10.2.3. Public A
- 10.1. Market Analysis, Insights and Forecast - by Type
- 11. North America Air Quality Monitoring Software Market Analysis, Insights and Forecast, 2019-2031
- 11.1. Market Analysis, Insights and Forecast - By Country/Sub-region
- 11.1.1 United States
- 11.1.2 Canada
- 11.1.3 Mexico
- 12. Europe Air Quality Monitoring Software Market Analysis, Insights and Forecast, 2019-2031
- 12.1. Market Analysis, Insights and Forecast - By Country/Sub-region
- 12.1.1 Germany
- 12.1.2 United Kingdom
- 12.1.3 France
- 12.1.4 Spain
- 12.1.5 Italy
- 12.1.6 Spain
- 12.1.7 Belgium
- 12.1.8 Netherland
- 12.1.9 Nordics
- 12.1.10 Rest of Europe
- 13. Asia Pacific Air Quality Monitoring Software Market Analysis, Insights and Forecast, 2019-2031
- 13.1. Market Analysis, Insights and Forecast - By Country/Sub-region
- 13.1.1 China
- 13.1.2 Japan
- 13.1.3 India
- 13.1.4 South Korea
- 13.1.5 Southeast Asia
- 13.1.6 Australia
- 13.1.7 Indonesia
- 13.1.8 Phillipes
- 13.1.9 Singapore
- 13.1.10 Thailandc
- 13.1.11 Rest of Asia Pacific
- 14. South America Air Quality Monitoring Software Market Analysis, Insights and Forecast, 2019-2031
- 14.1. Market Analysis, Insights and Forecast - By Country/Sub-region
- 14.1.1 Brazil
- 14.1.2 Argentina
- 14.1.3 Peru
- 14.1.4 Chile
- 14.1.5 Colombia
- 14.1.6 Ecuador
- 14.1.7 Venezuela
- 14.1.8 Rest of South America
- 15. North America Air Quality Monitoring Software Market Analysis, Insights and Forecast, 2019-2031
- 15.1. Market Analysis, Insights and Forecast - By Country/Sub-region
- 15.1.1 United States
- 15.1.2 Canada
- 15.1.3 Mexico
- 16. MEA Air Quality Monitoring Software Market Analysis, Insights and Forecast, 2019-2031
- 16.1. Market Analysis, Insights and Forecast - By Country/Sub-region
- 16.1.1 United Arab Emirates
- 16.1.2 Saudi Arabia
- 16.1.3 South Africa
- 16.1.4 Rest of Middle East and Africa
- 17. Competitive Analysis
- 17.1. Global Market Share Analysis 2024
- 17.2. Company Profiles
- 17.2.1 Horiba Ltd
- 17.2.1.1. Overview
- 17.2.1.2. Products
- 17.2.1.3. SWOT Analysis
- 17.2.1.4. Recent Developments
- 17.2.1.5. Financials (Based on Availability)
- 17.2.2 Merck KGaA
- 17.2.2.1. Overview
- 17.2.2.2. Products
- 17.2.2.3. SWOT Analysis
- 17.2.2.4. Recent Developments
- 17.2.2.5. Financials (Based on Availability)
- 17.2.3 Aeroqual Ltd
- 17.2.3.1. Overview
- 17.2.3.2. Products
- 17.2.3.3. SWOT Analysis
- 17.2.3.4. Recent Developments
- 17.2.3.5. Financials (Based on Availability)
- 17.2.4 Air Monitors Ltd
- 17.2.4.1. Overview
- 17.2.4.2. Products
- 17.2.4.3. SWOT Analysis
- 17.2.4.4. Recent Developments
- 17.2.4.5. Financials (Based on Availability)
- 17.2.5 Honeywell HBT
- 17.2.5.1. Overview
- 17.2.5.2. Products
- 17.2.5.3. SWOT Analysis
- 17.2.5.4. Recent Developments
- 17.2.5.5. Financials (Based on Availability)
- 17.2.6 Thermo Fisher Scientific Inc
- 17.2.6.1. Overview
- 17.2.6.2. Products
- 17.2.6.3. SWOT Analysis
- 17.2.6.4. Recent Developments
- 17.2.6.5. Financials (Based on Availability)
- 17.2.7 Hawa Dawa GmbH
- 17.2.7.1. Overview
- 17.2.7.2. Products
- 17.2.7.3. SWOT Analysis
- 17.2.7.4. Recent Developments
- 17.2.7.5. Financials (Based on Availability)
- 17.2.8 Teledyne Technologies Incorporated
- 17.2.8.1. Overview
- 17.2.8.2. Products
- 17.2.8.3. SWOT Analysis
- 17.2.8.4. Recent Developments
- 17.2.8.5. Financials (Based on Availability)
- 17.2.9 Siemens AG
- 17.2.9.1. Overview
- 17.2.9.2. Products
- 17.2.9.3. SWOT Analysis
- 17.2.9.4. Recent Developments
- 17.2.9.5. Financials (Based on Availability)
- 17.2.10 Cambridge Environmental Research Consultants Ltd
- 17.2.10.1. Overview
- 17.2.10.2. Products
- 17.2.10.3. SWOT Analysis
- 17.2.10.4. Recent Developments
- 17.2.10.5. Financials (Based on Availability)
- 17.2.11 Envirotech Online
- 17.2.11.1. Overview
- 17.2.11.2. Products
- 17.2.11.3. SWOT Analysis
- 17.2.11.4. Recent Developments
- 17.2.11.5. Financials (Based on Availability)
- 17.2.12 Robert Bosch GmbH
- 17.2.12.1. Overview
- 17.2.12.2. Products
- 17.2.12.3. SWOT Analysis
- 17.2.12.4. Recent Developments
- 17.2.12.5. Financials (Based on Availability)
- 17.2.13 Lakes Environmental Software
- 17.2.13.1. Overview
- 17.2.13.2. Products
- 17.2.13.3. SWOT Analysis
- 17.2.13.4. Recent Developments
- 17.2.13.5. Financials (Based on Availability)
- 17.2.1 Horiba Ltd
List of Figures
- Figure 1: Global Air Quality Monitoring Software Market Revenue Breakdown (Million, %) by Region 2024 & 2032
- Figure 2: North America Air Quality Monitoring Software Market Revenue (Million), by Country 2024 & 2032
- Figure 3: North America Air Quality Monitoring Software Market Revenue Share (%), by Country 2024 & 2032
- Figure 4: Europe Air Quality Monitoring Software Market Revenue (Million), by Country 2024 & 2032
- Figure 5: Europe Air Quality Monitoring Software Market Revenue Share (%), by Country 2024 & 2032
- Figure 6: Asia Pacific Air Quality Monitoring Software Market Revenue (Million), by Country 2024 & 2032
- Figure 7: Asia Pacific Air Quality Monitoring Software Market Revenue Share (%), by Country 2024 & 2032
- Figure 8: South America Air Quality Monitoring Software Market Revenue (Million), by Country 2024 & 2032
- Figure 9: South America Air Quality Monitoring Software Market Revenue Share (%), by Country 2024 & 2032
- Figure 10: North America Air Quality Monitoring Software Market Revenue (Million), by Country 2024 & 2032
- Figure 11: North America Air Quality Monitoring Software Market Revenue Share (%), by Country 2024 & 2032
- Figure 12: MEA Air Quality Monitoring Software Market Revenue (Million), by Country 2024 & 2032
- Figure 13: MEA Air Quality Monitoring Software Market Revenue Share (%), by Country 2024 & 2032
- Figure 14: North America Air Quality Monitoring Software Market Revenue (Million), by Type 2024 & 2032
- Figure 15: North America Air Quality Monitoring Software Market Revenue Share (%), by Type 2024 & 2032
- Figure 16: North America Air Quality Monitoring Software Market Revenue (Million), by End User 2024 & 2032
- Figure 17: North America Air Quality Monitoring Software Market Revenue Share (%), by End User 2024 & 2032
- Figure 18: North America Air Quality Monitoring Software Market Revenue (Million), by Country 2024 & 2032
- Figure 19: North America Air Quality Monitoring Software Market Revenue Share (%), by Country 2024 & 2032
- Figure 20: Europe Air Quality Monitoring Software Market Revenue (Million), by Type 2024 & 2032
- Figure 21: Europe Air Quality Monitoring Software Market Revenue Share (%), by Type 2024 & 2032
- Figure 22: Europe Air Quality Monitoring Software Market Revenue (Million), by End User 2024 & 2032
- Figure 23: Europe Air Quality Monitoring Software Market Revenue Share (%), by End User 2024 & 2032
- Figure 24: Europe Air Quality Monitoring Software Market Revenue (Million), by Country 2024 & 2032
- Figure 25: Europe Air Quality Monitoring Software Market Revenue Share (%), by Country 2024 & 2032
- Figure 26: Asia Pacific Air Quality Monitoring Software Market Revenue (Million), by Type 2024 & 2032
- Figure 27: Asia Pacific Air Quality Monitoring Software Market Revenue Share (%), by Type 2024 & 2032
- Figure 28: Asia Pacific Air Quality Monitoring Software Market Revenue (Million), by End User 2024 & 2032
- Figure 29: Asia Pacific Air Quality Monitoring Software Market Revenue Share (%), by End User 2024 & 2032
- Figure 30: Asia Pacific Air Quality Monitoring Software Market Revenue (Million), by Country 2024 & 2032
- Figure 31: Asia Pacific Air Quality Monitoring Software Market Revenue Share (%), by Country 2024 & 2032
- Figure 32: Latin America Air Quality Monitoring Software Market Revenue (Million), by Type 2024 & 2032
- Figure 33: Latin America Air Quality Monitoring Software Market Revenue Share (%), by Type 2024 & 2032
- Figure 34: Latin America Air Quality Monitoring Software Market Revenue (Million), by End User 2024 & 2032
- Figure 35: Latin America Air Quality Monitoring Software Market Revenue Share (%), by End User 2024 & 2032
- Figure 36: Latin America Air Quality Monitoring Software Market Revenue (Million), by Country 2024 & 2032
- Figure 37: Latin America Air Quality Monitoring Software Market Revenue Share (%), by Country 2024 & 2032
- Figure 38: Middle East and Africa Air Quality Monitoring Software Market Revenue (Million), by Type 2024 & 2032
- Figure 39: Middle East and Africa Air Quality Monitoring Software Market Revenue Share (%), by Type 2024 & 2032
- Figure 40: Middle East and Africa Air Quality Monitoring Software Market Revenue (Million), by End User 2024 & 2032
- Figure 41: Middle East and Africa Air Quality Monitoring Software Market Revenue Share (%), by End User 2024 & 2032
- Figure 42: Middle East and Africa Air Quality Monitoring Software Market Revenue (Million), by Country 2024 & 2032
- Figure 43: Middle East and Africa Air Quality Monitoring Software Market Revenue Share (%), by Country 2024 & 2032
List of Tables
- Table 1: Global Air Quality Monitoring Software Market Revenue Million Forecast, by Region 2019 & 2032
- Table 2: Global Air Quality Monitoring Software Market Revenue Million Forecast, by Type 2019 & 2032
- Table 3: Global Air Quality Monitoring Software Market Revenue Million Forecast, by End User 2019 & 2032
- Table 4: Global Air Quality Monitoring Software Market Revenue Million Forecast, by Region 2019 & 2032
- Table 5: Global Air Quality Monitoring Software Market Revenue Million Forecast, by Country 2019 & 2032
- Table 6: United States Air Quality Monitoring Software Market Revenue (Million) Forecast, by Application 2019 & 2032
- Table 7: Canada Air Quality Monitoring Software Market Revenue (Million) Forecast, by Application 2019 & 2032
- Table 8: Mexico Air Quality Monitoring Software Market Revenue (Million) Forecast, by Application 2019 & 2032
- Table 9: Global Air Quality Monitoring Software Market Revenue Million Forecast, by Country 2019 & 2032
- Table 10: Germany Air Quality Monitoring Software Market Revenue (Million) Forecast, by Application 2019 & 2032
- Table 11: United Kingdom Air Quality Monitoring Software Market Revenue (Million) Forecast, by Application 2019 & 2032
- Table 12: France Air Quality Monitoring Software Market Revenue (Million) Forecast, by Application 2019 & 2032
- Table 13: Spain Air Quality Monitoring Software Market Revenue (Million) Forecast, by Application 2019 & 2032
- Table 14: Italy Air Quality Monitoring Software Market Revenue (Million) Forecast, by Application 2019 & 2032
- Table 15: Spain Air Quality Monitoring Software Market Revenue (Million) Forecast, by Application 2019 & 2032
- Table 16: Belgium Air Quality Monitoring Software Market Revenue (Million) Forecast, by Application 2019 & 2032
- Table 17: Netherland Air Quality Monitoring Software Market Revenue (Million) Forecast, by Application 2019 & 2032
- Table 18: Nordics Air Quality Monitoring Software Market Revenue (Million) Forecast, by Application 2019 & 2032
- Table 19: Rest of Europe Air Quality Monitoring Software Market Revenue (Million) Forecast, by Application 2019 & 2032
- Table 20: Global Air Quality Monitoring Software Market Revenue Million Forecast, by Country 2019 & 2032
- Table 21: China Air Quality Monitoring Software Market Revenue (Million) Forecast, by Application 2019 & 2032
- Table 22: Japan Air Quality Monitoring Software Market Revenue (Million) Forecast, by Application 2019 & 2032
- Table 23: India Air Quality Monitoring Software Market Revenue (Million) Forecast, by Application 2019 & 2032
- Table 24: South Korea Air Quality Monitoring Software Market Revenue (Million) Forecast, by Application 2019 & 2032
- Table 25: Southeast Asia Air Quality Monitoring Software Market Revenue (Million) Forecast, by Application 2019 & 2032
- Table 26: Australia Air Quality Monitoring Software Market Revenue (Million) Forecast, by Application 2019 & 2032
- Table 27: Indonesia Air Quality Monitoring Software Market Revenue (Million) Forecast, by Application 2019 & 2032
- Table 28: Phillipes Air Quality Monitoring Software Market Revenue (Million) Forecast, by Application 2019 & 2032
- Table 29: Singapore Air Quality Monitoring Software Market Revenue (Million) Forecast, by Application 2019 & 2032
- Table 30: Thailandc Air Quality Monitoring Software Market Revenue (Million) Forecast, by Application 2019 & 2032
- Table 31: Rest of Asia Pacific Air Quality Monitoring Software Market Revenue (Million) Forecast, by Application 2019 & 2032
- Table 32: Global Air Quality Monitoring Software Market Revenue Million Forecast, by Country 2019 & 2032
- Table 33: Brazil Air Quality Monitoring Software Market Revenue (Million) Forecast, by Application 2019 & 2032
- Table 34: Argentina Air Quality Monitoring Software Market Revenue (Million) Forecast, by Application 2019 & 2032
- Table 35: Peru Air Quality Monitoring Software Market Revenue (Million) Forecast, by Application 2019 & 2032
- Table 36: Chile Air Quality Monitoring Software Market Revenue (Million) Forecast, by Application 2019 & 2032
- Table 37: Colombia Air Quality Monitoring Software Market Revenue (Million) Forecast, by Application 2019 & 2032
- Table 38: Ecuador Air Quality Monitoring Software Market Revenue (Million) Forecast, by Application 2019 & 2032
- Table 39: Venezuela Air Quality Monitoring Software Market Revenue (Million) Forecast, by Application 2019 & 2032
- Table 40: Rest of South America Air Quality Monitoring Software Market Revenue (Million) Forecast, by Application 2019 & 2032
- Table 41: Global Air Quality Monitoring Software Market Revenue Million Forecast, by Country 2019 & 2032
- Table 42: United States Air Quality Monitoring Software Market Revenue (Million) Forecast, by Application 2019 & 2032
- Table 43: Canada Air Quality Monitoring Software Market Revenue (Million) Forecast, by Application 2019 & 2032
- Table 44: Mexico Air Quality Monitoring Software Market Revenue (Million) Forecast, by Application 2019 & 2032
- Table 45: Global Air Quality Monitoring Software Market Revenue Million Forecast, by Country 2019 & 2032
- Table 46: United Arab Emirates Air Quality Monitoring Software Market Revenue (Million) Forecast, by Application 2019 & 2032
- Table 47: Saudi Arabia Air Quality Monitoring Software Market Revenue (Million) Forecast, by Application 2019 & 2032
- Table 48: South Africa Air Quality Monitoring Software Market Revenue (Million) Forecast, by Application 2019 & 2032
- Table 49: Rest of Middle East and Africa Air Quality Monitoring Software Market Revenue (Million) Forecast, by Application 2019 & 2032
- Table 50: Global Air Quality Monitoring Software Market Revenue Million Forecast, by Type 2019 & 2032
- Table 51: Global Air Quality Monitoring Software Market Revenue Million Forecast, by End User 2019 & 2032
- Table 52: Global Air Quality Monitoring Software Market Revenue Million Forecast, by Country 2019 & 2032
- Table 53: Global Air Quality Monitoring Software Market Revenue Million Forecast, by Type 2019 & 2032
- Table 54: Global Air Quality Monitoring Software Market Revenue Million Forecast, by End User 2019 & 2032
- Table 55: Global Air Quality Monitoring Software Market Revenue Million Forecast, by Country 2019 & 2032
- Table 56: Global Air Quality Monitoring Software Market Revenue Million Forecast, by Type 2019 & 2032
- Table 57: Global Air Quality Monitoring Software Market Revenue Million Forecast, by End User 2019 & 2032
- Table 58: Global Air Quality Monitoring Software Market Revenue Million Forecast, by Country 2019 & 2032
- Table 59: Global Air Quality Monitoring Software Market Revenue Million Forecast, by Type 2019 & 2032
- Table 60: Global Air Quality Monitoring Software Market Revenue Million Forecast, by End User 2019 & 2032
- Table 61: Global Air Quality Monitoring Software Market Revenue Million Forecast, by Country 2019 & 2032
- Table 62: Global Air Quality Monitoring Software Market Revenue Million Forecast, by Type 2019 & 2032
- Table 63: Global Air Quality Monitoring Software Market Revenue Million Forecast, by End User 2019 & 2032
- Table 64: Global Air Quality Monitoring Software Market Revenue Million Forecast, by Country 2019 & 2032
Frequently Asked Questions
1. What is the projected Compound Annual Growth Rate (CAGR) of the Air Quality Monitoring Software Market?
The projected CAGR is approximately 6.30%.
2. Which companies are prominent players in the Air Quality Monitoring Software Market?
Key companies in the market include Horiba Ltd, Merck KGaA, Aeroqual Ltd, Air Monitors Ltd, Honeywell HBT, Thermo Fisher Scientific Inc, Hawa Dawa GmbH, Teledyne Technologies Incorporated, Siemens AG, Cambridge Environmental Research Consultants Ltd, Envirotech Online, Robert Bosch GmbH, Lakes Environmental Software.
3. What are the main segments of the Air Quality Monitoring Software Market?
The market segments include Type, End User.
4. Can you provide details about the market size?
The market size is estimated to be USD XX Million as of 2022.
5. What are some drivers contributing to market growth?
Strong Demand for Indoor AQM; High-Credibility of IoT and AI-Based Systems.
6. What are the notable trends driving market growth?
Indoor Air Quality Monitoring (IAQM) Demand Propelling Growth.
7. Are there any restraints impacting market growth?
Cost Woes for Monitoring and Maintenance.
8. Can you provide examples of recent developments in the market?
In July 2022, Merck launched a worldwide network to link the sector with professionals in the field to learn how to create "Next-Gen Labs" and usher in a sustainable and innovative age. By taking the initiative to create a high-level vision of the Future of Labs-those that are connected, inventive, and more sustainable-Merck, as a worldwide leader, is setting the standard for the sector.
9. What pricing options are available for accessing the report?
Pricing options include single-user, multi-user, and enterprise licenses priced at USD 4750, USD 5250, and USD 8750 respectively.
10. Is the market size provided in terms of value or volume?
The market size is provided in terms of value, measured in Million.
11. Are there any specific market keywords associated with the report?
Yes, the market keyword associated with the report is "Air Quality Monitoring Software Market," which aids in identifying and referencing the specific market segment covered.
12. How do I determine which pricing option suits my needs best?
The pricing options vary based on user requirements and access needs. Individual users may opt for single-user licenses, while businesses requiring broader access may choose multi-user or enterprise licenses for cost-effective access to the report.
13. Are there any additional resources or data provided in the Air Quality Monitoring Software Market report?
While the report offers comprehensive insights, it's advisable to review the specific contents or supplementary materials provided to ascertain if additional resources or data are available.
14. How can I stay updated on further developments or reports in the Air Quality Monitoring Software Market?
To stay informed about further developments, trends, and reports in the Air Quality Monitoring Software Market, consider subscribing to industry newsletters, following relevant companies and organizations, or regularly checking reputable industry news sources and publications.
Methodology
Step 1 - Identification of Relevant Samples Size from Population Database


Step 2 - Approaches for Defining Global Market Size (Value, Volume* & Price*)

Note*: In applicable scenarios
Step 3 - Data Sources
Primary Research
- Web Analytics
- Survey Reports
- Research Institute
- Latest Research Reports
- Opinion Leaders
Secondary Research
- Annual Reports
- White Paper
- Latest Press Release
- Industry Association
- Paid Database
- Investor Presentations

Step 4 - Data Triangulation
Involves using different sources of information in order to increase the validity of a study
These sources are likely to be stakeholders in a program - participants, other researchers, program staff, other community members, and so on.
Then we put all data in single framework & apply various statistical tools to find out the dynamic on the market.
During the analysis stage, feedback from the stakeholder groups would be compared to determine areas of agreement as well as areas of divergence
