

Key Insights
The global activated charcoal market is projected for substantial growth, with an estimated market size of 73.15 million in the base year 2025. The market is expected to expand at a Compound Annual Growth Rate (CAGR) of 4.12% from 2025 to 2033. This upward trend is driven by increasing consumer awareness of activated charcoal's health benefits, particularly its role in detoxification and digestive health. The growing preference for holistic and natural wellness solutions further fuels demand. The versatility of activated charcoal, utilized in health supplements, water purification, and industrial applications, contributes to its widespread market appeal. Growth is also evident across distribution channels, with online retail experiencing a significant surge due to enhanced e-commerce penetration and convenience. Key market restraints include concerns about potential side effects from excessive consumption and the necessity for stringent manufacturing quality control. The market is segmented by product form, including capsules, tablets, and powders, and by distribution channel, encompassing pharmacies, supermarkets, online retailers, and others. While capsules and tablets currently lead, powder forms are gaining traction. Pharmacies and drugstores maintain a notable market share, though online channels are rapidly expanding. Geographically, North America and Europe currently command significant market share, attributed to high consumer awareness and purchasing power. However, the Asia-Pacific region presents considerable growth potential, supported by a growing middle class and escalating interest in natural health products. Key industry players, including Holland & Barrett, Bulletproof 360, and Forza Industries, are pivotal in driving innovation and market expansion.
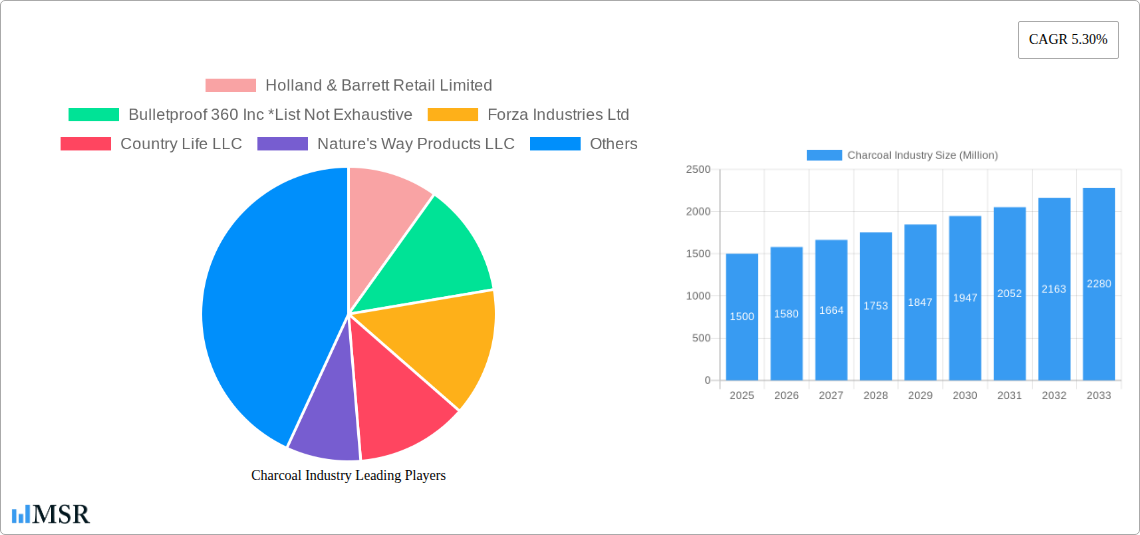
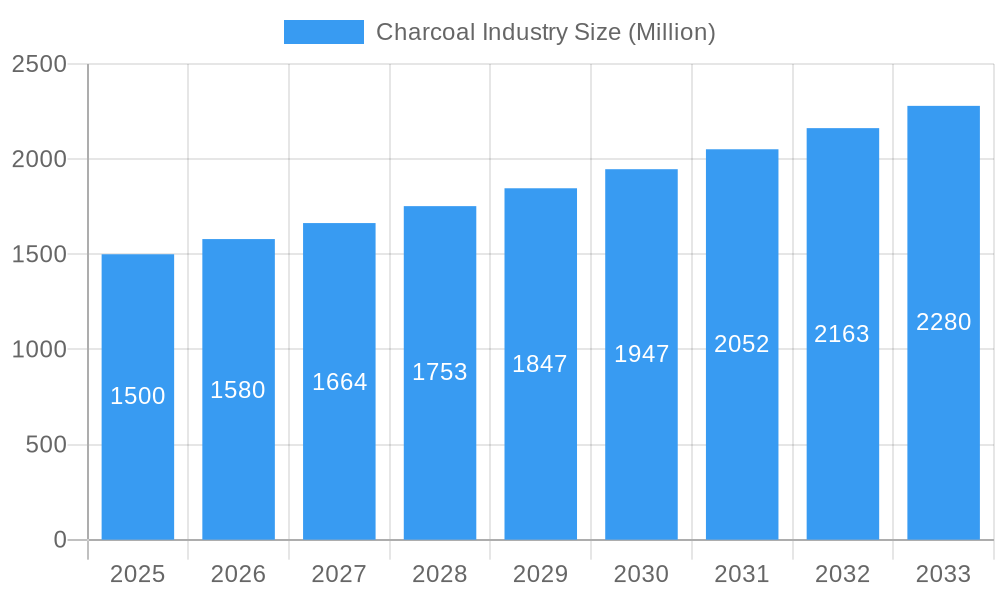
Charcoal Industry Market Size (In Million)
The forecast period of 2025-2033 anticipates sustained market expansion, especially within emerging economies. Strategic collaborations between manufacturers and retailers are expected to optimize distribution networks and broaden consumer reach. Product innovation, focused on advanced formulations and specialized applications, will remain a crucial strategy for market participants. Regulatory oversight and standardization concerning product purity and safety are essential for building consumer trust and ensuring sustainable market development. The market is well-positioned for considerable growth; however, successfully navigating consumer perception, regulatory compliance, and product quality assurance will be critical for sustained success.
Charcoal Industry Company Market Share
Charcoal Industry Market Report: 2019-2033
This comprehensive report provides an in-depth analysis of the global charcoal industry, offering invaluable insights for stakeholders seeking to navigate this dynamic market. The study period spans 2019-2033, with 2025 serving as the base and estimated year. The report forecasts market trends from 2025-2033, leveraging data from the historical period of 2019-2024. Key players like Holland & Barrett Retail Limited, Bulletproof 360 Inc, Forza Industries Ltd, Country Life LLC, Nature's Way Products LLC, Swanson, Schizandu Organics, and Sona are analyzed, revealing market share dynamics and growth strategies. The report segments the market by form (Capsules, Tablets) and distribution channel (Pharmacies & Drug Stores, Supermarket/Hypermarket, Online Retailers, Other Distribution Channels), providing a granular understanding of market performance across various segments. The estimated market size for 2025 is $XX Million. The report projects a CAGR of XX% during the forecast period.
Charcoal Industry Market Concentration & Dynamics
The global charcoal industry exhibits a moderately concentrated market structure, with a few major players holding significant market share. However, the presence of numerous smaller players fosters competition and innovation. Market concentration is influenced by factors like economies of scale, brand recognition, and access to distribution channels.
Market Share (2025 Estimate):
- Top 5 Players: XX%
- Remaining Players: XX%
Innovation Ecosystems: Innovation is driven by both established players and emerging companies focusing on product diversification, such as developing novel formulations and delivery methods.
Regulatory Frameworks: Varying regulations across different regions impact production, distribution, and labeling, creating complexities for companies operating globally.
Substitute Products: The market faces competition from alternative products offering similar health benefits, impacting overall market growth.
End-User Trends: Growing consumer awareness of charcoal's potential health benefits and its use in various applications fuels market growth. This includes increased adoption across different demographics and regions.
M&A Activities: The number of M&A deals in the charcoal industry during the historical period (2019-2024) totaled approximately xx. These activities have been driven by factors including expansion into new markets and product diversification.
Charcoal Industry Industry Insights & Trends
The global charcoal industry is experiencing robust growth, driven by several key factors. Increased consumer demand for natural health supplements and functional foods fueled by rising health consciousness is a primary growth driver. The industry is witnessing technological advancements, including improved processing and manufacturing techniques leading to higher-quality products. Evolving consumer behavior, a preference for convenient formats like capsules and tablets, and the rising popularity of online retail channels are also significantly shaping market dynamics. The market size is projected to reach $XX Million by 2033, driven by a CAGR of XX% during the forecast period (2025-2033). Changes in consumer preferences and increased awareness of the health benefits of charcoal are anticipated to drive future growth.
Key Markets & Segments Leading Charcoal Industry
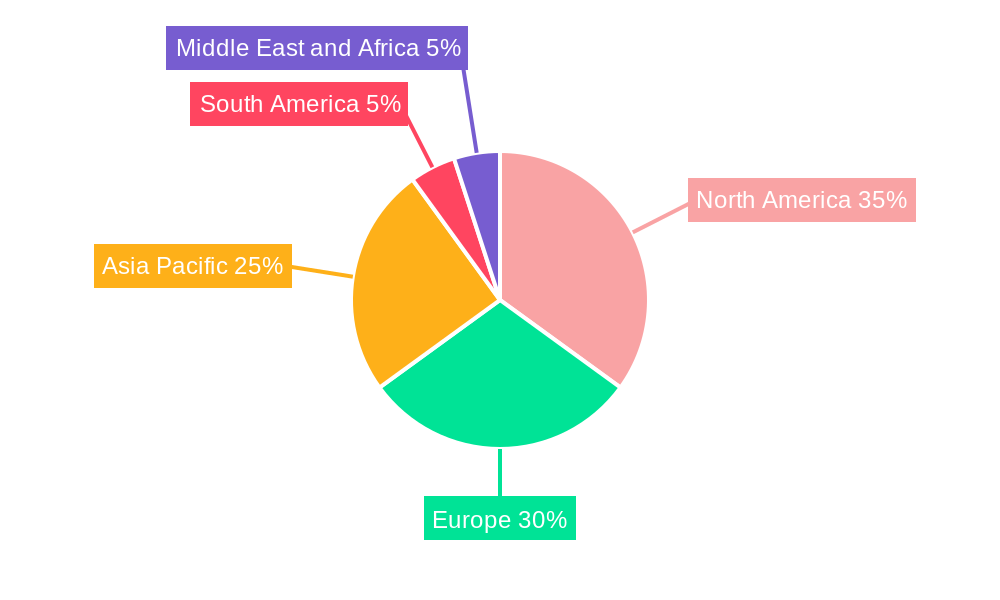
The North American region currently dominates the charcoal industry, with strong demand driven by factors such as high disposable incomes, increased health consciousness, and extensive distribution networks. Within North America, the United States holds the largest market share.
Dominant Segment Analysis:
The capsules segment holds a larger market share than the tablets segment due to its convenience and ease of consumption. In terms of distribution channels, online retailers are witnessing rapid growth due to their wide reach and convenience, while pharmacies and drug stores remain a significant distribution channel for charcoal products.
Drivers for Regional Dominance:
- North America: High disposable incomes, strong health and wellness culture, robust healthcare infrastructure.
- Europe: Growing health consciousness and adoption of functional foods.
- Asia-Pacific: Rising middle class, increasing disposable incomes, and expanding health supplement market.
Charcoal Industry Product Developments
The charcoal industry is witnessing significant product innovation, with companies introducing new formulations, improved delivery methods, and enhanced product efficacy. These developments address consumer demands for better absorption rates, targeted health benefits, and diverse product formats. Companies are focusing on creating value-added products such as blends with other functional ingredients to enhance their appeal. These innovations are crucial for maintaining a competitive edge in a fast-evolving market.
Challenges in the Charcoal Industry Market
The charcoal industry faces several challenges, including stringent regulatory hurdles regarding labeling and product safety, which impact the cost and time required for product launches. Supply chain disruptions, particularly concerning raw material sourcing, can significantly impact production and pricing. Intense competition among existing players and the emergence of new entrants create constant pressure on pricing and profitability. These factors collectively pose significant challenges to industry growth.
Forces Driving Charcoal Industry Growth
Several factors are driving growth in the charcoal industry. Technological advancements in processing and manufacturing lead to higher-quality products and improved efficacy. Economic growth in developing economies increases consumer purchasing power, driving demand for health and wellness products. Favorable regulatory changes simplify product registration and market access, facilitating expansion.
Long-Term Growth Catalysts in the Charcoal Industry
Long-term growth is fueled by continuous product innovation, including the development of novel delivery systems and formulations for enhanced effectiveness. Strategic partnerships among industry players can facilitate market access and expansion. Exploring new markets and applications for charcoal products, such as in cosmetics or personal care, creates significant growth potential.
Emerging Opportunities in Charcoal Industry
Emerging opportunities include expanding into new geographical markets with growing health consciousness, leveraging digital marketing and e-commerce platforms to reach wider consumer segments, and developing sustainable sourcing and manufacturing practices to cater to environmentally conscious consumers. Further innovation in delivery systems, such as nano-encapsulation, could improve efficacy and expand applications.
Leading Players in the Charcoal Industry Sector
- Holland & Barrett Retail Limited
- Bulletproof 360 Inc
- Forza Industries Ltd
- Country Life LLC
- Nature's Way Products LLC
- Swanson
- Schizandu Organics
- Sona
Key Milestones in Charcoal Industry Industry
- 2020: Increased consumer interest in natural health supplements, leading to heightened demand for charcoal-based products.
- 2022: Launch of several innovative charcoal-based products by major players.
- 2023: Significant investments in research and development by leading companies to improve product efficacy.
- 2024: Several mergers and acquisitions aiming for market consolidation.
Strategic Outlook for Charcoal Industry Market
The charcoal industry is poised for continued growth, driven by strong consumer demand, technological innovation, and expansion into new markets. Strategic partnerships, focused R&D efforts, and diversification of product portfolios will be critical for success in this dynamic market. The future potential is vast, presenting numerous opportunities for both established players and emerging companies.
Charcoal Industry Segmentation
-
1. Form
- 1.1. Capsules
- 1.2. Tablets
-
2. Distribution Channel
- 2.1. Pharmacies & Drug Stores
- 2.2. Supermarket/Hypermarket
- 2.3. Online Retailers
- 2.4. Other Distribution Channels
Charcoal Industry Segmentation By Geography
-
1. North America
- 1.1. United States
- 1.2. Canada
- 1.3. Mexico
- 1.4. Rest of North America
-
2. Europe
- 2.1. Spain
- 2.2. United Kingdom
- 2.3. Germany
- 2.4. France
- 2.5. Italy
- 2.6. Russia
- 2.7. Rest of Europe
-
3. Asia Pacific
- 3.1. China
- 3.2. Japan
- 3.3. India
- 3.4. Australia
- 3.5. Rest of Asia Pacific
-
4. South America
- 4.1. Brazil
- 4.2. Argentina
- 4.3. Rest of South America
-
5. Middle East and Africa
- 5.1. South Africa
- 5.2. Saudi Arabia
- 5.3. Rest of Middle East and Africa
Charcoal Industry Regional Market Share
Geographic Coverage of Charcoal Industry
Charcoal Industry REPORT HIGHLIGHTS
| Aspects | Details |
|---|---|
| Study Period | 2020-2034 |
| Base Year | 2025 |
| Estimated Year | 2026 |
| Forecast Period | 2026-2034 |
| Historical Period | 2020-2025 |
| Growth Rate | CAGR of 4.12% from 2020-2034 |
| Segmentation |
|
Table of Contents
- 1. Introduction
- 1.1. Research Scope
- 1.2. Market Segmentation
- 1.3. Research Objective
- 1.4. Definitions and Assumptions
- 2. Executive Summary
- 2.1. Market Snapshot
- 3. Market Dynamics
- 3.1. Market Drivers
- 3.2. Market Restrains
- 3.3. Market Trends
- 3.4. Market Opportunities
- 4. Market Factor Analysis
- 4.1. Porters Five Forces
- 4.1.1. Bargaining Power of Suppliers
- 4.1.2. Bargaining Power of Buyers
- 4.1.3. Threat of New Entrants
- 4.1.4. Threat of Substitutes
- 4.1.5. Competitive Rivalry
- 4.2. PESTEL analysis
- 4.3. BCG Analysis
- 4.3.1. Stars (High Growth, High Market Share)
- 4.3.2. Cash Cows (Low Growth, High Market Share)
- 4.3.3. Question Mark (High Growth, Low Market Share)
- 4.3.4. Dogs (Low Growth, Low Market Share)
- 4.4. Ansoff Matrix Analysis
- 4.5. Supply Chain Analysis
- 4.6. Regulatory Landscape
- 4.7. Current Market Potential and Opportunity Assessment (TAM–SAM–SOM Framework)
- 4.8. MSR Analyst Note
- 4.1. Porters Five Forces
- 5. Market Analysis, Insights and Forecast 2021-2033
- 5.1. Market Analysis, Insights and Forecast - by Form
- 5.1.1. Capsules
- 5.1.2. Tablets
- 5.2. Market Analysis, Insights and Forecast - by Distribution Channel
- 5.2.1. Pharmacies & Drug Stores
- 5.2.2. Supermarket/Hypermarket
- 5.2.3. Online Retailers
- 5.2.4. Other Distribution Channels
- 5.3. Market Analysis, Insights and Forecast - by Region
- 5.3.1. North America
- 5.3.2. Europe
- 5.3.3. Asia Pacific
- 5.3.4. South America
- 5.3.5. Middle East and Africa
- 5.1. Market Analysis, Insights and Forecast - by Form
- 6. Global Charcoal Industry Analysis, Insights and Forecast, 2021-2033
- 6.1. Market Analysis, Insights and Forecast - by Form
- 6.1.1. Capsules
- 6.1.2. Tablets
- 6.2. Market Analysis, Insights and Forecast - by Distribution Channel
- 6.2.1. Pharmacies & Drug Stores
- 6.2.2. Supermarket/Hypermarket
- 6.2.3. Online Retailers
- 6.2.4. Other Distribution Channels
- 6.1. Market Analysis, Insights and Forecast - by Form
- 7. North America Charcoal Industry Analysis, Insights and Forecast, 2020-2032
- 7.1. Market Analysis, Insights and Forecast - by Form
- 7.1.1. Capsules
- 7.1.2. Tablets
- 7.2. Market Analysis, Insights and Forecast - by Distribution Channel
- 7.2.1. Pharmacies & Drug Stores
- 7.2.2. Supermarket/Hypermarket
- 7.2.3. Online Retailers
- 7.2.4. Other Distribution Channels
- 7.1. Market Analysis, Insights and Forecast - by Form
- 8. Europe Charcoal Industry Analysis, Insights and Forecast, 2020-2032
- 8.1. Market Analysis, Insights and Forecast - by Form
- 8.1.1. Capsules
- 8.1.2. Tablets
- 8.2. Market Analysis, Insights and Forecast - by Distribution Channel
- 8.2.1. Pharmacies & Drug Stores
- 8.2.2. Supermarket/Hypermarket
- 8.2.3. Online Retailers
- 8.2.4. Other Distribution Channels
- 8.1. Market Analysis, Insights and Forecast - by Form
- 9. Asia Pacific Charcoal Industry Analysis, Insights and Forecast, 2020-2032
- 9.1. Market Analysis, Insights and Forecast - by Form
- 9.1.1. Capsules
- 9.1.2. Tablets
- 9.2. Market Analysis, Insights and Forecast - by Distribution Channel
- 9.2.1. Pharmacies & Drug Stores
- 9.2.2. Supermarket/Hypermarket
- 9.2.3. Online Retailers
- 9.2.4. Other Distribution Channels
- 9.1. Market Analysis, Insights and Forecast - by Form
- 10. South America Charcoal Industry Analysis, Insights and Forecast, 2020-2032
- 10.1. Market Analysis, Insights and Forecast - by Form
- 10.1.1. Capsules
- 10.1.2. Tablets
- 10.2. Market Analysis, Insights and Forecast - by Distribution Channel
- 10.2.1. Pharmacies & Drug Stores
- 10.2.2. Supermarket/Hypermarket
- 10.2.3. Online Retailers
- 10.2.4. Other Distribution Channels
- 10.1. Market Analysis, Insights and Forecast - by Form
- 11. Middle East and Africa Charcoal Industry Analysis, Insights and Forecast, 2020-2032
- 11.1. Market Analysis, Insights and Forecast - by Form
- 11.1.1. Capsules
- 11.1.2. Tablets
- 11.2. Market Analysis, Insights and Forecast - by Distribution Channel
- 11.2.1. Pharmacies & Drug Stores
- 11.2.2. Supermarket/Hypermarket
- 11.2.3. Online Retailers
- 11.2.4. Other Distribution Channels
- 11.1. Market Analysis, Insights and Forecast - by Form
- 12. Competitive Analysis
- 12.1. Company Profiles
- 12.1.1 Holland & Barrett Retail Limited
- 12.1.1.1. Company Overview
- 12.1.1.2. Products
- 12.1.1.3. Company Financials
- 12.1.1.4. SWOT Analysis
- 12.1.2 Bulletproof 360 Inc *List Not Exhaustive
- 12.1.2.1. Company Overview
- 12.1.2.2. Products
- 12.1.2.3. Company Financials
- 12.1.2.4. SWOT Analysis
- 12.1.3 Forza Industries Ltd
- 12.1.3.1. Company Overview
- 12.1.3.2. Products
- 12.1.3.3. Company Financials
- 12.1.3.4. SWOT Analysis
- 12.1.4 Country Life LLC
- 12.1.4.1. Company Overview
- 12.1.4.2. Products
- 12.1.4.3. Company Financials
- 12.1.4.4. SWOT Analysis
- 12.1.5 Nature's Way Products LLC
- 12.1.5.1. Company Overview
- 12.1.5.2. Products
- 12.1.5.3. Company Financials
- 12.1.5.4. SWOT Analysis
- 12.1.6 Swanson
- 12.1.6.1. Company Overview
- 12.1.6.2. Products
- 12.1.6.3. Company Financials
- 12.1.6.4. SWOT Analysis
- 12.1.7 Schizandu Organics
- 12.1.7.1. Company Overview
- 12.1.7.2. Products
- 12.1.7.3. Company Financials
- 12.1.7.4. SWOT Analysis
- 12.1.8 Sona
- 12.1.8.1. Company Overview
- 12.1.8.2. Products
- 12.1.8.3. Company Financials
- 12.1.8.4. SWOT Analysis
- 12.1.1 Holland & Barrett Retail Limited
- 12.2. Market Entropy
- 12.2.1 Company's Key Areas Served
- 12.2.2 Recent Developments
- 12.3. Company Market Share Analysis 2025
- 12.3.1 Top 5 Companies Market Share Analysis
- 12.3.2 Top 3 Companies Market Share Analysis
- 12.4. List of Potential Customers
- 13. Research Methodology
List of Figures
- Figure 1: Global Charcoal Industry Revenue Breakdown (million, %) by Region 2025 & 2033
- Figure 2: North America Charcoal Industry Revenue (million), by Form 2025 & 2033
- Figure 3: North America Charcoal Industry Revenue Share (%), by Form 2025 & 2033
- Figure 4: North America Charcoal Industry Revenue (million), by Distribution Channel 2025 & 2033
- Figure 5: North America Charcoal Industry Revenue Share (%), by Distribution Channel 2025 & 2033
- Figure 6: North America Charcoal Industry Revenue (million), by Country 2025 & 2033
- Figure 7: North America Charcoal Industry Revenue Share (%), by Country 2025 & 2033
- Figure 8: Europe Charcoal Industry Revenue (million), by Form 2025 & 2033
- Figure 9: Europe Charcoal Industry Revenue Share (%), by Form 2025 & 2033
- Figure 10: Europe Charcoal Industry Revenue (million), by Distribution Channel 2025 & 2033
- Figure 11: Europe Charcoal Industry Revenue Share (%), by Distribution Channel 2025 & 2033
- Figure 12: Europe Charcoal Industry Revenue (million), by Country 2025 & 2033
- Figure 13: Europe Charcoal Industry Revenue Share (%), by Country 2025 & 2033
- Figure 14: Asia Pacific Charcoal Industry Revenue (million), by Form 2025 & 2033
- Figure 15: Asia Pacific Charcoal Industry Revenue Share (%), by Form 2025 & 2033
- Figure 16: Asia Pacific Charcoal Industry Revenue (million), by Distribution Channel 2025 & 2033
- Figure 17: Asia Pacific Charcoal Industry Revenue Share (%), by Distribution Channel 2025 & 2033
- Figure 18: Asia Pacific Charcoal Industry Revenue (million), by Country 2025 & 2033
- Figure 19: Asia Pacific Charcoal Industry Revenue Share (%), by Country 2025 & 2033
- Figure 20: South America Charcoal Industry Revenue (million), by Form 2025 & 2033
- Figure 21: South America Charcoal Industry Revenue Share (%), by Form 2025 & 2033
- Figure 22: South America Charcoal Industry Revenue (million), by Distribution Channel 2025 & 2033
- Figure 23: South America Charcoal Industry Revenue Share (%), by Distribution Channel 2025 & 2033
- Figure 24: South America Charcoal Industry Revenue (million), by Country 2025 & 2033
- Figure 25: South America Charcoal Industry Revenue Share (%), by Country 2025 & 2033
- Figure 26: Middle East and Africa Charcoal Industry Revenue (million), by Form 2025 & 2033
- Figure 27: Middle East and Africa Charcoal Industry Revenue Share (%), by Form 2025 & 2033
- Figure 28: Middle East and Africa Charcoal Industry Revenue (million), by Distribution Channel 2025 & 2033
- Figure 29: Middle East and Africa Charcoal Industry Revenue Share (%), by Distribution Channel 2025 & 2033
- Figure 30: Middle East and Africa Charcoal Industry Revenue (million), by Country 2025 & 2033
- Figure 31: Middle East and Africa Charcoal Industry Revenue Share (%), by Country 2025 & 2033
List of Tables
- Table 1: Global Charcoal Industry Revenue million Forecast, by Form 2020 & 2033
- Table 2: Global Charcoal Industry Revenue million Forecast, by Distribution Channel 2020 & 2033
- Table 3: Global Charcoal Industry Revenue million Forecast, by Region 2020 & 2033
- Table 4: Global Charcoal Industry Revenue million Forecast, by Form 2020 & 2033
- Table 5: Global Charcoal Industry Revenue million Forecast, by Distribution Channel 2020 & 2033
- Table 6: Global Charcoal Industry Revenue million Forecast, by Country 2020 & 2033
- Table 7: United States Charcoal Industry Revenue (million) Forecast, by Application 2020 & 2033
- Table 8: Canada Charcoal Industry Revenue (million) Forecast, by Application 2020 & 2033
- Table 9: Mexico Charcoal Industry Revenue (million) Forecast, by Application 2020 & 2033
- Table 10: Rest of North America Charcoal Industry Revenue (million) Forecast, by Application 2020 & 2033
- Table 11: Global Charcoal Industry Revenue million Forecast, by Form 2020 & 2033
- Table 12: Global Charcoal Industry Revenue million Forecast, by Distribution Channel 2020 & 2033
- Table 13: Global Charcoal Industry Revenue million Forecast, by Country 2020 & 2033
- Table 14: Spain Charcoal Industry Revenue (million) Forecast, by Application 2020 & 2033
- Table 15: United Kingdom Charcoal Industry Revenue (million) Forecast, by Application 2020 & 2033
- Table 16: Germany Charcoal Industry Revenue (million) Forecast, by Application 2020 & 2033
- Table 17: France Charcoal Industry Revenue (million) Forecast, by Application 2020 & 2033
- Table 18: Italy Charcoal Industry Revenue (million) Forecast, by Application 2020 & 2033
- Table 19: Russia Charcoal Industry Revenue (million) Forecast, by Application 2020 & 2033
- Table 20: Rest of Europe Charcoal Industry Revenue (million) Forecast, by Application 2020 & 2033
- Table 21: Global Charcoal Industry Revenue million Forecast, by Form 2020 & 2033
- Table 22: Global Charcoal Industry Revenue million Forecast, by Distribution Channel 2020 & 2033
- Table 23: Global Charcoal Industry Revenue million Forecast, by Country 2020 & 2033
- Table 24: China Charcoal Industry Revenue (million) Forecast, by Application 2020 & 2033
- Table 25: Japan Charcoal Industry Revenue (million) Forecast, by Application 2020 & 2033
- Table 26: India Charcoal Industry Revenue (million) Forecast, by Application 2020 & 2033
- Table 27: Australia Charcoal Industry Revenue (million) Forecast, by Application 2020 & 2033
- Table 28: Rest of Asia Pacific Charcoal Industry Revenue (million) Forecast, by Application 2020 & 2033
- Table 29: Global Charcoal Industry Revenue million Forecast, by Form 2020 & 2033
- Table 30: Global Charcoal Industry Revenue million Forecast, by Distribution Channel 2020 & 2033
- Table 31: Global Charcoal Industry Revenue million Forecast, by Country 2020 & 2033
- Table 32: Brazil Charcoal Industry Revenue (million) Forecast, by Application 2020 & 2033
- Table 33: Argentina Charcoal Industry Revenue (million) Forecast, by Application 2020 & 2033
- Table 34: Rest of South America Charcoal Industry Revenue (million) Forecast, by Application 2020 & 2033
- Table 35: Global Charcoal Industry Revenue million Forecast, by Form 2020 & 2033
- Table 36: Global Charcoal Industry Revenue million Forecast, by Distribution Channel 2020 & 2033
- Table 37: Global Charcoal Industry Revenue million Forecast, by Country 2020 & 2033
- Table 38: South Africa Charcoal Industry Revenue (million) Forecast, by Application 2020 & 2033
- Table 39: Saudi Arabia Charcoal Industry Revenue (million) Forecast, by Application 2020 & 2033
- Table 40: Rest of Middle East and Africa Charcoal Industry Revenue (million) Forecast, by Application 2020 & 2033
Frequently Asked Questions
1. What is the projected Compound Annual Growth Rate (CAGR) of the Charcoal Industry?
The projected CAGR is approximately 4.12%.
2. Which companies are prominent players in the Charcoal Industry?
Key companies in the market include Holland & Barrett Retail Limited, Bulletproof 360 Inc *List Not Exhaustive, Forza Industries Ltd, Country Life LLC, Nature's Way Products LLC, Swanson, Schizandu Organics, Sona.
3. What are the main segments of the Charcoal Industry?
The market segments include Form, Distribution Channel.
4. Can you provide details about the market size?
The market size is estimated to be USD 73.15 million as of 2022.
5. What are some drivers contributing to market growth?
Health Benefits Promoting Apple Cider Vinegar Demand; Unfiltered Apple Cider Vinegar Being Popular.
6. What are the notable trends driving market growth?
Rising Demand For Detoxifying Substances.
7. Are there any restraints impacting market growth?
Rising Demand for Other Vinegar Types.
8. Can you provide examples of recent developments in the market?
N/A
9. What pricing options are available for accessing the report?
Pricing options include single-user, multi-user, and enterprise licenses priced at USD 4750, USD 5250, and USD 8750 respectively.
10. Is the market size provided in terms of value or volume?
The market size is provided in terms of value, measured in million.
11. Are there any specific market keywords associated with the report?
Yes, the market keyword associated with the report is "Charcoal Industry," which aids in identifying and referencing the specific market segment covered.
12. How do I determine which pricing option suits my needs best?
The pricing options vary based on user requirements and access needs. Individual users may opt for single-user licenses, while businesses requiring broader access may choose multi-user or enterprise licenses for cost-effective access to the report.
13. Are there any additional resources or data provided in the Charcoal Industry report?
While the report offers comprehensive insights, it's advisable to review the specific contents or supplementary materials provided to ascertain if additional resources or data are available.
14. How can I stay updated on further developments or reports in the Charcoal Industry?
To stay informed about further developments, trends, and reports in the Charcoal Industry, consider subscribing to industry newsletters, following relevant companies and organizations, or regularly checking reputable industry news sources and publications.
Methodology
Step 1 - Identification of Relevant Samples Size from Population Database


Step 2 - Approaches for Defining Global Market Size (Value, Volume* & Price*)

Note*: In applicable scenarios
Step 3 - Data Sources
Primary Research
- Web Analytics
- Survey Reports
- Research Institute
- Latest Research Reports
- Opinion Leaders
Secondary Research
- Annual Reports
- White Paper
- Latest Press Release
- Industry Association
- Paid Database
- Investor Presentations

Step 4 - Data Triangulation
Involves using different sources of information in order to increase the validity of a study
These sources are likely to be stakeholders in a program - participants, other researchers, program staff, other community members, and so on.
Then we put all data in single framework & apply various statistical tools to find out the dynamic on the market.
During the analysis stage, feedback from the stakeholder groups would be compared to determine areas of agreement as well as areas of divergence