

Key Insights
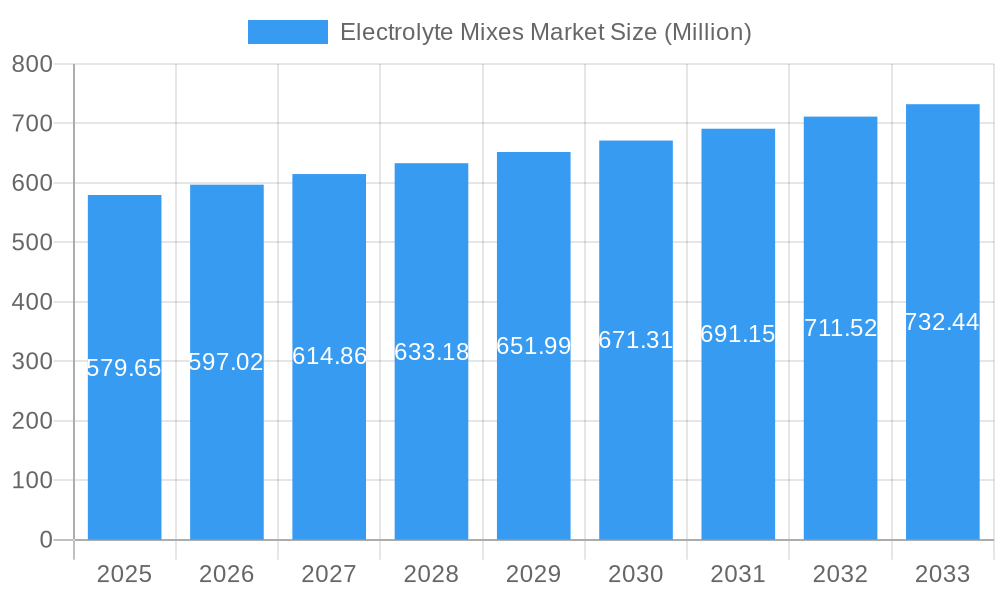
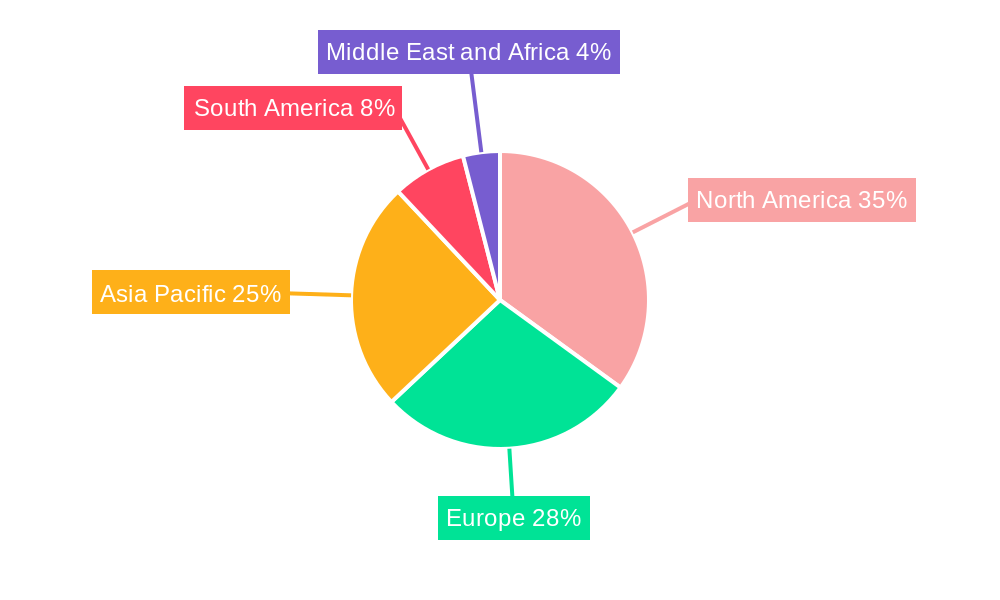
The global electrolyte mixes market, valued at $579.65 million in 2025, is projected to experience steady growth, driven by increasing health consciousness and rising participation in sports and fitness activities. Consumers are increasingly aware of the importance of hydration and electrolyte replenishment, particularly after intense physical exertion or during periods of dehydration. This trend is fueling demand across various product formats, including ready-to-drink (RTD) beverages, electrolyte powders, and tablets. The market is segmented by flavor (flavored and unflavored), distribution channel (supermarkets/hypermarkets, convenience stores, pharmacies, online retail, and others), and product type (RTD beverages, powders, and tablets). The dominance of specific segments will likely vary by region, reflecting differing consumer preferences and retail infrastructure. North America and Europe are expected to maintain significant market share due to high per capita consumption and established distribution networks, while the Asia-Pacific region shows considerable potential for future growth due to its expanding middle class and increasing health awareness. Competitive landscape analysis reveals key players such as Tailwind Nutrition, Nestlé SA, and PepsiCo Inc., engaged in product innovation, strategic partnerships, and brand building to capture market share.
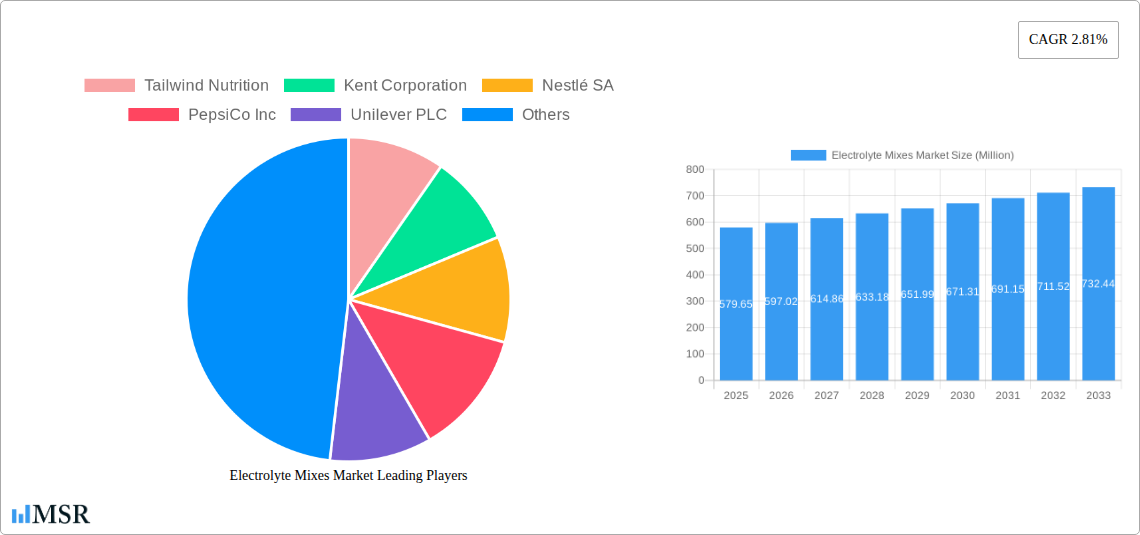
Electrolyte Mixes Market Market Size (In Million)
The market's growth trajectory, projected at a CAGR of 2.81%, is influenced by several factors. Sustained growth is anticipated across all product types, with RTD beverages maintaining a significant market share due to their convenience. However, the increasing popularity of powders and tablets, driven by their portability and cost-effectiveness, is expected to contribute to overall market expansion. While the market faces constraints like fluctuating raw material prices and intense competition, the ongoing emphasis on health and wellness, coupled with product diversification and targeted marketing strategies, will continue to propel market growth throughout the forecast period (2025-2033). Regional variations in growth will depend on factors such as economic development, climate conditions, and cultural preferences.
Electrolyte Mixes Market Company Market Share
Electrolyte Mixes Market Report: 2019-2033
This comprehensive report provides an in-depth analysis of the global electrolyte mixes market, offering actionable insights for stakeholders across the value chain. The study period covers 2019-2033, with 2025 as the base and estimated year, and a forecast period of 2025-2033. The historical period analyzed is 2019-2024. Expect detailed market sizing, segmentation, and competitive landscape analysis, uncovering key trends and growth opportunities in this dynamic market. The report is meticulously crafted to drive search visibility and attract industry professionals. Market value projections are provided in Millions.
Electrolyte Mixes Market Market Concentration & Dynamics
The global electrolyte mixes market exhibits a moderately concentrated landscape, with key players like Nestlé SA, PepsiCo Inc, and Unilever PLC holding significant market share. However, several smaller players, including Tailwind Nutrition, Kent Corporation, LyteLine LLC, Otsuka Holdings Co Ltd, Vitalyte Sports Nutrition Inc, Ultima Health Products Inc, and Abbott Laboratories, contribute significantly to innovation and competition. The market share distribution amongst these players is estimated to be xx% in 2025, with a projected xx% change by 2033.
The market's dynamics are shaped by several factors:
- Innovation Ecosystem: Continuous product innovation, focusing on new flavors, formats (RTD beverages, powders, tablets), and functional benefits (e.g., added probiotics, vitamins), drives market expansion.
- Regulatory Frameworks: Regulations concerning food safety and labeling significantly influence product development and marketing strategies.
- Substitute Products: Competition from other hydration beverages and dietary supplements necessitates continuous product differentiation.
- End-User Trends: Growing health consciousness and increasing participation in sports and fitness activities fuel demand for electrolyte mixes.
- M&A Activities: Recent acquisitions, like Nestlé Health Science's acquisition of Nuun in 2021, demonstrate consolidation and expansion strategies within the market. The number of M&A deals in the electrolyte mixes market between 2019 and 2024 was xx, projecting xx deals between 2025 and 2033.
Electrolyte Mixes Market Industry Insights & Trends
The global electrolyte mixes market is experiencing robust growth, driven by several factors. The market size in 2025 is estimated at $xx Million, with a projected CAGR of xx% from 2025 to 2033, reaching $xx Million by 2033. This growth is fueled by increasing health awareness, rising disposable incomes in developing economies, and the expanding fitness and sports nutrition industry. Technological advancements in product formulation, packaging, and distribution further propel market expansion. Changing consumer preferences toward convenient, functional, and naturally flavored products are reshaping the market landscape. The rise of e-commerce and online retail further expands distribution channels, making electrolyte mixes accessible to a wider consumer base. The increasing prevalence of chronic dehydration, particularly amongst athletes and individuals involved in strenuous activities, is also a significant driver. The demand for products with added benefits, such as probiotics and vitamins, is increasing rapidly.
Key Markets & Segments Leading Electrolyte Mixes Market
The North American region currently holds the largest market share for electrolyte mixes, followed by Europe and Asia-Pacific. Within segments:
- Product Type: RTD beverages dominate the market due to convenience, while electrolyte powders are witnessing strong growth due to affordability and customization options. Tablets represent a niche segment.
- Flavor: Flavored electrolyte mixes significantly outpace unflavored options, driven by consumer preference for enhanced taste experiences.
- Distribution Channel: Supermarkets/Hypermarkets and online retail stores are the leading distribution channels, reflecting growing accessibility and consumer shopping habits.
Drivers for Dominance:
- North America: High per capita income, well-established sports nutrition market, and increasing health consciousness contribute to this region's market leadership.
- RTD Beverages: Convenience and immediate consumption appeal to a broader consumer base.
- Flavored Electrolyte Mixes: Improved taste enhances consumer appeal and acceptance.
- Supermarkets/Hypermarkets: Wide accessibility and established distribution networks significantly contribute to market reach.
Electrolyte Mixes Market Product Developments
Recent innovations focus on enhanced taste profiles, functional benefits (e.g., added probiotics, vitamins, antioxidants), and sustainable packaging. Companies are incorporating natural ingredients and reducing added sugars to cater to evolving consumer preferences. Technological advancements in formulation and manufacturing processes lead to improved product stability, shelf life, and efficacy. The competitive landscape is characterized by ongoing product differentiation and innovation, driving the development of unique and value-added electrolyte mixes.
Challenges in the Electrolyte Mixes Market Market
The electrolyte mixes market faces challenges, including intense competition, fluctuating raw material costs, stringent regulatory requirements impacting product development and marketing, and potential supply chain disruptions. The prevalence of counterfeit products poses a threat to the market's integrity and consumer trust. These factors can influence market growth and profitability.
Forces Driving Electrolyte Mixes Market Growth
Several key factors drive market expansion: the increasing prevalence of lifestyle diseases emphasizing the importance of hydration; rising disposable incomes; the expanding sports and fitness culture; and technological advancements leading to innovative product formulations and distribution methods. Government initiatives promoting healthy lifestyles indirectly fuel market growth.
Challenges in the Electrolyte Mixes Market Market
Long-term growth relies on addressing challenges like fluctuating raw material prices and developing sustainable supply chains. Strategic partnerships and collaborations could enhance product innovation and market penetration. Expanding into untapped markets and catering to diverse consumer preferences will be key to sustained growth.
Emerging Opportunities in Electrolyte Mixes Market
Growing demand for functional beverages with added health benefits presents significant opportunities. The expanding e-commerce sector provides a new avenue for market expansion. Personalized and customized electrolyte mixes catering to specific needs and preferences represent a significant opportunity for future growth.
Leading Players in the Electrolyte Mixes Market Sector
- Tailwind Nutrition
- Kent Corporation
- Nestlé SA
- PepsiCo Inc
- Unilever PLC
- Abbott Laboratories
- LyteLine LLC
- Otsuka Holdings Co Ltd
- Vitalyte Sports Nutrition Inc
- Ultima Health Products Inc
Key Milestones in Electrolyte Mixes Market Industry
- JUL 2021: Nestlé Health Science's acquisition of Nuun significantly expanded its presence in the functional hydration market.
- MAR 2022: The Gatorade Canada and Canada Soccer partnership boosted Gatorade's brand visibility and market share.
- MAY 2022: Liquid IV's launch of Hydration Multiplier+ Powdered Probiotic Kombucha introduced a novel product with added functional benefits, targeting health-conscious consumers.
Strategic Outlook for Electrolyte Mixes Market Market
The electrolyte mixes market holds significant growth potential. Strategic partnerships, product diversification, expansion into new markets, and a focus on sustainability and ethical sourcing will be crucial for success. Companies should prioritize innovation and adapt to changing consumer preferences to maintain competitiveness and capture market share.
Electrolyte Mixes Market Segmentation
-
1. Product Type
- 1.1. RTD Beverages
- 1.2. Electrolyte Powders
- 1.3. Tablets
-
2. Flavor
- 2.1. Flavored
- 2.2. Unflavored
-
3. Distribution Channel
- 3.1. Supermarkets/Hypermarkets
- 3.2. Convenience Stores
- 3.3. Pharmacies/Drug Stores
- 3.4. Online Retail Stores
- 3.5. Other Distribution Channels
Electrolyte Mixes Market Segmentation By Geography
-
1. North America
- 1.1. United States
- 1.2. Canada
- 1.3. Mexico
- 1.4. Rest of North America
-
2. Europe
- 2.1. United Kingdom
- 2.2. Germany
- 2.3. France
- 2.4. Russia
- 2.5. Italy
- 2.6. Spain
- 2.7. Rest of Europe
-
3. Asia Pacific
- 3.1. China
- 3.2. India
- 3.3. Japan
- 3.4. Australia
- 3.5. Rest of Asia Pacific
-
4. South America
- 4.1. Brazil
- 4.2. Argentina
- 4.3. Rest of South America
-
5. Middle East and Africa
- 5.1. South Africa
- 5.2. United Arab Emirates
- 5.3. Rest of Middle East and Africa
Electrolyte Mixes Market Regional Market Share
Geographic Coverage of Electrolyte Mixes Market
Electrolyte Mixes Market REPORT HIGHLIGHTS
| Aspects | Details |
|---|---|
| Study Period | 2020-2034 |
| Base Year | 2025 |
| Estimated Year | 2026 |
| Forecast Period | 2026-2034 |
| Historical Period | 2020-2025 |
| Growth Rate | CAGR of 2.81% from 2020-2034 |
| Segmentation |
|
Table of Contents
- 1. Introduction
- 1.1. Research Scope
- 1.2. Market Segmentation
- 1.3. Research Methodology
- 1.4. Definitions and Assumptions
- 2. Executive Summary
- 2.1. Introduction
- 3. Market Dynamics
- 3.1. Introduction
- 3.2. Market Drivers
- 3.2.1. Rising Demand For Ready Meals Food Products to Influence Growth; Increasing Demand for Organic and Vegan Ready-to-Eat food products.
- 3.3. Market Restrains
- 3.3.1. Rising Concern Over Health Issues Associated with Processed Foods
- 3.4. Market Trends
- 3.4.1 Surging Interest Among Consumers in Physical Activities
- 3.4.2 Including Gyms
- 4. Market Factor Analysis
- 4.1. Porters Five Forces
- 4.2. Supply/Value Chain
- 4.3. PESTEL analysis
- 4.4. Market Entropy
- 4.5. Patent/Trademark Analysis
- 5. Global Electrolyte Mixes Market Analysis, Insights and Forecast, 2020-2032
- 5.1. Market Analysis, Insights and Forecast - by Product Type
- 5.1.1. RTD Beverages
- 5.1.2. Electrolyte Powders
- 5.1.3. Tablets
- 5.2. Market Analysis, Insights and Forecast - by Flavor
- 5.2.1. Flavored
- 5.2.2. Unflavored
- 5.3. Market Analysis, Insights and Forecast - by Distribution Channel
- 5.3.1. Supermarkets/Hypermarkets
- 5.3.2. Convenience Stores
- 5.3.3. Pharmacies/Drug Stores
- 5.3.4. Online Retail Stores
- 5.3.5. Other Distribution Channels
- 5.4. Market Analysis, Insights and Forecast - by Region
- 5.4.1. North America
- 5.4.2. Europe
- 5.4.3. Asia Pacific
- 5.4.4. South America
- 5.4.5. Middle East and Africa
- 5.1. Market Analysis, Insights and Forecast - by Product Type
- 6. North America Electrolyte Mixes Market Analysis, Insights and Forecast, 2020-2032
- 6.1. Market Analysis, Insights and Forecast - by Product Type
- 6.1.1. RTD Beverages
- 6.1.2. Electrolyte Powders
- 6.1.3. Tablets
- 6.2. Market Analysis, Insights and Forecast - by Flavor
- 6.2.1. Flavored
- 6.2.2. Unflavored
- 6.3. Market Analysis, Insights and Forecast - by Distribution Channel
- 6.3.1. Supermarkets/Hypermarkets
- 6.3.2. Convenience Stores
- 6.3.3. Pharmacies/Drug Stores
- 6.3.4. Online Retail Stores
- 6.3.5. Other Distribution Channels
- 6.1. Market Analysis, Insights and Forecast - by Product Type
- 7. Europe Electrolyte Mixes Market Analysis, Insights and Forecast, 2020-2032
- 7.1. Market Analysis, Insights and Forecast - by Product Type
- 7.1.1. RTD Beverages
- 7.1.2. Electrolyte Powders
- 7.1.3. Tablets
- 7.2. Market Analysis, Insights and Forecast - by Flavor
- 7.2.1. Flavored
- 7.2.2. Unflavored
- 7.3. Market Analysis, Insights and Forecast - by Distribution Channel
- 7.3.1. Supermarkets/Hypermarkets
- 7.3.2. Convenience Stores
- 7.3.3. Pharmacies/Drug Stores
- 7.3.4. Online Retail Stores
- 7.3.5. Other Distribution Channels
- 7.1. Market Analysis, Insights and Forecast - by Product Type
- 8. Asia Pacific Electrolyte Mixes Market Analysis, Insights and Forecast, 2020-2032
- 8.1. Market Analysis, Insights and Forecast - by Product Type
- 8.1.1. RTD Beverages
- 8.1.2. Electrolyte Powders
- 8.1.3. Tablets
- 8.2. Market Analysis, Insights and Forecast - by Flavor
- 8.2.1. Flavored
- 8.2.2. Unflavored
- 8.3. Market Analysis, Insights and Forecast - by Distribution Channel
- 8.3.1. Supermarkets/Hypermarkets
- 8.3.2. Convenience Stores
- 8.3.3. Pharmacies/Drug Stores
- 8.3.4. Online Retail Stores
- 8.3.5. Other Distribution Channels
- 8.1. Market Analysis, Insights and Forecast - by Product Type
- 9. South America Electrolyte Mixes Market Analysis, Insights and Forecast, 2020-2032
- 9.1. Market Analysis, Insights and Forecast - by Product Type
- 9.1.1. RTD Beverages
- 9.1.2. Electrolyte Powders
- 9.1.3. Tablets
- 9.2. Market Analysis, Insights and Forecast - by Flavor
- 9.2.1. Flavored
- 9.2.2. Unflavored
- 9.3. Market Analysis, Insights and Forecast - by Distribution Channel
- 9.3.1. Supermarkets/Hypermarkets
- 9.3.2. Convenience Stores
- 9.3.3. Pharmacies/Drug Stores
- 9.3.4. Online Retail Stores
- 9.3.5. Other Distribution Channels
- 9.1. Market Analysis, Insights and Forecast - by Product Type
- 10. Middle East and Africa Electrolyte Mixes Market Analysis, Insights and Forecast, 2020-2032
- 10.1. Market Analysis, Insights and Forecast - by Product Type
- 10.1.1. RTD Beverages
- 10.1.2. Electrolyte Powders
- 10.1.3. Tablets
- 10.2. Market Analysis, Insights and Forecast - by Flavor
- 10.2.1. Flavored
- 10.2.2. Unflavored
- 10.3. Market Analysis, Insights and Forecast - by Distribution Channel
- 10.3.1. Supermarkets/Hypermarkets
- 10.3.2. Convenience Stores
- 10.3.3. Pharmacies/Drug Stores
- 10.3.4. Online Retail Stores
- 10.3.5. Other Distribution Channels
- 10.1. Market Analysis, Insights and Forecast - by Product Type
- 11. Competitive Analysis
- 11.1. Global Market Share Analysis 2025
- 11.2. Company Profiles
- 11.2.1 Tailwind Nutrition
- 11.2.1.1. Overview
- 11.2.1.2. Products
- 11.2.1.3. SWOT Analysis
- 11.2.1.4. Recent Developments
- 11.2.1.5. Financials (Based on Availability)
- 11.2.2 Kent Corporation
- 11.2.2.1. Overview
- 11.2.2.2. Products
- 11.2.2.3. SWOT Analysis
- 11.2.2.4. Recent Developments
- 11.2.2.5. Financials (Based on Availability)
- 11.2.3 Nestlé SA
- 11.2.3.1. Overview
- 11.2.3.2. Products
- 11.2.3.3. SWOT Analysis
- 11.2.3.4. Recent Developments
- 11.2.3.5. Financials (Based on Availability)
- 11.2.4 PepsiCo Inc
- 11.2.4.1. Overview
- 11.2.4.2. Products
- 11.2.4.3. SWOT Analysis
- 11.2.4.4. Recent Developments
- 11.2.4.5. Financials (Based on Availability)
- 11.2.5 Unilever PLC
- 11.2.5.1. Overview
- 11.2.5.2. Products
- 11.2.5.3. SWOT Analysis
- 11.2.5.4. Recent Developments
- 11.2.5.5. Financials (Based on Availability)
- 11.2.6 Abbott Laboratories
- 11.2.6.1. Overview
- 11.2.6.2. Products
- 11.2.6.3. SWOT Analysis
- 11.2.6.4. Recent Developments
- 11.2.6.5. Financials (Based on Availability)
- 11.2.7 LyteLine LLC
- 11.2.7.1. Overview
- 11.2.7.2. Products
- 11.2.7.3. SWOT Analysis
- 11.2.7.4. Recent Developments
- 11.2.7.5. Financials (Based on Availability)
- 11.2.8 Otsuka Holdings Co Ltd
- 11.2.8.1. Overview
- 11.2.8.2. Products
- 11.2.8.3. SWOT Analysis
- 11.2.8.4. Recent Developments
- 11.2.8.5. Financials (Based on Availability)
- 11.2.9 Vitalyte Sports Nutrition Inc *List Not Exhaustive
- 11.2.9.1. Overview
- 11.2.9.2. Products
- 11.2.9.3. SWOT Analysis
- 11.2.9.4. Recent Developments
- 11.2.9.5. Financials (Based on Availability)
- 11.2.10 Ultima Health Products Inc
- 11.2.10.1. Overview
- 11.2.10.2. Products
- 11.2.10.3. SWOT Analysis
- 11.2.10.4. Recent Developments
- 11.2.10.5. Financials (Based on Availability)
- 11.2.1 Tailwind Nutrition
List of Figures
- Figure 1: Global Electrolyte Mixes Market Revenue Breakdown (Million, %) by Region 2025 & 2033
- Figure 2: North America Electrolyte Mixes Market Revenue (Million), by Product Type 2025 & 2033
- Figure 3: North America Electrolyte Mixes Market Revenue Share (%), by Product Type 2025 & 2033
- Figure 4: North America Electrolyte Mixes Market Revenue (Million), by Flavor 2025 & 2033
- Figure 5: North America Electrolyte Mixes Market Revenue Share (%), by Flavor 2025 & 2033
- Figure 6: North America Electrolyte Mixes Market Revenue (Million), by Distribution Channel 2025 & 2033
- Figure 7: North America Electrolyte Mixes Market Revenue Share (%), by Distribution Channel 2025 & 2033
- Figure 8: North America Electrolyte Mixes Market Revenue (Million), by Country 2025 & 2033
- Figure 9: North America Electrolyte Mixes Market Revenue Share (%), by Country 2025 & 2033
- Figure 10: Europe Electrolyte Mixes Market Revenue (Million), by Product Type 2025 & 2033
- Figure 11: Europe Electrolyte Mixes Market Revenue Share (%), by Product Type 2025 & 2033
- Figure 12: Europe Electrolyte Mixes Market Revenue (Million), by Flavor 2025 & 2033
- Figure 13: Europe Electrolyte Mixes Market Revenue Share (%), by Flavor 2025 & 2033
- Figure 14: Europe Electrolyte Mixes Market Revenue (Million), by Distribution Channel 2025 & 2033
- Figure 15: Europe Electrolyte Mixes Market Revenue Share (%), by Distribution Channel 2025 & 2033
- Figure 16: Europe Electrolyte Mixes Market Revenue (Million), by Country 2025 & 2033
- Figure 17: Europe Electrolyte Mixes Market Revenue Share (%), by Country 2025 & 2033
- Figure 18: Asia Pacific Electrolyte Mixes Market Revenue (Million), by Product Type 2025 & 2033
- Figure 19: Asia Pacific Electrolyte Mixes Market Revenue Share (%), by Product Type 2025 & 2033
- Figure 20: Asia Pacific Electrolyte Mixes Market Revenue (Million), by Flavor 2025 & 2033
- Figure 21: Asia Pacific Electrolyte Mixes Market Revenue Share (%), by Flavor 2025 & 2033
- Figure 22: Asia Pacific Electrolyte Mixes Market Revenue (Million), by Distribution Channel 2025 & 2033
- Figure 23: Asia Pacific Electrolyte Mixes Market Revenue Share (%), by Distribution Channel 2025 & 2033
- Figure 24: Asia Pacific Electrolyte Mixes Market Revenue (Million), by Country 2025 & 2033
- Figure 25: Asia Pacific Electrolyte Mixes Market Revenue Share (%), by Country 2025 & 2033
- Figure 26: South America Electrolyte Mixes Market Revenue (Million), by Product Type 2025 & 2033
- Figure 27: South America Electrolyte Mixes Market Revenue Share (%), by Product Type 2025 & 2033
- Figure 28: South America Electrolyte Mixes Market Revenue (Million), by Flavor 2025 & 2033
- Figure 29: South America Electrolyte Mixes Market Revenue Share (%), by Flavor 2025 & 2033
- Figure 30: South America Electrolyte Mixes Market Revenue (Million), by Distribution Channel 2025 & 2033
- Figure 31: South America Electrolyte Mixes Market Revenue Share (%), by Distribution Channel 2025 & 2033
- Figure 32: South America Electrolyte Mixes Market Revenue (Million), by Country 2025 & 2033
- Figure 33: South America Electrolyte Mixes Market Revenue Share (%), by Country 2025 & 2033
- Figure 34: Middle East and Africa Electrolyte Mixes Market Revenue (Million), by Product Type 2025 & 2033
- Figure 35: Middle East and Africa Electrolyte Mixes Market Revenue Share (%), by Product Type 2025 & 2033
- Figure 36: Middle East and Africa Electrolyte Mixes Market Revenue (Million), by Flavor 2025 & 2033
- Figure 37: Middle East and Africa Electrolyte Mixes Market Revenue Share (%), by Flavor 2025 & 2033
- Figure 38: Middle East and Africa Electrolyte Mixes Market Revenue (Million), by Distribution Channel 2025 & 2033
- Figure 39: Middle East and Africa Electrolyte Mixes Market Revenue Share (%), by Distribution Channel 2025 & 2033
- Figure 40: Middle East and Africa Electrolyte Mixes Market Revenue (Million), by Country 2025 & 2033
- Figure 41: Middle East and Africa Electrolyte Mixes Market Revenue Share (%), by Country 2025 & 2033
List of Tables
- Table 1: Global Electrolyte Mixes Market Revenue Million Forecast, by Product Type 2020 & 2033
- Table 2: Global Electrolyte Mixes Market Revenue Million Forecast, by Flavor 2020 & 2033
- Table 3: Global Electrolyte Mixes Market Revenue Million Forecast, by Distribution Channel 2020 & 2033
- Table 4: Global Electrolyte Mixes Market Revenue Million Forecast, by Region 2020 & 2033
- Table 5: Global Electrolyte Mixes Market Revenue Million Forecast, by Product Type 2020 & 2033
- Table 6: Global Electrolyte Mixes Market Revenue Million Forecast, by Flavor 2020 & 2033
- Table 7: Global Electrolyte Mixes Market Revenue Million Forecast, by Distribution Channel 2020 & 2033
- Table 8: Global Electrolyte Mixes Market Revenue Million Forecast, by Country 2020 & 2033
- Table 9: United States Electrolyte Mixes Market Revenue (Million) Forecast, by Application 2020 & 2033
- Table 10: Canada Electrolyte Mixes Market Revenue (Million) Forecast, by Application 2020 & 2033
- Table 11: Mexico Electrolyte Mixes Market Revenue (Million) Forecast, by Application 2020 & 2033
- Table 12: Rest of North America Electrolyte Mixes Market Revenue (Million) Forecast, by Application 2020 & 2033
- Table 13: Global Electrolyte Mixes Market Revenue Million Forecast, by Product Type 2020 & 2033
- Table 14: Global Electrolyte Mixes Market Revenue Million Forecast, by Flavor 2020 & 2033
- Table 15: Global Electrolyte Mixes Market Revenue Million Forecast, by Distribution Channel 2020 & 2033
- Table 16: Global Electrolyte Mixes Market Revenue Million Forecast, by Country 2020 & 2033
- Table 17: United Kingdom Electrolyte Mixes Market Revenue (Million) Forecast, by Application 2020 & 2033
- Table 18: Germany Electrolyte Mixes Market Revenue (Million) Forecast, by Application 2020 & 2033
- Table 19: France Electrolyte Mixes Market Revenue (Million) Forecast, by Application 2020 & 2033
- Table 20: Russia Electrolyte Mixes Market Revenue (Million) Forecast, by Application 2020 & 2033
- Table 21: Italy Electrolyte Mixes Market Revenue (Million) Forecast, by Application 2020 & 2033
- Table 22: Spain Electrolyte Mixes Market Revenue (Million) Forecast, by Application 2020 & 2033
- Table 23: Rest of Europe Electrolyte Mixes Market Revenue (Million) Forecast, by Application 2020 & 2033
- Table 24: Global Electrolyte Mixes Market Revenue Million Forecast, by Product Type 2020 & 2033
- Table 25: Global Electrolyte Mixes Market Revenue Million Forecast, by Flavor 2020 & 2033
- Table 26: Global Electrolyte Mixes Market Revenue Million Forecast, by Distribution Channel 2020 & 2033
- Table 27: Global Electrolyte Mixes Market Revenue Million Forecast, by Country 2020 & 2033
- Table 28: China Electrolyte Mixes Market Revenue (Million) Forecast, by Application 2020 & 2033
- Table 29: India Electrolyte Mixes Market Revenue (Million) Forecast, by Application 2020 & 2033
- Table 30: Japan Electrolyte Mixes Market Revenue (Million) Forecast, by Application 2020 & 2033
- Table 31: Australia Electrolyte Mixes Market Revenue (Million) Forecast, by Application 2020 & 2033
- Table 32: Rest of Asia Pacific Electrolyte Mixes Market Revenue (Million) Forecast, by Application 2020 & 2033
- Table 33: Global Electrolyte Mixes Market Revenue Million Forecast, by Product Type 2020 & 2033
- Table 34: Global Electrolyte Mixes Market Revenue Million Forecast, by Flavor 2020 & 2033
- Table 35: Global Electrolyte Mixes Market Revenue Million Forecast, by Distribution Channel 2020 & 2033
- Table 36: Global Electrolyte Mixes Market Revenue Million Forecast, by Country 2020 & 2033
- Table 37: Brazil Electrolyte Mixes Market Revenue (Million) Forecast, by Application 2020 & 2033
- Table 38: Argentina Electrolyte Mixes Market Revenue (Million) Forecast, by Application 2020 & 2033
- Table 39: Rest of South America Electrolyte Mixes Market Revenue (Million) Forecast, by Application 2020 & 2033
- Table 40: Global Electrolyte Mixes Market Revenue Million Forecast, by Product Type 2020 & 2033
- Table 41: Global Electrolyte Mixes Market Revenue Million Forecast, by Flavor 2020 & 2033
- Table 42: Global Electrolyte Mixes Market Revenue Million Forecast, by Distribution Channel 2020 & 2033
- Table 43: Global Electrolyte Mixes Market Revenue Million Forecast, by Country 2020 & 2033
- Table 44: South Africa Electrolyte Mixes Market Revenue (Million) Forecast, by Application 2020 & 2033
- Table 45: United Arab Emirates Electrolyte Mixes Market Revenue (Million) Forecast, by Application 2020 & 2033
- Table 46: Rest of Middle East and Africa Electrolyte Mixes Market Revenue (Million) Forecast, by Application 2020 & 2033
Frequently Asked Questions
1. What is the projected Compound Annual Growth Rate (CAGR) of the Electrolyte Mixes Market?
The projected CAGR is approximately 2.81%.
2. Which companies are prominent players in the Electrolyte Mixes Market?
Key companies in the market include Tailwind Nutrition, Kent Corporation, Nestlé SA, PepsiCo Inc, Unilever PLC, Abbott Laboratories, LyteLine LLC, Otsuka Holdings Co Ltd, Vitalyte Sports Nutrition Inc *List Not Exhaustive, Ultima Health Products Inc.
3. What are the main segments of the Electrolyte Mixes Market?
The market segments include Product Type, Flavor, Distribution Channel.
4. Can you provide details about the market size?
The market size is estimated to be USD 579.65 Million as of 2022.
5. What are some drivers contributing to market growth?
Rising Demand For Ready Meals Food Products to Influence Growth; Increasing Demand for Organic and Vegan Ready-to-Eat food products..
6. What are the notable trends driving market growth?
Surging Interest Among Consumers in Physical Activities. Including Gyms.
7. Are there any restraints impacting market growth?
Rising Concern Over Health Issues Associated with Processed Foods.
8. Can you provide examples of recent developments in the market?
MAY 2022: Liquid IV announced the launch of Hydration Multiplier+ Powdered Probiotic Kombucha, a blendable mixture that contains electrolytes, Liquid IV's BC30 Probiotic, which boasts an impressive 1 billion colony forming units (CFU), and a powdered kombucha. These components together help in boosting gut health.
9. What pricing options are available for accessing the report?
Pricing options include single-user, multi-user, and enterprise licenses priced at USD 4750, USD 5250, and USD 8750 respectively.
10. Is the market size provided in terms of value or volume?
The market size is provided in terms of value, measured in Million.
11. Are there any specific market keywords associated with the report?
Yes, the market keyword associated with the report is "Electrolyte Mixes Market," which aids in identifying and referencing the specific market segment covered.
12. How do I determine which pricing option suits my needs best?
The pricing options vary based on user requirements and access needs. Individual users may opt for single-user licenses, while businesses requiring broader access may choose multi-user or enterprise licenses for cost-effective access to the report.
13. Are there any additional resources or data provided in the Electrolyte Mixes Market report?
While the report offers comprehensive insights, it's advisable to review the specific contents or supplementary materials provided to ascertain if additional resources or data are available.
14. How can I stay updated on further developments or reports in the Electrolyte Mixes Market?
To stay informed about further developments, trends, and reports in the Electrolyte Mixes Market, consider subscribing to industry newsletters, following relevant companies and organizations, or regularly checking reputable industry news sources and publications.
Methodology
Step 1 - Identification of Relevant Samples Size from Population Database


Step 2 - Approaches for Defining Global Market Size (Value, Volume* & Price*)

Note*: In applicable scenarios
Step 3 - Data Sources
Primary Research
- Web Analytics
- Survey Reports
- Research Institute
- Latest Research Reports
- Opinion Leaders
Secondary Research
- Annual Reports
- White Paper
- Latest Press Release
- Industry Association
- Paid Database
- Investor Presentations

Step 4 - Data Triangulation
Involves using different sources of information in order to increase the validity of a study
These sources are likely to be stakeholders in a program - participants, other researchers, program staff, other community members, and so on.
Then we put all data in single framework & apply various statistical tools to find out the dynamic on the market.
During the analysis stage, feedback from the stakeholder groups would be compared to determine areas of agreement as well as areas of divergence