

Key Insights
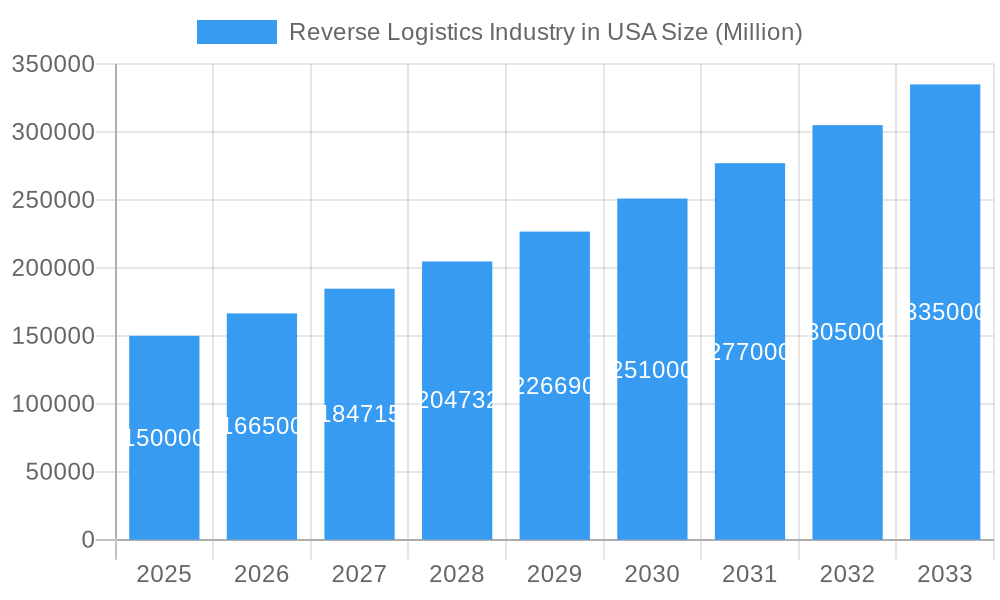
The US reverse logistics market, valued at approximately $XXX million in 2025, is experiencing robust growth, projected to maintain a CAGR exceeding 11% from 2025 to 2033. This expansion is fueled by several key drivers. The burgeoning e-commerce sector, with its high return rates, significantly contributes to market growth. Simultaneously, increasing consumer awareness of sustainability and the environmental impact of waste is driving demand for efficient and eco-friendly reverse logistics solutions. Furthermore, regulatory changes promoting product stewardship and extended producer responsibility are further stimulating market expansion. Key segments include consumer and retail (e-commerce, consumer electronics, apparel), automotive, and healthcare, with warehousing, transportation, and value-added services (like refurbishment and disposition) as prominent functional areas. Competition is intense, with established players like FedEx, UPS, and DHL alongside specialized providers like Happy Returns and Optoro vying for market share. Geographic distribution reflects the concentration of economic activity, with the Northeast, West, and Southeast regions likely holding the largest shares. However, growth potential exists across all regions as businesses increasingly prioritize efficient and cost-effective reverse logistics strategies.
Reverse Logistics Industry in USA Market Size (In Billion)
While the market enjoys strong growth, challenges remain. These include rising transportation costs, the complexity of managing returns across diverse product categories, and the need for advanced technological solutions to optimize reverse logistics processes. Companies are investing in technology like AI-powered route optimization and automated sorting systems to address these challenges and enhance efficiency. The integration of data analytics also plays a crucial role in improving forecasting, inventory management, and overall supply chain visibility within reverse logistics operations. The future trajectory of the market is positive, driven by ongoing e-commerce expansion, heightened sustainability concerns, and ongoing technological advancements designed to make reverse logistics more efficient, cost-effective, and environmentally conscious. The market's success will hinge on companies' ability to adapt to evolving consumer expectations and regulatory landscapes.
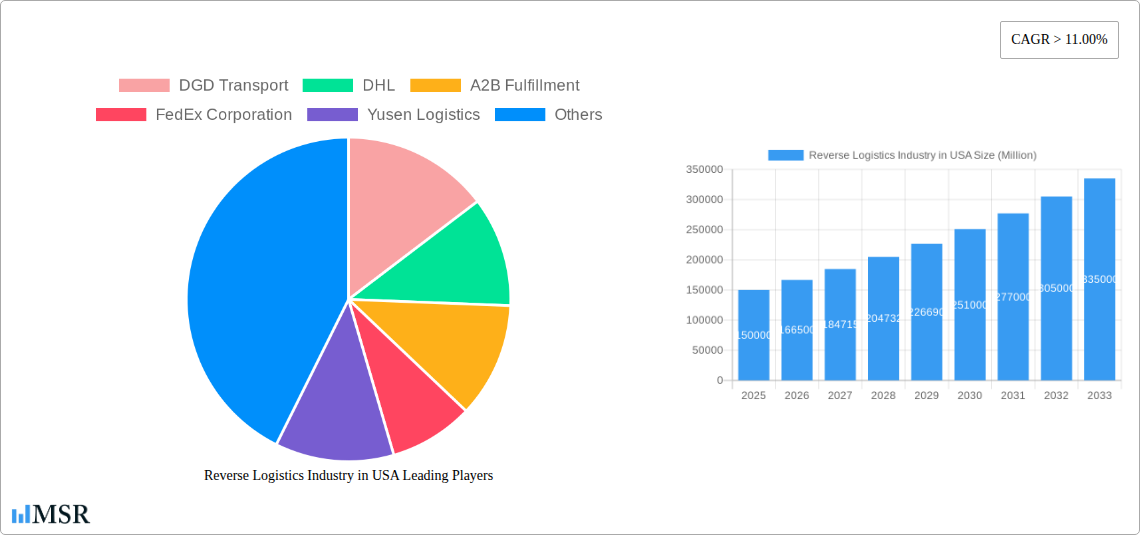
Reverse Logistics Industry in USA Company Market Share
Reverse Logistics Industry in USA: A Comprehensive Market Report (2019-2033)
This comprehensive report provides an in-depth analysis of the Reverse Logistics Industry in the USA, covering market dynamics, key players, growth drivers, and future trends from 2019 to 2033. The study period spans 2019-2033, with 2025 as the base and estimated year. The forecast period extends from 2025-2033, analyzing historical data from 2019-2024. This report is crucial for industry stakeholders, investors, and businesses seeking to understand and capitalize on the burgeoning opportunities within this dynamic sector. The US Reverse Logistics market is projected to reach xx Million by 2033.
Reverse Logistics Industry in USA Market Concentration & Dynamics
The US reverse logistics market exhibits a moderately concentrated landscape, with key players like FedEx Corporation, UPS, and DHL holding significant market share. However, the market is also characterized by a growing number of smaller specialized firms, particularly in niche areas like e-commerce returns and refurbishment. Innovation is primarily driven by technological advancements in automation, data analytics, and software solutions for return management. Regulatory frameworks, particularly those concerning environmental compliance and data privacy, significantly impact operations. Substitute products are limited, but increased focus on sustainable practices influences the market. Consumer behavior shifts towards online shopping and increasing return rates fuel market expansion. M&A activity remains moderate, with approximately xx deals recorded between 2019 and 2024, primarily focused on consolidating capabilities and expanding geographical reach.
- Market Share: FedEx Corporation and UPS hold a combined market share of approximately xx%, while DHL holds approximately xx%. Smaller players contribute the remaining xx%.
- M&A Activity: An estimated xx M&A deals occurred between 2019 and 2024, resulting in xx Million in total deal value.
Reverse Logistics Industry in USA Industry Insights & Trends
The US reverse logistics market is experiencing robust growth, driven by the explosive expansion of e-commerce, the increasing complexity of supply chains, and a growing focus on sustainability. The market size reached xx Million in 2025 and is projected to experience a Compound Annual Growth Rate (CAGR) of xx% from 2025 to 2033. Technological disruptions, including the rise of AI-powered automation and advanced analytics, are revolutionizing efficiency and cost-effectiveness. Evolving consumer behavior, characterized by increased online purchasing and higher return rates, is a key driver of market expansion. The growing preference for sustainable and environmentally friendly reverse logistics practices also presents both challenges and opportunities for market participants.
Key Markets & Segments Leading Reverse Logistics Industry in USA
The Consumer and Retail segment, encompassing e-commerce, consumer electronics, and apparel, dominates the US reverse logistics market. This is followed by the Healthcare and Pharmaceuticals sector, driven by stringent regulatory requirements and the need for efficient handling of sensitive materials.
By End User:
- Consumer and Retail: This segment's growth is driven by rising e-commerce sales, higher return rates, and increased focus on customer satisfaction.
- Automotive: This segment is driven by vehicle recalls, parts returns, and end-of-life vehicle management.
- Healthcare and Pharmaceuticals: Stringent regulatory compliance and the need for specialized handling drive growth in this sector.
By Function:
- Transportation: This segment accounts for a significant portion of market revenue, with road transport dominating the landscape.
- Warehousing: Demand for warehousing space is increasing to accommodate the rising volume of returned goods.
- Value-added Services: Services such as return processing, refurbishment, and disposal are becoming increasingly important, driven by the focus on sustainability.
Growth Drivers:
- Rapid growth in e-commerce.
- Increased consumer return rates.
- Stringent environmental regulations.
- Technological advancements in automation and analytics.
Reverse Logistics Industry in USA Product Developments
Recent product innovations focus on improving efficiency and transparency in the reverse logistics process. Software solutions offer real-time tracking and management of returns, while automation technologies streamline warehousing and processing. These advancements provide significant competitive advantages by reducing costs, improving efficiency, and enhancing customer satisfaction. The integration of AI and machine learning is particularly impactful, optimizing decision-making and resource allocation.
Challenges in the Reverse Logistics Industry in USA Market
The US reverse logistics industry faces challenges including increasingly complex regulatory compliance requirements, escalating transportation costs, and intense competition. Supply chain disruptions can significantly impact operations, leading to delays and increased costs. These factors impact profitability and require innovative solutions for efficient and cost-effective management of reverse logistics flows. Furthermore, managing the environmental impact of returns is a growing concern for businesses.
Forces Driving Reverse Logistics Industry in USA Growth
Technological advancements, particularly in automation and data analytics, are key drivers of growth. The expansion of e-commerce continues to fuel demand for efficient and cost-effective return processes. Government regulations promoting sustainability are also shaping industry practices, creating opportunities for innovative solutions.
Challenges in the Reverse Logistics Industry in USA Market
Long-term growth will depend on continued innovation in automation, AI, and data analytics. Strategic partnerships and collaborations will be crucial for optimizing supply chain efficiency and enhancing customer experiences. Expansion into new markets and service offerings will also contribute to sustainable growth.
Emerging Opportunities in Reverse Logistics Industry in USA
Emerging opportunities lie in the growing demand for sustainable and environmentally friendly solutions, the adoption of advanced technologies like AI and blockchain for improved tracking and management, and the expansion into new markets and service offerings. Companies are developing innovative solutions to address the challenges of managing returns in a cost-effective and environmentally responsible manner.
Leading Players in the Reverse Logistics Industry in USA Sector
- DGD Transport
- DHL
- A2B Fulfillment
- FedEx Corporation
- Yusen Logistics
- United Parcel Service (UPS)
- YRC Worldwide Inc
- 7 COMPANY PROFILES
- C.H. Robinson Worldwide Inc
- XPO Logistics
- Excelsior Integrated LLC
- Happy Returns Inc
- American Distribution Inc
- FW Logistics
- Newgistics Inc
- United States Postal Service (USPS)
- Optoro
Key Milestones in Reverse Logistics Industry in USA Industry
- 2020: Increased focus on sustainable reverse logistics practices.
- 2021: Several major players invested heavily in automation technologies.
- 2022: Significant growth in the adoption of AI-powered return management software.
- 2023: Several mergers and acquisitions aimed at consolidating market share.
- 2024: Growing adoption of blockchain technology for enhanced transparency.
Strategic Outlook for Reverse Logistics Industry in USA Market
The US reverse logistics market presents significant growth potential, driven by e-commerce expansion, technological advancements, and a growing emphasis on sustainability. Companies that can effectively leverage technology, optimize supply chains, and offer innovative solutions will be well-positioned to capitalize on these opportunities and achieve strong growth in the coming years. Strategic partnerships and investments in cutting-edge technologies will play a crucial role in shaping the future of the industry.
Reverse Logistics Industry in USA Segmentation
-
1. Function
-
1.1. Transportation
- 1.1.1. Road
- 1.1.2. Air
- 1.1.3. Other Modes of Transportation
- 1.2. Warehous
- 1.3. Other Va
-
1.1. Transportation
-
2. End User
- 2.1. Consumer
- 2.2. Automotive
- 2.3. Healthcare and Pharmaceuticals
- 2.4. Other Industrial Activity Sectors
- 2.5. Other End Users
Reverse Logistics Industry in USA Segmentation By Geography
-
1. North America
- 1.1. United States
- 1.2. Canada
- 1.3. Mexico
-
2. South America
- 2.1. Brazil
- 2.2. Argentina
- 2.3. Rest of South America
-
3. Europe
- 3.1. United Kingdom
- 3.2. Germany
- 3.3. France
- 3.4. Italy
- 3.5. Spain
- 3.6. Russia
- 3.7. Benelux
- 3.8. Nordics
- 3.9. Rest of Europe
-
4. Middle East & Africa
- 4.1. Turkey
- 4.2. Israel
- 4.3. GCC
- 4.4. North Africa
- 4.5. South Africa
- 4.6. Rest of Middle East & Africa
-
5. Asia Pacific
- 5.1. China
- 5.2. India
- 5.3. Japan
- 5.4. South Korea
- 5.5. ASEAN
- 5.6. Oceania
- 5.7. Rest of Asia Pacific
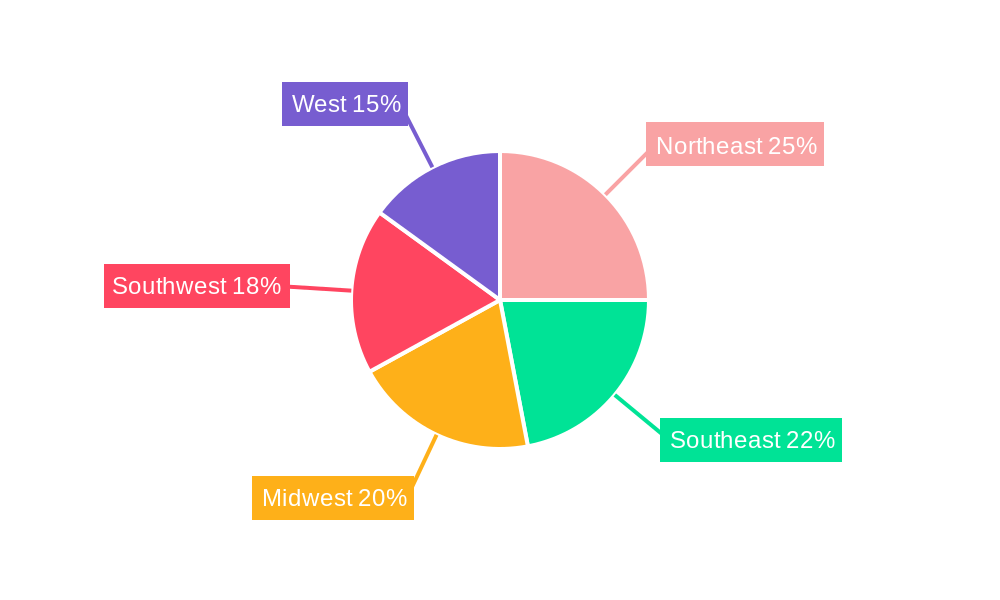
Reverse Logistics Industry in USA Regional Market Share
Geographic Coverage of Reverse Logistics Industry in USA
Reverse Logistics Industry in USA REPORT HIGHLIGHTS
| Aspects | Details |
|---|---|
| Study Period | 2020-2034 |
| Base Year | 2025 |
| Estimated Year | 2026 |
| Forecast Period | 2026-2034 |
| Historical Period | 2020-2025 |
| Growth Rate | CAGR of 6.2% from 2020-2034 |
| Segmentation |
|
Table of Contents
- 1. Introduction
- 1.1. Research Scope
- 1.2. Market Segmentation
- 1.3. Research Objective
- 1.4. Definitions and Assumptions
- 2. Executive Summary
- 2.1. Market Snapshot
- 3. Market Dynamics
- 3.1. Market Drivers
- 3.2. Market Restrains
- 3.3. Market Trends
- 3.4. Market Opportunities
- 4. Market Factor Analysis
- 4.1. Porters Five Forces
- 4.1.1. Bargaining Power of Suppliers
- 4.1.2. Bargaining Power of Buyers
- 4.1.3. Threat of New Entrants
- 4.1.4. Threat of Substitutes
- 4.1.5. Competitive Rivalry
- 4.2. PESTEL analysis
- 4.3. BCG Analysis
- 4.3.1. Stars (High Growth, High Market Share)
- 4.3.2. Cash Cows (Low Growth, High Market Share)
- 4.3.3. Question Mark (High Growth, Low Market Share)
- 4.3.4. Dogs (Low Growth, Low Market Share)
- 4.4. Ansoff Matrix Analysis
- 4.5. Supply Chain Analysis
- 4.6. Regulatory Landscape
- 4.7. Current Market Potential and Opportunity Assessment (TAM–SAM–SOM Framework)
- 4.8. MSR Analyst Note
- 4.1. Porters Five Forces
- 5. Market Analysis, Insights and Forecast 2021-2033
- 5.1. Market Analysis, Insights and Forecast - by Function
- 5.1.1. Transportation
- 5.1.1.1. Road
- 5.1.1.2. Air
- 5.1.1.3. Other Modes of Transportation
- 5.1.2. Warehous
- 5.1.3. Other Va
- 5.1.1. Transportation
- 5.2. Market Analysis, Insights and Forecast - by End User
- 5.2.1. Consumer
- 5.2.2. Automotive
- 5.2.3. Healthcare and Pharmaceuticals
- 5.2.4. Other Industrial Activity Sectors
- 5.2.5. Other End Users
- 5.3. Market Analysis, Insights and Forecast - by Region
- 5.3.1. North America
- 5.3.2. South America
- 5.3.3. Europe
- 5.3.4. Middle East & Africa
- 5.3.5. Asia Pacific
- 5.1. Market Analysis, Insights and Forecast - by Function
- 6. Global Reverse Logistics Industry in USA Analysis, Insights and Forecast, 2021-2033
- 6.1. Market Analysis, Insights and Forecast - by Function
- 6.1.1. Transportation
- 6.1.1.1. Road
- 6.1.1.2. Air
- 6.1.1.3. Other Modes of Transportation
- 6.1.2. Warehous
- 6.1.3. Other Va
- 6.1.1. Transportation
- 6.2. Market Analysis, Insights and Forecast - by End User
- 6.2.1. Consumer
- 6.2.2. Automotive
- 6.2.3. Healthcare and Pharmaceuticals
- 6.2.4. Other Industrial Activity Sectors
- 6.2.5. Other End Users
- 6.1. Market Analysis, Insights and Forecast - by Function
- 7. North America Reverse Logistics Industry in USA Analysis, Insights and Forecast, 2020-2032
- 7.1. Market Analysis, Insights and Forecast - by Function
- 7.1.1. Transportation
- 7.1.1.1. Road
- 7.1.1.2. Air
- 7.1.1.3. Other Modes of Transportation
- 7.1.2. Warehous
- 7.1.3. Other Va
- 7.1.1. Transportation
- 7.2. Market Analysis, Insights and Forecast - by End User
- 7.2.1. Consumer
- 7.2.2. Automotive
- 7.2.3. Healthcare and Pharmaceuticals
- 7.2.4. Other Industrial Activity Sectors
- 7.2.5. Other End Users
- 7.1. Market Analysis, Insights and Forecast - by Function
- 8. South America Reverse Logistics Industry in USA Analysis, Insights and Forecast, 2020-2032
- 8.1. Market Analysis, Insights and Forecast - by Function
- 8.1.1. Transportation
- 8.1.1.1. Road
- 8.1.1.2. Air
- 8.1.1.3. Other Modes of Transportation
- 8.1.2. Warehous
- 8.1.3. Other Va
- 8.1.1. Transportation
- 8.2. Market Analysis, Insights and Forecast - by End User
- 8.2.1. Consumer
- 8.2.2. Automotive
- 8.2.3. Healthcare and Pharmaceuticals
- 8.2.4. Other Industrial Activity Sectors
- 8.2.5. Other End Users
- 8.1. Market Analysis, Insights and Forecast - by Function
- 9. Europe Reverse Logistics Industry in USA Analysis, Insights and Forecast, 2020-2032
- 9.1. Market Analysis, Insights and Forecast - by Function
- 9.1.1. Transportation
- 9.1.1.1. Road
- 9.1.1.2. Air
- 9.1.1.3. Other Modes of Transportation
- 9.1.2. Warehous
- 9.1.3. Other Va
- 9.1.1. Transportation
- 9.2. Market Analysis, Insights and Forecast - by End User
- 9.2.1. Consumer
- 9.2.2. Automotive
- 9.2.3. Healthcare and Pharmaceuticals
- 9.2.4. Other Industrial Activity Sectors
- 9.2.5. Other End Users
- 9.1. Market Analysis, Insights and Forecast - by Function
- 10. Middle East & Africa Reverse Logistics Industry in USA Analysis, Insights and Forecast, 2020-2032
- 10.1. Market Analysis, Insights and Forecast - by Function
- 10.1.1. Transportation
- 10.1.1.1. Road
- 10.1.1.2. Air
- 10.1.1.3. Other Modes of Transportation
- 10.1.2. Warehous
- 10.1.3. Other Va
- 10.1.1. Transportation
- 10.2. Market Analysis, Insights and Forecast - by End User
- 10.2.1. Consumer
- 10.2.2. Automotive
- 10.2.3. Healthcare and Pharmaceuticals
- 10.2.4. Other Industrial Activity Sectors
- 10.2.5. Other End Users
- 10.1. Market Analysis, Insights and Forecast - by Function
- 11. Asia Pacific Reverse Logistics Industry in USA Analysis, Insights and Forecast, 2020-2032
- 11.1. Market Analysis, Insights and Forecast - by Function
- 11.1.1. Transportation
- 11.1.1.1. Road
- 11.1.1.2. Air
- 11.1.1.3. Other Modes of Transportation
- 11.1.2. Warehous
- 11.1.3. Other Va
- 11.1.1. Transportation
- 11.2. Market Analysis, Insights and Forecast - by End User
- 11.2.1. Consumer
- 11.2.2. Automotive
- 11.2.3. Healthcare and Pharmaceuticals
- 11.2.4. Other Industrial Activity Sectors
- 11.2.5. Other End Users
- 11.1. Market Analysis, Insights and Forecast - by Function
- 12. Competitive Analysis
- 12.1. Company Profiles
- 12.1.1 DGD Transport
- 12.1.1.1. Company Overview
- 12.1.1.2. Products
- 12.1.1.3. Company Financials
- 12.1.1.4. SWOT Analysis
- 12.1.2 DHL
- 12.1.2.1. Company Overview
- 12.1.2.2. Products
- 12.1.2.3. Company Financials
- 12.1.2.4. SWOT Analysis
- 12.1.3 A2B Fulfillment
- 12.1.3.1. Company Overview
- 12.1.3.2. Products
- 12.1.3.3. Company Financials
- 12.1.3.4. SWOT Analysis
- 12.1.4 FedEx Corporation
- 12.1.4.1. Company Overview
- 12.1.4.2. Products
- 12.1.4.3. Company Financials
- 12.1.4.4. SWOT Analysis
- 12.1.5 Yusen Logistics
- 12.1.5.1. Company Overview
- 12.1.5.2. Products
- 12.1.5.3. Company Financials
- 12.1.5.4. SWOT Analysis
- 12.1.6 United Parcel Service (UPS)
- 12.1.6.1. Company Overview
- 12.1.6.2. Products
- 12.1.6.3. Company Financials
- 12.1.6.4. SWOT Analysis
- 12.1.7 YRC Worldwide Inc
- 12.1.7.1. Company Overview
- 12.1.7.2. Products
- 12.1.7.3. Company Financials
- 12.1.7.4. SWOT Analysis
- 12.1.8 7 COMPANY PROFILES
- 12.1.8.1. Company Overview
- 12.1.8.2. Products
- 12.1.8.3. Company Financials
- 12.1.8.4. SWOT Analysis
- 12.1.9 C H Robinson Worldwide Inc
- 12.1.9.1. Company Overview
- 12.1.9.2. Products
- 12.1.9.3. Company Financials
- 12.1.9.4. SWOT Analysis
- 12.1.10 XPO Logistics
- 12.1.10.1. Company Overview
- 12.1.10.2. Products
- 12.1.10.3. Company Financials
- 12.1.10.4. SWOT Analysis
- 12.1.11 Excelsior Integrated LLC
- 12.1.11.1. Company Overview
- 12.1.11.2. Products
- 12.1.11.3. Company Financials
- 12.1.11.4. SWOT Analysis
- 12.1.12 Happy Returns Inc
- 12.1.12.1. Company Overview
- 12.1.12.2. Products
- 12.1.12.3. Company Financials
- 12.1.12.4. SWOT Analysis
- 12.1.13 American Distribution Inc
- 12.1.13.1. Company Overview
- 12.1.13.2. Products
- 12.1.13.3. Company Financials
- 12.1.13.4. SWOT Analysis
- 12.1.14 FW Logistics
- 12.1.14.1. Company Overview
- 12.1.14.2. Products
- 12.1.14.3. Company Financials
- 12.1.14.4. SWOT Analysis
- 12.1.15 Newgistics Inc
- 12.1.15.1. Company Overview
- 12.1.15.2. Products
- 12.1.15.3. Company Financials
- 12.1.15.4. SWOT Analysis
- 12.1.16 United States Postal Service (USPS)
- 12.1.16.1. Company Overview
- 12.1.16.2. Products
- 12.1.16.3. Company Financials
- 12.1.16.4. SWOT Analysis
- 12.1.17 Optoro
- 12.1.17.1. Company Overview
- 12.1.17.2. Products
- 12.1.17.3. Company Financials
- 12.1.17.4. SWOT Analysis
- 12.1.1 DGD Transport
- 12.2. Market Entropy
- 12.2.1 Company's Key Areas Served
- 12.2.2 Recent Developments
- 12.3. Company Market Share Analysis 2025
- 12.3.1 Top 5 Companies Market Share Analysis
- 12.3.2 Top 3 Companies Market Share Analysis
- 12.4. List of Potential Customers
- 13. Research Methodology
List of Figures
- Figure 1: Global Reverse Logistics Industry in USA Revenue Breakdown (undefined, %) by Region 2025 & 2033
- Figure 2: North America Reverse Logistics Industry in USA Revenue (undefined), by Function 2025 & 2033
- Figure 3: North America Reverse Logistics Industry in USA Revenue Share (%), by Function 2025 & 2033
- Figure 4: North America Reverse Logistics Industry in USA Revenue (undefined), by End User 2025 & 2033
- Figure 5: North America Reverse Logistics Industry in USA Revenue Share (%), by End User 2025 & 2033
- Figure 6: North America Reverse Logistics Industry in USA Revenue (undefined), by Country 2025 & 2033
- Figure 7: North America Reverse Logistics Industry in USA Revenue Share (%), by Country 2025 & 2033
- Figure 8: South America Reverse Logistics Industry in USA Revenue (undefined), by Function 2025 & 2033
- Figure 9: South America Reverse Logistics Industry in USA Revenue Share (%), by Function 2025 & 2033
- Figure 10: South America Reverse Logistics Industry in USA Revenue (undefined), by End User 2025 & 2033
- Figure 11: South America Reverse Logistics Industry in USA Revenue Share (%), by End User 2025 & 2033
- Figure 12: South America Reverse Logistics Industry in USA Revenue (undefined), by Country 2025 & 2033
- Figure 13: South America Reverse Logistics Industry in USA Revenue Share (%), by Country 2025 & 2033
- Figure 14: Europe Reverse Logistics Industry in USA Revenue (undefined), by Function 2025 & 2033
- Figure 15: Europe Reverse Logistics Industry in USA Revenue Share (%), by Function 2025 & 2033
- Figure 16: Europe Reverse Logistics Industry in USA Revenue (undefined), by End User 2025 & 2033
- Figure 17: Europe Reverse Logistics Industry in USA Revenue Share (%), by End User 2025 & 2033
- Figure 18: Europe Reverse Logistics Industry in USA Revenue (undefined), by Country 2025 & 2033
- Figure 19: Europe Reverse Logistics Industry in USA Revenue Share (%), by Country 2025 & 2033
- Figure 20: Middle East & Africa Reverse Logistics Industry in USA Revenue (undefined), by Function 2025 & 2033
- Figure 21: Middle East & Africa Reverse Logistics Industry in USA Revenue Share (%), by Function 2025 & 2033
- Figure 22: Middle East & Africa Reverse Logistics Industry in USA Revenue (undefined), by End User 2025 & 2033
- Figure 23: Middle East & Africa Reverse Logistics Industry in USA Revenue Share (%), by End User 2025 & 2033
- Figure 24: Middle East & Africa Reverse Logistics Industry in USA Revenue (undefined), by Country 2025 & 2033
- Figure 25: Middle East & Africa Reverse Logistics Industry in USA Revenue Share (%), by Country 2025 & 2033
- Figure 26: Asia Pacific Reverse Logistics Industry in USA Revenue (undefined), by Function 2025 & 2033
- Figure 27: Asia Pacific Reverse Logistics Industry in USA Revenue Share (%), by Function 2025 & 2033
- Figure 28: Asia Pacific Reverse Logistics Industry in USA Revenue (undefined), by End User 2025 & 2033
- Figure 29: Asia Pacific Reverse Logistics Industry in USA Revenue Share (%), by End User 2025 & 2033
- Figure 30: Asia Pacific Reverse Logistics Industry in USA Revenue (undefined), by Country 2025 & 2033
- Figure 31: Asia Pacific Reverse Logistics Industry in USA Revenue Share (%), by Country 2025 & 2033
List of Tables
- Table 1: Global Reverse Logistics Industry in USA Revenue undefined Forecast, by Function 2020 & 2033
- Table 2: Global Reverse Logistics Industry in USA Revenue undefined Forecast, by End User 2020 & 2033
- Table 3: Global Reverse Logistics Industry in USA Revenue undefined Forecast, by Region 2020 & 2033
- Table 4: Global Reverse Logistics Industry in USA Revenue undefined Forecast, by Function 2020 & 2033
- Table 5: Global Reverse Logistics Industry in USA Revenue undefined Forecast, by End User 2020 & 2033
- Table 6: Global Reverse Logistics Industry in USA Revenue undefined Forecast, by Country 2020 & 2033
- Table 7: United States Reverse Logistics Industry in USA Revenue (undefined) Forecast, by Application 2020 & 2033
- Table 8: Canada Reverse Logistics Industry in USA Revenue (undefined) Forecast, by Application 2020 & 2033
- Table 9: Mexico Reverse Logistics Industry in USA Revenue (undefined) Forecast, by Application 2020 & 2033
- Table 10: Global Reverse Logistics Industry in USA Revenue undefined Forecast, by Function 2020 & 2033
- Table 11: Global Reverse Logistics Industry in USA Revenue undefined Forecast, by End User 2020 & 2033
- Table 12: Global Reverse Logistics Industry in USA Revenue undefined Forecast, by Country 2020 & 2033
- Table 13: Brazil Reverse Logistics Industry in USA Revenue (undefined) Forecast, by Application 2020 & 2033
- Table 14: Argentina Reverse Logistics Industry in USA Revenue (undefined) Forecast, by Application 2020 & 2033
- Table 15: Rest of South America Reverse Logistics Industry in USA Revenue (undefined) Forecast, by Application 2020 & 2033
- Table 16: Global Reverse Logistics Industry in USA Revenue undefined Forecast, by Function 2020 & 2033
- Table 17: Global Reverse Logistics Industry in USA Revenue undefined Forecast, by End User 2020 & 2033
- Table 18: Global Reverse Logistics Industry in USA Revenue undefined Forecast, by Country 2020 & 2033
- Table 19: United Kingdom Reverse Logistics Industry in USA Revenue (undefined) Forecast, by Application 2020 & 2033
- Table 20: Germany Reverse Logistics Industry in USA Revenue (undefined) Forecast, by Application 2020 & 2033
- Table 21: France Reverse Logistics Industry in USA Revenue (undefined) Forecast, by Application 2020 & 2033
- Table 22: Italy Reverse Logistics Industry in USA Revenue (undefined) Forecast, by Application 2020 & 2033
- Table 23: Spain Reverse Logistics Industry in USA Revenue (undefined) Forecast, by Application 2020 & 2033
- Table 24: Russia Reverse Logistics Industry in USA Revenue (undefined) Forecast, by Application 2020 & 2033
- Table 25: Benelux Reverse Logistics Industry in USA Revenue (undefined) Forecast, by Application 2020 & 2033
- Table 26: Nordics Reverse Logistics Industry in USA Revenue (undefined) Forecast, by Application 2020 & 2033
- Table 27: Rest of Europe Reverse Logistics Industry in USA Revenue (undefined) Forecast, by Application 2020 & 2033
- Table 28: Global Reverse Logistics Industry in USA Revenue undefined Forecast, by Function 2020 & 2033
- Table 29: Global Reverse Logistics Industry in USA Revenue undefined Forecast, by End User 2020 & 2033
- Table 30: Global Reverse Logistics Industry in USA Revenue undefined Forecast, by Country 2020 & 2033
- Table 31: Turkey Reverse Logistics Industry in USA Revenue (undefined) Forecast, by Application 2020 & 2033
- Table 32: Israel Reverse Logistics Industry in USA Revenue (undefined) Forecast, by Application 2020 & 2033
- Table 33: GCC Reverse Logistics Industry in USA Revenue (undefined) Forecast, by Application 2020 & 2033
- Table 34: North Africa Reverse Logistics Industry in USA Revenue (undefined) Forecast, by Application 2020 & 2033
- Table 35: South Africa Reverse Logistics Industry in USA Revenue (undefined) Forecast, by Application 2020 & 2033
- Table 36: Rest of Middle East & Africa Reverse Logistics Industry in USA Revenue (undefined) Forecast, by Application 2020 & 2033
- Table 37: Global Reverse Logistics Industry in USA Revenue undefined Forecast, by Function 2020 & 2033
- Table 38: Global Reverse Logistics Industry in USA Revenue undefined Forecast, by End User 2020 & 2033
- Table 39: Global Reverse Logistics Industry in USA Revenue undefined Forecast, by Country 2020 & 2033
- Table 40: China Reverse Logistics Industry in USA Revenue (undefined) Forecast, by Application 2020 & 2033
- Table 41: India Reverse Logistics Industry in USA Revenue (undefined) Forecast, by Application 2020 & 2033
- Table 42: Japan Reverse Logistics Industry in USA Revenue (undefined) Forecast, by Application 2020 & 2033
- Table 43: South Korea Reverse Logistics Industry in USA Revenue (undefined) Forecast, by Application 2020 & 2033
- Table 44: ASEAN Reverse Logistics Industry in USA Revenue (undefined) Forecast, by Application 2020 & 2033
- Table 45: Oceania Reverse Logistics Industry in USA Revenue (undefined) Forecast, by Application 2020 & 2033
- Table 46: Rest of Asia Pacific Reverse Logistics Industry in USA Revenue (undefined) Forecast, by Application 2020 & 2033
Frequently Asked Questions
1. What is the projected Compound Annual Growth Rate (CAGR) of the Reverse Logistics Industry in USA?
The projected CAGR is approximately 6.2%.
2. Which companies are prominent players in the Reverse Logistics Industry in USA?
Key companies in the market include DGD Transport, DHL, A2B Fulfillment, FedEx Corporation, Yusen Logistics, United Parcel Service (UPS), YRC Worldwide Inc, 7 COMPANY PROFILES, C H Robinson Worldwide Inc, XPO Logistics, Excelsior Integrated LLC, Happy Returns Inc, American Distribution Inc, FW Logistics, Newgistics Inc, United States Postal Service (USPS), Optoro.
3. What are the main segments of the Reverse Logistics Industry in USA?
The market segments include Function, End User.
4. Can you provide details about the market size?
The market size is estimated to be USD XXX N/A as of 2022.
5. What are some drivers contributing to market growth?
N/A
6. What are the notable trends driving market growth?
Growth in E-commerce and Technology Propels the Demand for Efficient Return Logistics.
7. Are there any restraints impacting market growth?
N/A
8. Can you provide examples of recent developments in the market?
N/A
9. What pricing options are available for accessing the report?
Pricing options include single-user, multi-user, and enterprise licenses priced at USD 3800, USD 4500, and USD 5800 respectively.
10. Is the market size provided in terms of value or volume?
The market size is provided in terms of value, measured in N/A.
11. Are there any specific market keywords associated with the report?
Yes, the market keyword associated with the report is "Reverse Logistics Industry in USA," which aids in identifying and referencing the specific market segment covered.
12. How do I determine which pricing option suits my needs best?
The pricing options vary based on user requirements and access needs. Individual users may opt for single-user licenses, while businesses requiring broader access may choose multi-user or enterprise licenses for cost-effective access to the report.
13. Are there any additional resources or data provided in the Reverse Logistics Industry in USA report?
While the report offers comprehensive insights, it's advisable to review the specific contents or supplementary materials provided to ascertain if additional resources or data are available.
14. How can I stay updated on further developments or reports in the Reverse Logistics Industry in USA?
To stay informed about further developments, trends, and reports in the Reverse Logistics Industry in USA, consider subscribing to industry newsletters, following relevant companies and organizations, or regularly checking reputable industry news sources and publications.
Methodology
Step 1 - Identification of Relevant Samples Size from Population Database


Step 2 - Approaches for Defining Global Market Size (Value, Volume* & Price*)

Note*: In applicable scenarios
Step 3 - Data Sources
Primary Research
- Web Analytics
- Survey Reports
- Research Institute
- Latest Research Reports
- Opinion Leaders
Secondary Research
- Annual Reports
- White Paper
- Latest Press Release
- Industry Association
- Paid Database
- Investor Presentations

Step 4 - Data Triangulation
Involves using different sources of information in order to increase the validity of a study
These sources are likely to be stakeholders in a program - participants, other researchers, program staff, other community members, and so on.
Then we put all data in single framework & apply various statistical tools to find out the dynamic on the market.
During the analysis stage, feedback from the stakeholder groups would be compared to determine areas of agreement as well as areas of divergence