

Key Insights
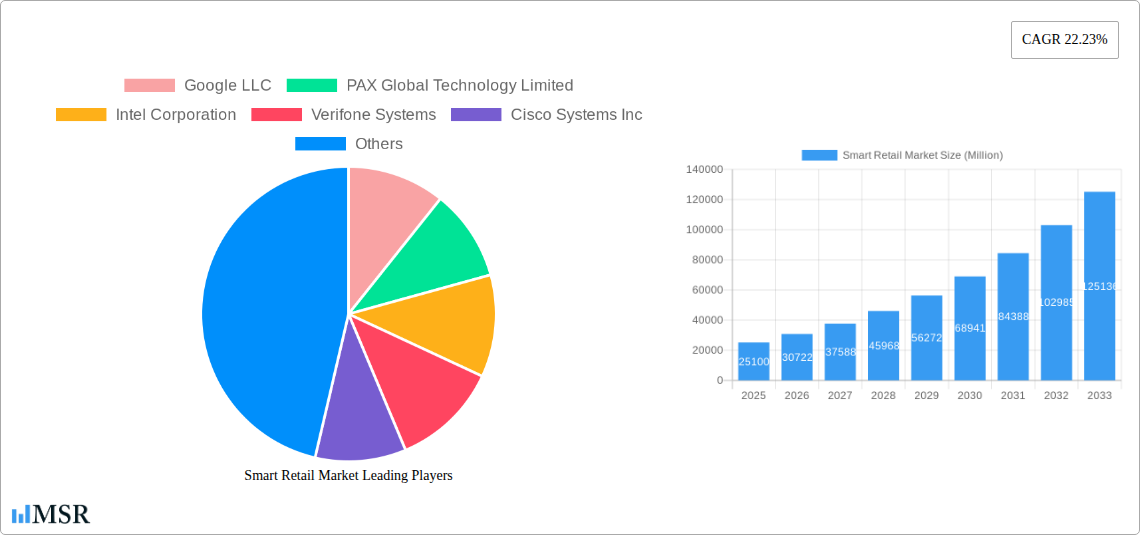
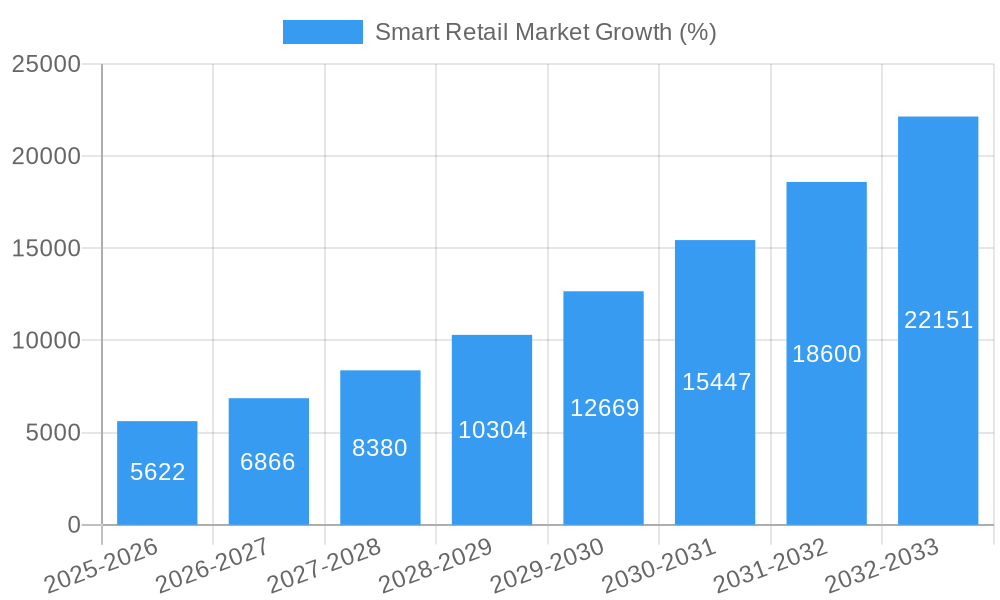
The global smart retail market, valued at $25.10 billion in 2025, is experiencing robust growth, projected to expand at a Compound Annual Growth Rate (CAGR) of 22.23% from 2025 to 2033. This significant expansion is driven by several key factors. The increasing adoption of technologies like Artificial Intelligence (AI), Internet of Things (IoT), and cloud computing is revolutionizing the retail landscape, enabling enhanced customer experiences, optimized inventory management, and streamlined operations. Consumers are increasingly demanding personalized shopping experiences and seamless omnichannel integration, further fueling market growth. Furthermore, the rise of e-commerce and the need for retailers to compete effectively in a digital marketplace are pushing the adoption of smart retail solutions. Companies are investing heavily in technologies such as smart shelves, digital signage, and advanced analytics to gain a competitive edge and improve operational efficiency. While data privacy concerns and the initial high implementation costs of smart retail solutions could pose some challenges, the long-term benefits in terms of increased revenue, improved customer satisfaction, and reduced operational expenses are expected to outweigh these limitations.
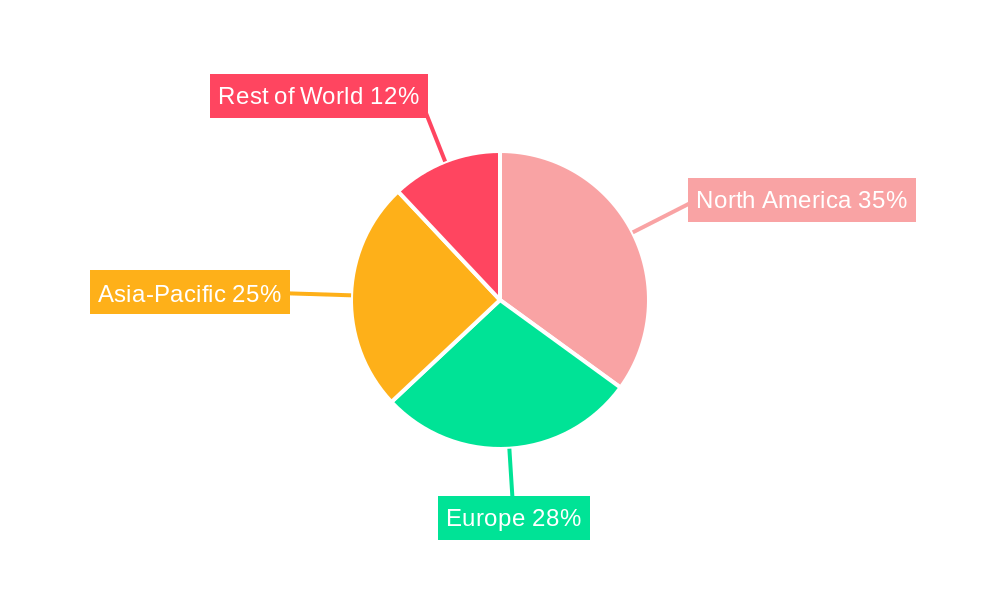
The market's competitive landscape is characterized by a mix of established technology giants and innovative startups. Key players like Google, Intel, Verifone, Cisco, Huawei, IBM, Fiserv, Microsoft, Honeywell, NVIDIA, Samsung, Amazon, NXP Semiconductors, and others are actively developing and deploying smart retail solutions. The market is segmented by technology (e.g., AI, IoT, cloud computing), application (e.g., inventory management, customer analytics, personalized marketing), and geography. The North American and European markets are currently leading the adoption of smart retail technologies, but significant growth potential exists in Asia-Pacific and other emerging markets as consumer spending power increases and digital infrastructure improves. Looking ahead, the focus will be on integrating advanced analytics and AI to provide highly personalized and predictive shopping experiences, leading to increased customer loyalty and profitability for retailers. The continued convergence of online and offline channels, driven by technologies like augmented reality and virtual reality, will further shape the evolution of the smart retail landscape.
Smart Retail Market: A Comprehensive Report (2019-2033)
This comprehensive report provides a detailed analysis of the Smart Retail Market, offering invaluable insights for industry stakeholders, investors, and strategic decision-makers. With a study period spanning 2019-2033, a base year of 2025, and a forecast period of 2025-2033, this report delivers a robust understanding of market dynamics, growth drivers, and future opportunities. The market is projected to reach xx Million by 2033, exhibiting a CAGR of xx% during the forecast period.
Smart Retail Market Concentration & Dynamics
The Smart Retail Market exhibits a moderately concentrated landscape, with key players like Google LLC, PAX Global Technology Limited, Intel Corporation, and Verifone Systems holding significant market share. However, the market is also characterized by a dynamic ecosystem of innovative startups and established technology providers. The market share of the top 5 players is estimated at xx%, indicating a competitive landscape with opportunities for both established players and new entrants.
Several factors contribute to market dynamics:
- Innovation Ecosystems: Rapid technological advancements in AI, IoT, and cloud computing fuel continuous innovation within the smart retail space.
- Regulatory Frameworks: Government regulations concerning data privacy and security significantly influence market growth and adoption.
- Substitute Products: Traditional retail methods present a competitive challenge, though the growing appeal of personalized and efficient shopping experiences favors smart retail solutions.
- End-User Trends: Rising consumer demand for convenient, personalized, and seamless shopping experiences is a primary driver.
- M&A Activities: The number of M&A deals in the smart retail sector has been steadily increasing in recent years, reaching approximately xx deals in 2024. This reflects the consolidation and strategic expansion within the industry.
Smart Retail Market Industry Insights & Trends
The global smart retail market is experiencing substantial growth, driven by several key factors. The market size was valued at xx Million in 2024 and is projected to reach xx Million by 2033. This growth is fueled by technological advancements like AI-powered checkout systems, improved data analytics for personalized marketing, and the increasing adoption of IoT devices for inventory management and customer engagement. Evolving consumer behavior, characterized by a preference for personalized shopping experiences and omnichannel strategies, further boosts market expansion. Disruptive technologies, like autonomous delivery robots and augmented reality shopping assistants, are transforming the retail landscape and creating new opportunities. The adoption of cloud-based solutions enables retailers to improve operational efficiency and reduce costs, further stimulating market growth.
Key Markets & Segments Leading Smart Retail Market
The North American region currently dominates the smart retail market, followed by Europe and Asia-Pacific. This dominance is attributed to:
- High Technological Adoption: Advanced technological infrastructure and a higher level of consumer acceptance of new technologies.
- Strong Economic Growth: Robust economies in these regions fuel investments in smart retail technologies.
- Developed Retail Infrastructure: Existing retail infrastructure provides a suitable foundation for integrating smart retail solutions.
Within specific countries, the United States leads in terms of market size and adoption rate due to high consumer spending power and significant investments in technological advancements. Further growth in this segment is expected from emerging markets in Asia, driven by increasing urbanization, rising disposable incomes, and improving digital infrastructure.
- Drivers in North America: High consumer spending, advanced technological infrastructure, early adoption of new technologies.
- Drivers in Europe: Growing digitalization, strong government support for technological advancements, rising demand for convenience and personalization.
- Drivers in Asia-Pacific: Rapid urbanization, increasing disposable incomes, expanding e-commerce sector.
Smart Retail Market Product Developments
Recent product innovations include AI-powered smart carts (like Caper Carts), self-checkout kiosks with improved user interfaces, and advanced inventory management systems using RFID technology. These advancements enhance the customer experience, streamline operations, and improve overall efficiency. The competitive edge lies in offering integrated solutions that seamlessly combine hardware and software, providing a comprehensive and user-friendly smart retail platform.
Challenges in the Smart Retail Market Market
The Smart Retail Market faces challenges including:
- High Initial Investment Costs: Implementation of smart retail technologies requires significant upfront investments.
- Data Security and Privacy Concerns: Protecting sensitive customer data is crucial and requires robust security measures.
- Integration Complexity: Integrating various technologies and systems can be complex and time-consuming.
- Lack of Skilled Workforce: A shortage of skilled professionals to operate and maintain smart retail systems presents a challenge. These factors combined limit market penetration by an estimated xx%.
Forces Driving Smart Retail Market Growth
Several factors drive Smart Retail Market growth:
- Technological Advancements: AI, IoT, and cloud computing are revolutionizing the retail experience.
- Evolving Consumer Preferences: Consumers increasingly demand personalized and convenient shopping experiences.
- Government Initiatives: Supportive government policies and regulations promote smart retail adoption. The expected increase in government investment for the next five years is xx Million.
Long-Term Growth Catalysts in Smart Retail Market
Long-term growth will be fueled by continued technological innovation, strategic partnerships between technology providers and retailers, and expansion into new and emerging markets. The development of more sophisticated AI-powered solutions, personalized shopping experiences via AR/VR, and the integration of blockchain technology for secure transactions will all contribute to sustained market growth.
Emerging Opportunities in Smart Retail Market
Emerging opportunities include the integration of smart retail solutions with augmented and virtual reality technologies, the rise of contactless payment systems, and the growth of the metaverse and its implications for virtual retail spaces. Expansion into smaller, more localized markets and the development of sustainable and environmentally friendly solutions offer additional growth prospects.
Leading Players in the Smart Retail Market Sector
- Google LLC
- PAX Global Technology Limited
- Intel Corporation
- Verifone Systems
- Cisco Systems Inc
- Huawei Technologies Co Ltd
- IBM Corporation
- Fiserv Inc
- Microsoft
- Honeywell International Inc
- NVIDIA Corporation
- Samsung Electronics
- Amazon com Inc
- NXP Semiconductors
- Caper Inc
- Ingenico Group
- Focal Systems Inc
- LG Display Co Ltd
- NCR Corporation
- *List Not Exhaustive
Key Milestones in Smart Retail Market Industry
- June 2024: Instacart partners with Price Chopper and McKeever's to introduce AI-powered Caper Carts in Missouri, enhancing the shopping experience and streamlining checkout. This signifies a major step toward frictionless grocery shopping.
- February 2024: Huawei launches its Smart Retail Solution, encompassing smart retail environments, intelligent warehousing, and digital marketing strategies. This comprehensive approach demonstrates the growing integration of technology across the retail value chain.
Strategic Outlook for Smart Retail Market Market
The Smart Retail Market presents significant growth potential in the coming years. Continued technological innovation, strategic partnerships, and expansion into new markets will drive future growth. Companies that can effectively integrate various technologies, deliver seamless customer experiences, and prioritize data security and privacy will be best positioned to succeed in this rapidly evolving market. The market's future is bright, offering opportunities for innovation, expansion, and significant returns on investment.
Smart Retail Market Segmentation
-
1. Component
- 1.1. Hardware
- 1.2. Software
- 1.3. Services
-
2. Application
- 2.1. Inventory Management
- 2.2. Brand Protection
- 2.3. Foot-Traffic Monitoring
- 2.4. Loyalty Management and Payment
- 2.5. Predictive Equipment Maintenance
- 2.6. Others
Smart Retail Market Segmentation By Geography
- 1. North America
- 2. Europe
- 3. Asia
- 4. Australia and New Zealand
- 5. Latin America
- 6. Middle East and Africa
Smart Retail Market REPORT HIGHLIGHTS
| Aspects | Details |
|---|---|
| Study Period | 2019-2033 |
| Base Year | 2024 |
| Estimated Year | 2025 |
| Forecast Period | 2025-2033 |
| Historical Period | 2019-2024 |
| Growth Rate | CAGR of 22.23% from 2019-2033 |
| Segmentation |
|
Table of Contents
- 1. Introduction
- 1.1. Research Scope
- 1.2. Market Segmentation
- 1.3. Research Methodology
- 1.4. Definitions and Assumptions
- 2. Executive Summary
- 2.1. Introduction
- 3. Market Dynamics
- 3.1. Introduction
- 3.2. Market Drivers
- 3.2.1. Growing Investments in Retail Chains and Retail Supermarkets; Rising Adoption of Advances in Technology Across Retail Chain
- 3.3. Market Restrains
- 3.3.1. Growing Investments in Retail Chains and Retail Supermarkets; Rising Adoption of Advances in Technology Across Retail Chain
- 3.4. Market Trends
- 3.4.1. Inventory Managment Segment is Expected to Hold Significant Market Share
- 4. Market Factor Analysis
- 4.1. Porters Five Forces
- 4.2. Supply/Value Chain
- 4.3. PESTEL analysis
- 4.4. Market Entropy
- 4.5. Patent/Trademark Analysis
- 5. Global Smart Retail Market Analysis, Insights and Forecast, 2019-2031
- 5.1. Market Analysis, Insights and Forecast - by Component
- 5.1.1. Hardware
- 5.1.2. Software
- 5.1.3. Services
- 5.2. Market Analysis, Insights and Forecast - by Application
- 5.2.1. Inventory Management
- 5.2.2. Brand Protection
- 5.2.3. Foot-Traffic Monitoring
- 5.2.4. Loyalty Management and Payment
- 5.2.5. Predictive Equipment Maintenance
- 5.2.6. Others
- 5.3. Market Analysis, Insights and Forecast - by Region
- 5.3.1. North America
- 5.3.2. Europe
- 5.3.3. Asia
- 5.3.4. Australia and New Zealand
- 5.3.5. Latin America
- 5.3.6. Middle East and Africa
- 5.1. Market Analysis, Insights and Forecast - by Component
- 6. North America Smart Retail Market Analysis, Insights and Forecast, 2019-2031
- 6.1. Market Analysis, Insights and Forecast - by Component
- 6.1.1. Hardware
- 6.1.2. Software
- 6.1.3. Services
- 6.2. Market Analysis, Insights and Forecast - by Application
- 6.2.1. Inventory Management
- 6.2.2. Brand Protection
- 6.2.3. Foot-Traffic Monitoring
- 6.2.4. Loyalty Management and Payment
- 6.2.5. Predictive Equipment Maintenance
- 6.2.6. Others
- 6.1. Market Analysis, Insights and Forecast - by Component
- 7. Europe Smart Retail Market Analysis, Insights and Forecast, 2019-2031
- 7.1. Market Analysis, Insights and Forecast - by Component
- 7.1.1. Hardware
- 7.1.2. Software
- 7.1.3. Services
- 7.2. Market Analysis, Insights and Forecast - by Application
- 7.2.1. Inventory Management
- 7.2.2. Brand Protection
- 7.2.3. Foot-Traffic Monitoring
- 7.2.4. Loyalty Management and Payment
- 7.2.5. Predictive Equipment Maintenance
- 7.2.6. Others
- 7.1. Market Analysis, Insights and Forecast - by Component
- 8. Asia Smart Retail Market Analysis, Insights and Forecast, 2019-2031
- 8.1. Market Analysis, Insights and Forecast - by Component
- 8.1.1. Hardware
- 8.1.2. Software
- 8.1.3. Services
- 8.2. Market Analysis, Insights and Forecast - by Application
- 8.2.1. Inventory Management
- 8.2.2. Brand Protection
- 8.2.3. Foot-Traffic Monitoring
- 8.2.4. Loyalty Management and Payment
- 8.2.5. Predictive Equipment Maintenance
- 8.2.6. Others
- 8.1. Market Analysis, Insights and Forecast - by Component
- 9. Australia and New Zealand Smart Retail Market Analysis, Insights and Forecast, 2019-2031
- 9.1. Market Analysis, Insights and Forecast - by Component
- 9.1.1. Hardware
- 9.1.2. Software
- 9.1.3. Services
- 9.2. Market Analysis, Insights and Forecast - by Application
- 9.2.1. Inventory Management
- 9.2.2. Brand Protection
- 9.2.3. Foot-Traffic Monitoring
- 9.2.4. Loyalty Management and Payment
- 9.2.5. Predictive Equipment Maintenance
- 9.2.6. Others
- 9.1. Market Analysis, Insights and Forecast - by Component
- 10. Latin America Smart Retail Market Analysis, Insights and Forecast, 2019-2031
- 10.1. Market Analysis, Insights and Forecast - by Component
- 10.1.1. Hardware
- 10.1.2. Software
- 10.1.3. Services
- 10.2. Market Analysis, Insights and Forecast - by Application
- 10.2.1. Inventory Management
- 10.2.2. Brand Protection
- 10.2.3. Foot-Traffic Monitoring
- 10.2.4. Loyalty Management and Payment
- 10.2.5. Predictive Equipment Maintenance
- 10.2.6. Others
- 10.1. Market Analysis, Insights and Forecast - by Component
- 11. Middle East and Africa Smart Retail Market Analysis, Insights and Forecast, 2019-2031
- 11.1. Market Analysis, Insights and Forecast - by Component
- 11.1.1. Hardware
- 11.1.2. Software
- 11.1.3. Services
- 11.2. Market Analysis, Insights and Forecast - by Application
- 11.2.1. Inventory Management
- 11.2.2. Brand Protection
- 11.2.3. Foot-Traffic Monitoring
- 11.2.4. Loyalty Management and Payment
- 11.2.5. Predictive Equipment Maintenance
- 11.2.6. Others
- 11.1. Market Analysis, Insights and Forecast - by Component
- 12. Competitive Analysis
- 12.1. Global Market Share Analysis 2024
- 12.2. Company Profiles
- 12.2.1 Google LLC
- 12.2.1.1. Overview
- 12.2.1.2. Products
- 12.2.1.3. SWOT Analysis
- 12.2.1.4. Recent Developments
- 12.2.1.5. Financials (Based on Availability)
- 12.2.2 PAX Global Technology Limited
- 12.2.2.1. Overview
- 12.2.2.2. Products
- 12.2.2.3. SWOT Analysis
- 12.2.2.4. Recent Developments
- 12.2.2.5. Financials (Based on Availability)
- 12.2.3 Intel Corporation
- 12.2.3.1. Overview
- 12.2.3.2. Products
- 12.2.3.3. SWOT Analysis
- 12.2.3.4. Recent Developments
- 12.2.3.5. Financials (Based on Availability)
- 12.2.4 Verifone Systems
- 12.2.4.1. Overview
- 12.2.4.2. Products
- 12.2.4.3. SWOT Analysis
- 12.2.4.4. Recent Developments
- 12.2.4.5. Financials (Based on Availability)
- 12.2.5 Cisco Systems Inc
- 12.2.5.1. Overview
- 12.2.5.2. Products
- 12.2.5.3. SWOT Analysis
- 12.2.5.4. Recent Developments
- 12.2.5.5. Financials (Based on Availability)
- 12.2.6 Huawei Technologies Co Ltd
- 12.2.6.1. Overview
- 12.2.6.2. Products
- 12.2.6.3. SWOT Analysis
- 12.2.6.4. Recent Developments
- 12.2.6.5. Financials (Based on Availability)
- 12.2.7 IBM Corporation
- 12.2.7.1. Overview
- 12.2.7.2. Products
- 12.2.7.3. SWOT Analysis
- 12.2.7.4. Recent Developments
- 12.2.7.5. Financials (Based on Availability)
- 12.2.8 Fiserv Inc
- 12.2.8.1. Overview
- 12.2.8.2. Products
- 12.2.8.3. SWOT Analysis
- 12.2.8.4. Recent Developments
- 12.2.8.5. Financials (Based on Availability)
- 12.2.9 Microsoft
- 12.2.9.1. Overview
- 12.2.9.2. Products
- 12.2.9.3. SWOT Analysis
- 12.2.9.4. Recent Developments
- 12.2.9.5. Financials (Based on Availability)
- 12.2.10 Honeywell International Inc
- 12.2.10.1. Overview
- 12.2.10.2. Products
- 12.2.10.3. SWOT Analysis
- 12.2.10.4. Recent Developments
- 12.2.10.5. Financials (Based on Availability)
- 12.2.11 NVIDIA Corporation
- 12.2.11.1. Overview
- 12.2.11.2. Products
- 12.2.11.3. SWOT Analysis
- 12.2.11.4. Recent Developments
- 12.2.11.5. Financials (Based on Availability)
- 12.2.12 Samsung Electronics
- 12.2.12.1. Overview
- 12.2.12.2. Products
- 12.2.12.3. SWOT Analysis
- 12.2.12.4. Recent Developments
- 12.2.12.5. Financials (Based on Availability)
- 12.2.13 Amazon com Inc
- 12.2.13.1. Overview
- 12.2.13.2. Products
- 12.2.13.3. SWOT Analysis
- 12.2.13.4. Recent Developments
- 12.2.13.5. Financials (Based on Availability)
- 12.2.14 NXP Semiconductors
- 12.2.14.1. Overview
- 12.2.14.2. Products
- 12.2.14.3. SWOT Analysis
- 12.2.14.4. Recent Developments
- 12.2.14.5. Financials (Based on Availability)
- 12.2.15 Caper Inc
- 12.2.15.1. Overview
- 12.2.15.2. Products
- 12.2.15.3. SWOT Analysis
- 12.2.15.4. Recent Developments
- 12.2.15.5. Financials (Based on Availability)
- 12.2.16 Ingenico Group
- 12.2.16.1. Overview
- 12.2.16.2. Products
- 12.2.16.3. SWOT Analysis
- 12.2.16.4. Recent Developments
- 12.2.16.5. Financials (Based on Availability)
- 12.2.17 Focal Systems Inc
- 12.2.17.1. Overview
- 12.2.17.2. Products
- 12.2.17.3. SWOT Analysis
- 12.2.17.4. Recent Developments
- 12.2.17.5. Financials (Based on Availability)
- 12.2.18 LG Display Co Ltd
- 12.2.18.1. Overview
- 12.2.18.2. Products
- 12.2.18.3. SWOT Analysis
- 12.2.18.4. Recent Developments
- 12.2.18.5. Financials (Based on Availability)
- 12.2.19 NCR Corporation*List Not Exhaustive
- 12.2.19.1. Overview
- 12.2.19.2. Products
- 12.2.19.3. SWOT Analysis
- 12.2.19.4. Recent Developments
- 12.2.19.5. Financials (Based on Availability)
- 12.2.1 Google LLC
List of Figures
- Figure 1: Global Smart Retail Market Revenue Breakdown (Million, %) by Region 2024 & 2032
- Figure 2: Global Smart Retail Market Volume Breakdown (Billion, %) by Region 2024 & 2032
- Figure 3: North America Smart Retail Market Revenue (Million), by Component 2024 & 2032
- Figure 4: North America Smart Retail Market Volume (Billion), by Component 2024 & 2032
- Figure 5: North America Smart Retail Market Revenue Share (%), by Component 2024 & 2032
- Figure 6: North America Smart Retail Market Volume Share (%), by Component 2024 & 2032
- Figure 7: North America Smart Retail Market Revenue (Million), by Application 2024 & 2032
- Figure 8: North America Smart Retail Market Volume (Billion), by Application 2024 & 2032
- Figure 9: North America Smart Retail Market Revenue Share (%), by Application 2024 & 2032
- Figure 10: North America Smart Retail Market Volume Share (%), by Application 2024 & 2032
- Figure 11: North America Smart Retail Market Revenue (Million), by Country 2024 & 2032
- Figure 12: North America Smart Retail Market Volume (Billion), by Country 2024 & 2032
- Figure 13: North America Smart Retail Market Revenue Share (%), by Country 2024 & 2032
- Figure 14: North America Smart Retail Market Volume Share (%), by Country 2024 & 2032
- Figure 15: Europe Smart Retail Market Revenue (Million), by Component 2024 & 2032
- Figure 16: Europe Smart Retail Market Volume (Billion), by Component 2024 & 2032
- Figure 17: Europe Smart Retail Market Revenue Share (%), by Component 2024 & 2032
- Figure 18: Europe Smart Retail Market Volume Share (%), by Component 2024 & 2032
- Figure 19: Europe Smart Retail Market Revenue (Million), by Application 2024 & 2032
- Figure 20: Europe Smart Retail Market Volume (Billion), by Application 2024 & 2032
- Figure 21: Europe Smart Retail Market Revenue Share (%), by Application 2024 & 2032
- Figure 22: Europe Smart Retail Market Volume Share (%), by Application 2024 & 2032
- Figure 23: Europe Smart Retail Market Revenue (Million), by Country 2024 & 2032
- Figure 24: Europe Smart Retail Market Volume (Billion), by Country 2024 & 2032
- Figure 25: Europe Smart Retail Market Revenue Share (%), by Country 2024 & 2032
- Figure 26: Europe Smart Retail Market Volume Share (%), by Country 2024 & 2032
- Figure 27: Asia Smart Retail Market Revenue (Million), by Component 2024 & 2032
- Figure 28: Asia Smart Retail Market Volume (Billion), by Component 2024 & 2032
- Figure 29: Asia Smart Retail Market Revenue Share (%), by Component 2024 & 2032
- Figure 30: Asia Smart Retail Market Volume Share (%), by Component 2024 & 2032
- Figure 31: Asia Smart Retail Market Revenue (Million), by Application 2024 & 2032
- Figure 32: Asia Smart Retail Market Volume (Billion), by Application 2024 & 2032
- Figure 33: Asia Smart Retail Market Revenue Share (%), by Application 2024 & 2032
- Figure 34: Asia Smart Retail Market Volume Share (%), by Application 2024 & 2032
- Figure 35: Asia Smart Retail Market Revenue (Million), by Country 2024 & 2032
- Figure 36: Asia Smart Retail Market Volume (Billion), by Country 2024 & 2032
- Figure 37: Asia Smart Retail Market Revenue Share (%), by Country 2024 & 2032
- Figure 38: Asia Smart Retail Market Volume Share (%), by Country 2024 & 2032
- Figure 39: Australia and New Zealand Smart Retail Market Revenue (Million), by Component 2024 & 2032
- Figure 40: Australia and New Zealand Smart Retail Market Volume (Billion), by Component 2024 & 2032
- Figure 41: Australia and New Zealand Smart Retail Market Revenue Share (%), by Component 2024 & 2032
- Figure 42: Australia and New Zealand Smart Retail Market Volume Share (%), by Component 2024 & 2032
- Figure 43: Australia and New Zealand Smart Retail Market Revenue (Million), by Application 2024 & 2032
- Figure 44: Australia and New Zealand Smart Retail Market Volume (Billion), by Application 2024 & 2032
- Figure 45: Australia and New Zealand Smart Retail Market Revenue Share (%), by Application 2024 & 2032
- Figure 46: Australia and New Zealand Smart Retail Market Volume Share (%), by Application 2024 & 2032
- Figure 47: Australia and New Zealand Smart Retail Market Revenue (Million), by Country 2024 & 2032
- Figure 48: Australia and New Zealand Smart Retail Market Volume (Billion), by Country 2024 & 2032
- Figure 49: Australia and New Zealand Smart Retail Market Revenue Share (%), by Country 2024 & 2032
- Figure 50: Australia and New Zealand Smart Retail Market Volume Share (%), by Country 2024 & 2032
- Figure 51: Latin America Smart Retail Market Revenue (Million), by Component 2024 & 2032
- Figure 52: Latin America Smart Retail Market Volume (Billion), by Component 2024 & 2032
- Figure 53: Latin America Smart Retail Market Revenue Share (%), by Component 2024 & 2032
- Figure 54: Latin America Smart Retail Market Volume Share (%), by Component 2024 & 2032
- Figure 55: Latin America Smart Retail Market Revenue (Million), by Application 2024 & 2032
- Figure 56: Latin America Smart Retail Market Volume (Billion), by Application 2024 & 2032
- Figure 57: Latin America Smart Retail Market Revenue Share (%), by Application 2024 & 2032
- Figure 58: Latin America Smart Retail Market Volume Share (%), by Application 2024 & 2032
- Figure 59: Latin America Smart Retail Market Revenue (Million), by Country 2024 & 2032
- Figure 60: Latin America Smart Retail Market Volume (Billion), by Country 2024 & 2032
- Figure 61: Latin America Smart Retail Market Revenue Share (%), by Country 2024 & 2032
- Figure 62: Latin America Smart Retail Market Volume Share (%), by Country 2024 & 2032
- Figure 63: Middle East and Africa Smart Retail Market Revenue (Million), by Component 2024 & 2032
- Figure 64: Middle East and Africa Smart Retail Market Volume (Billion), by Component 2024 & 2032
- Figure 65: Middle East and Africa Smart Retail Market Revenue Share (%), by Component 2024 & 2032
- Figure 66: Middle East and Africa Smart Retail Market Volume Share (%), by Component 2024 & 2032
- Figure 67: Middle East and Africa Smart Retail Market Revenue (Million), by Application 2024 & 2032
- Figure 68: Middle East and Africa Smart Retail Market Volume (Billion), by Application 2024 & 2032
- Figure 69: Middle East and Africa Smart Retail Market Revenue Share (%), by Application 2024 & 2032
- Figure 70: Middle East and Africa Smart Retail Market Volume Share (%), by Application 2024 & 2032
- Figure 71: Middle East and Africa Smart Retail Market Revenue (Million), by Country 2024 & 2032
- Figure 72: Middle East and Africa Smart Retail Market Volume (Billion), by Country 2024 & 2032
- Figure 73: Middle East and Africa Smart Retail Market Revenue Share (%), by Country 2024 & 2032
- Figure 74: Middle East and Africa Smart Retail Market Volume Share (%), by Country 2024 & 2032
List of Tables
- Table 1: Global Smart Retail Market Revenue Million Forecast, by Region 2019 & 2032
- Table 2: Global Smart Retail Market Volume Billion Forecast, by Region 2019 & 2032
- Table 3: Global Smart Retail Market Revenue Million Forecast, by Component 2019 & 2032
- Table 4: Global Smart Retail Market Volume Billion Forecast, by Component 2019 & 2032
- Table 5: Global Smart Retail Market Revenue Million Forecast, by Application 2019 & 2032
- Table 6: Global Smart Retail Market Volume Billion Forecast, by Application 2019 & 2032
- Table 7: Global Smart Retail Market Revenue Million Forecast, by Region 2019 & 2032
- Table 8: Global Smart Retail Market Volume Billion Forecast, by Region 2019 & 2032
- Table 9: Global Smart Retail Market Revenue Million Forecast, by Component 2019 & 2032
- Table 10: Global Smart Retail Market Volume Billion Forecast, by Component 2019 & 2032
- Table 11: Global Smart Retail Market Revenue Million Forecast, by Application 2019 & 2032
- Table 12: Global Smart Retail Market Volume Billion Forecast, by Application 2019 & 2032
- Table 13: Global Smart Retail Market Revenue Million Forecast, by Country 2019 & 2032
- Table 14: Global Smart Retail Market Volume Billion Forecast, by Country 2019 & 2032
- Table 15: Global Smart Retail Market Revenue Million Forecast, by Component 2019 & 2032
- Table 16: Global Smart Retail Market Volume Billion Forecast, by Component 2019 & 2032
- Table 17: Global Smart Retail Market Revenue Million Forecast, by Application 2019 & 2032
- Table 18: Global Smart Retail Market Volume Billion Forecast, by Application 2019 & 2032
- Table 19: Global Smart Retail Market Revenue Million Forecast, by Country 2019 & 2032
- Table 20: Global Smart Retail Market Volume Billion Forecast, by Country 2019 & 2032
- Table 21: Global Smart Retail Market Revenue Million Forecast, by Component 2019 & 2032
- Table 22: Global Smart Retail Market Volume Billion Forecast, by Component 2019 & 2032
- Table 23: Global Smart Retail Market Revenue Million Forecast, by Application 2019 & 2032
- Table 24: Global Smart Retail Market Volume Billion Forecast, by Application 2019 & 2032
- Table 25: Global Smart Retail Market Revenue Million Forecast, by Country 2019 & 2032
- Table 26: Global Smart Retail Market Volume Billion Forecast, by Country 2019 & 2032
- Table 27: Global Smart Retail Market Revenue Million Forecast, by Component 2019 & 2032
- Table 28: Global Smart Retail Market Volume Billion Forecast, by Component 2019 & 2032
- Table 29: Global Smart Retail Market Revenue Million Forecast, by Application 2019 & 2032
- Table 30: Global Smart Retail Market Volume Billion Forecast, by Application 2019 & 2032
- Table 31: Global Smart Retail Market Revenue Million Forecast, by Country 2019 & 2032
- Table 32: Global Smart Retail Market Volume Billion Forecast, by Country 2019 & 2032
- Table 33: Global Smart Retail Market Revenue Million Forecast, by Component 2019 & 2032
- Table 34: Global Smart Retail Market Volume Billion Forecast, by Component 2019 & 2032
- Table 35: Global Smart Retail Market Revenue Million Forecast, by Application 2019 & 2032
- Table 36: Global Smart Retail Market Volume Billion Forecast, by Application 2019 & 2032
- Table 37: Global Smart Retail Market Revenue Million Forecast, by Country 2019 & 2032
- Table 38: Global Smart Retail Market Volume Billion Forecast, by Country 2019 & 2032
- Table 39: Global Smart Retail Market Revenue Million Forecast, by Component 2019 & 2032
- Table 40: Global Smart Retail Market Volume Billion Forecast, by Component 2019 & 2032
- Table 41: Global Smart Retail Market Revenue Million Forecast, by Application 2019 & 2032
- Table 42: Global Smart Retail Market Volume Billion Forecast, by Application 2019 & 2032
- Table 43: Global Smart Retail Market Revenue Million Forecast, by Country 2019 & 2032
- Table 44: Global Smart Retail Market Volume Billion Forecast, by Country 2019 & 2032
Frequently Asked Questions
1. What is the projected Compound Annual Growth Rate (CAGR) of the Smart Retail Market?
The projected CAGR is approximately 22.23%.
2. Which companies are prominent players in the Smart Retail Market?
Key companies in the market include Google LLC, PAX Global Technology Limited, Intel Corporation, Verifone Systems, Cisco Systems Inc, Huawei Technologies Co Ltd, IBM Corporation, Fiserv Inc, Microsoft, Honeywell International Inc, NVIDIA Corporation, Samsung Electronics, Amazon com Inc, NXP Semiconductors, Caper Inc, Ingenico Group, Focal Systems Inc, LG Display Co Ltd, NCR Corporation*List Not Exhaustive.
3. What are the main segments of the Smart Retail Market?
The market segments include Component, Application.
4. Can you provide details about the market size?
The market size is estimated to be USD 25.10 Million as of 2022.
5. What are some drivers contributing to market growth?
Growing Investments in Retail Chains and Retail Supermarkets; Rising Adoption of Advances in Technology Across Retail Chain.
6. What are the notable trends driving market growth?
Inventory Managment Segment is Expected to Hold Significant Market Share.
7. Are there any restraints impacting market growth?
Growing Investments in Retail Chains and Retail Supermarkets; Rising Adoption of Advances in Technology Across Retail Chain.
8. Can you provide examples of recent developments in the market?
June 2024: Instacart, in collaboration with Price Chopper and McKeever's Market & Eatery, announced the introduction of Caper Carts, which are powered by artificial intelligence, at select locations in Missouri. These innovative smart carts enhance the shopping experience by enabling customers to scan items while they shop easily, monitor their grocery budget in real time, and bypass the checkout line altogether.
9. What pricing options are available for accessing the report?
Pricing options include single-user, multi-user, and enterprise licenses priced at USD 4750, USD 5250, and USD 8750 respectively.
10. Is the market size provided in terms of value or volume?
The market size is provided in terms of value, measured in Million and volume, measured in Billion.
11. Are there any specific market keywords associated with the report?
Yes, the market keyword associated with the report is "Smart Retail Market," which aids in identifying and referencing the specific market segment covered.
12. How do I determine which pricing option suits my needs best?
The pricing options vary based on user requirements and access needs. Individual users may opt for single-user licenses, while businesses requiring broader access may choose multi-user or enterprise licenses for cost-effective access to the report.
13. Are there any additional resources or data provided in the Smart Retail Market report?
While the report offers comprehensive insights, it's advisable to review the specific contents or supplementary materials provided to ascertain if additional resources or data are available.
14. How can I stay updated on further developments or reports in the Smart Retail Market?
To stay informed about further developments, trends, and reports in the Smart Retail Market, consider subscribing to industry newsletters, following relevant companies and organizations, or regularly checking reputable industry news sources and publications.
Methodology
Step 1 - Identification of Relevant Samples Size from Population Database


Step 2 - Approaches for Defining Global Market Size (Value, Volume* & Price*)

Note*: In applicable scenarios
Step 3 - Data Sources
Primary Research
- Web Analytics
- Survey Reports
- Research Institute
- Latest Research Reports
- Opinion Leaders
Secondary Research
- Annual Reports
- White Paper
- Latest Press Release
- Industry Association
- Paid Database
- Investor Presentations

Step 4 - Data Triangulation
Involves using different sources of information in order to increase the validity of a study
These sources are likely to be stakeholders in a program - participants, other researchers, program staff, other community members, and so on.
Then we put all data in single framework & apply various statistical tools to find out the dynamic on the market.
During the analysis stage, feedback from the stakeholder groups would be compared to determine areas of agreement as well as areas of divergence
