

Key Insights
The UK energy drink market is projected to reach $2.2 billion by 2025, with an anticipated compound annual growth rate (CAGR) of 5.67% from 2025 to 2033. This growth is propelled by several key drivers. The increasing demand for convenient energy solutions, driven by busy lifestyles and demanding work schedules, is a primary factor. Additionally, the market is witnessing a rise in functional energy drinks fortified with vitamins, antioxidants, and natural ingredients, appealing to health-conscious consumers. Innovative marketing initiatives, including targeted social media campaigns and influencer collaborations, are also significantly contributing to market penetration.
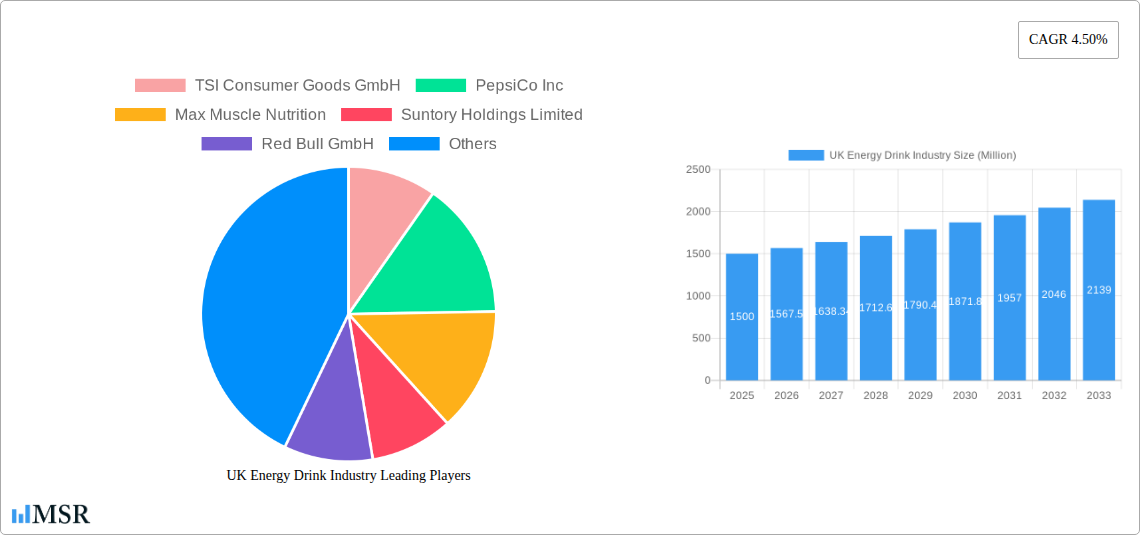
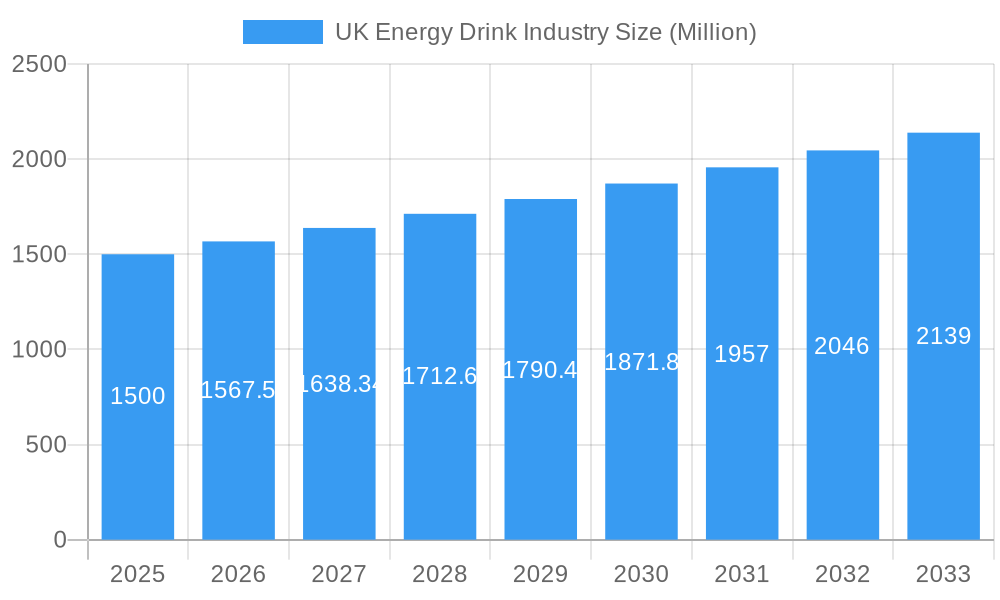
UK Energy Drink Industry Market Size (In Billion)
The market is segmented by packaging (cans and PET bottles), product type (drinks, shots, and mixers), and distribution channels (supermarkets, convenience stores, specialist stores, and online retail). While established brands like Red Bull, Coca-Cola, and PepsiCo maintain a strong presence, they face increasing competition from niche brands targeting specific consumer segments with unique product offerings. However, regulatory scrutiny regarding sugar content and potential health implications, alongside intensifying competition, poses challenges to sustained market growth.
UK Energy Drink Industry Company Market Share
Despite the positive outlook, potential restraints include consumer health concerns related to high sugar and caffeine levels, which could lead to regulatory changes and a consumer shift towards healthier alternatives. Economic fluctuations may also impact discretionary spending on energy drinks. Nevertheless, continuous industry innovation, focusing on healthier formulations and diverse product portfolios, is expected to mitigate these challenges. The expanding online retail sector presents a significant opportunity for enhanced accessibility and broader market reach.
UK Energy Drink Industry Market Report: 2019-2033
This comprehensive report provides an in-depth analysis of the UK energy drink industry, encompassing market size, key segments, leading players, and future growth prospects. With a study period spanning 2019-2033 (base year 2025, forecast period 2025-2033), this report is an essential resource for industry stakeholders, investors, and market researchers seeking actionable insights into this dynamic sector. The UK energy drink market, valued at £xx Million in 2025, is projected to experience significant growth, driven by evolving consumer preferences and technological advancements.
UK Energy Drink Industry Market Concentration & Dynamics
The UK energy drink market exhibits a moderately concentrated structure, dominated by global giants like PepsiCo Inc, The Coca-Cola Company, Red Bull GmbH, and Monster Energy Company. These players control a significant market share, exceeding xx%, leaving smaller players to compete for the remaining market. However, the emergence of innovative brands offering healthier and more sustainable options is challenging the established order.
- Market Share: Top 5 players hold xx% market share in 2025.
- M&A Activity: The period 2019-2024 witnessed xx M&A deals, primarily focused on expanding product portfolios and distribution networks.
- Innovation Ecosystem: The UK boasts a thriving innovation ecosystem with several startups focused on plant-based, low-sugar, and functional energy drinks.
- Regulatory Framework: The UK's regulatory framework for food and beverage products, including labelling and sugar content, plays a significant role in shaping market dynamics.
- Substitute Products: The market faces competition from other functional beverages such as sports drinks and coffee, which also cater to the need for energy boosts.
- End-User Trends: Growing health consciousness is driving demand for low-sugar and natural energy drinks.
UK Energy Drink Industry Industry Insights & Trends
The UK energy drink market has demonstrated robust growth over the historical period (2019-2024), registering a Compound Annual Growth Rate (CAGR) of xx%. This positive trend is expected to continue throughout the forecast period (2025-2033), with projected growth driven by several factors. Rising disposable incomes, coupled with a young and active population, fuels demand for convenient energy boosts. The increasing prevalence of busy lifestyles and long working hours also contributes to high consumption rates. Technological advancements have led to innovative product formulations, such as plant-based energy drinks and functional beverages incorporating vitamins and other beneficial ingredients. Furthermore, evolving consumer preferences towards healthier and more sustainable options are shaping product development and marketing strategies. The market size is estimated at £xx Million in 2025 and is projected to reach £xx Million by 2033.
Key Markets & Segments Leading UK Energy Drink Industry
The UK energy drink market shows strong segmentation across packaging, product type, and distribution channels.
- By Packaging Type: Cans maintain dominance due to their convenient format and established consumer preference, capturing the largest market share (xx%). However, PET bottles are gaining traction.
- By Product Type: Ready-to-drink energy drinks account for the majority of the market share (xx%), followed by shots and mixers.
- By Distribution Channel: Supermarkets/hypermarkets represent the primary distribution channel, accounting for xx% of total sales, followed by convenience stores and specialist stores. Online retail is a growing segment, expected to show significant growth in the coming years.
Drivers:
- Economic Growth: Increased disposable income supports higher spending on discretionary items such as energy drinks.
- Infrastructure: Well-established retail infrastructure provides widespread accessibility to energy drinks across various locations.
- Consumer Preferences: Demand for healthier options like plant-based and low-sugar drinks fuels specific segment growth.
UK Energy Drink Industry Product Developments
Recent years have seen significant product innovation in the UK energy drink market. Several brands have introduced plant-based, low-sugar, and functional energy drinks, responding to growing consumer demand for healthier options. The launch of products like Virtue Clean Energy (September 2022) and PerfectTed's matcha green tea drinks (March 2022) showcases this trend towards natural ingredients and clean labels. These advancements are providing consumers with more choices and contributing to market diversification.
Challenges in the UK Energy Drink Industry Market
The UK energy drink market faces challenges including increasing regulatory scrutiny on sugar content, potential supply chain disruptions, and intense competition from established players and new entrants. These factors can negatively impact profitability and market share for certain brands. The rising cost of raw materials is also a concern for manufacturers.
Forces Driving UK Energy Drink Industry Growth
Several factors contribute to the UK energy drink market's growth. Technological innovation resulting in healthier product formulations, rising consumer disposable incomes, and the increasing adoption of e-commerce channels for distribution all contribute to a positive outlook. Changes in lifestyles and working patterns leading to increased demand for convenient energy boosts also represent a strong growth driver.
Challenges in the UK Energy Drink Industry Market
Long-term growth hinges on the continued development of innovative, healthier energy drink options. This includes partnerships with health-focused businesses, leveraging sustainable sourcing of ingredients, and expanding distribution networks to reach new consumer segments.
Emerging Opportunities in UK Energy Drink Industry
Growing consumer interest in functional beverages with added health benefits offers significant opportunities. This includes exploring new ingredients like adaptogens, nootropics, and unique flavour profiles. Furthermore, expansion into niche markets such as athletic performance, and the development of tailored products for various demographics (e.g., senior citizens) can unlock substantial growth potential.
Leading Players in the UK Energy Drink Industry Sector
- TSI Consumer Goods GmbH
- PepsiCo Inc
- Max Muscle Nutrition
- Suntory Holdings Limited
- Red Bull GmbH
- The Coca-Cola Company
- Nestle SA
- Global Trade Holdings Co Ltd
- Monster Energy Company
- GlaxoSmithKline PLC
Key Milestones in UK Energy Drink Industry Industry
- September 2022: Launch of Virtue Clean Energy, a zero-sugar, zero-calorie energy drink, signifying a shift towards healthier options.
- June 2022: Tenzing launches plant-based energy shots, capitalizing on the growing demand for natural and plant-based products.
- March 2022: PerfectTed introduces a range of canned matcha green tea energy drinks, further diversifying the market with natural and healthy alternatives.
Strategic Outlook for UK Energy Drink Industry Market
The UK energy drink market is poised for continued growth, driven by innovation, evolving consumer preferences, and the emergence of healthier alternatives. Strategic opportunities lie in product diversification, tapping into niche markets, and embracing sustainable practices. Companies that can effectively navigate the evolving regulatory landscape and adapt to changing consumer needs will be well-positioned for success.
UK Energy Drink Industry Segmentation
-
1. Packaging Type
- 1.1. Can
- 1.2. PET Bottle
-
2. Product Type
- 2.1. Drinks
- 2.2. Shots
- 2.3. Mixers
-
3. Distribution Channel
- 3.1. Supermarkets/Hypermarkets
- 3.2. Convenience Stores
- 3.3. Specalist Stores
- 3.4. Online Retail Stores
- 3.5. Other Distribution Channels
UK Energy Drink Industry Segmentation By Geography
-
1. North America
- 1.1. United States
- 1.2. Canada
- 1.3. Mexico
-
2. South America
- 2.1. Brazil
- 2.2. Argentina
- 2.3. Rest of South America
-
3. Europe
- 3.1. United Kingdom
- 3.2. Germany
- 3.3. France
- 3.4. Italy
- 3.5. Spain
- 3.6. Russia
- 3.7. Benelux
- 3.8. Nordics
- 3.9. Rest of Europe
-
4. Middle East & Africa
- 4.1. Turkey
- 4.2. Israel
- 4.3. GCC
- 4.4. North Africa
- 4.5. South Africa
- 4.6. Rest of Middle East & Africa
-
5. Asia Pacific
- 5.1. China
- 5.2. India
- 5.3. Japan
- 5.4. South Korea
- 5.5. ASEAN
- 5.6. Oceania
- 5.7. Rest of Asia Pacific
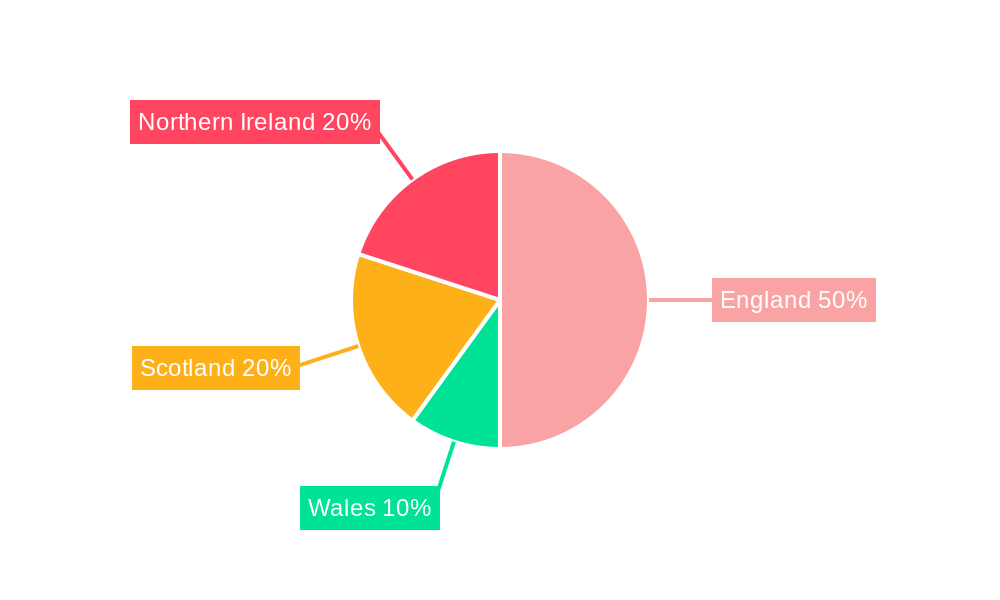
UK Energy Drink Industry Regional Market Share
Geographic Coverage of UK Energy Drink Industry
UK Energy Drink Industry REPORT HIGHLIGHTS
| Aspects | Details |
|---|---|
| Study Period | 2020-2034 |
| Base Year | 2025 |
| Estimated Year | 2026 |
| Forecast Period | 2026-2034 |
| Historical Period | 2020-2025 |
| Growth Rate | CAGR of 5.67% from 2020-2034 |
| Segmentation |
|
Table of Contents
- 1. Introduction
- 1.1. Research Scope
- 1.2. Market Segmentation
- 1.3. Research Objective
- 1.4. Definitions and Assumptions
- 2. Executive Summary
- 2.1. Market Snapshot
- 3. Market Dynamics
- 3.1. Market Drivers
- 3.2. Market Restrains
- 3.3. Market Trends
- 3.4. Market Opportunities
- 4. Market Factor Analysis
- 4.1. Porters Five Forces
- 4.1.1. Bargaining Power of Suppliers
- 4.1.2. Bargaining Power of Buyers
- 4.1.3. Threat of New Entrants
- 4.1.4. Threat of Substitutes
- 4.1.5. Competitive Rivalry
- 4.2. PESTEL analysis
- 4.3. BCG Analysis
- 4.3.1. Stars (High Growth, High Market Share)
- 4.3.2. Cash Cows (Low Growth, High Market Share)
- 4.3.3. Question Mark (High Growth, Low Market Share)
- 4.3.4. Dogs (Low Growth, Low Market Share)
- 4.4. Ansoff Matrix Analysis
- 4.5. Supply Chain Analysis
- 4.6. Regulatory Landscape
- 4.7. Current Market Potential and Opportunity Assessment (TAM–SAM–SOM Framework)
- 4.8. MSR Analyst Note
- 4.1. Porters Five Forces
- 5. Market Analysis, Insights and Forecast 2021-2033
- 5.1. Market Analysis, Insights and Forecast - by Packaging Type
- 5.1.1. Can
- 5.1.2. PET Bottle
- 5.2. Market Analysis, Insights and Forecast - by Product Type
- 5.2.1. Drinks
- 5.2.2. Shots
- 5.2.3. Mixers
- 5.3. Market Analysis, Insights and Forecast - by Distribution Channel
- 5.3.1. Supermarkets/Hypermarkets
- 5.3.2. Convenience Stores
- 5.3.3. Specalist Stores
- 5.3.4. Online Retail Stores
- 5.3.5. Other Distribution Channels
- 5.4. Market Analysis, Insights and Forecast - by Region
- 5.4.1. North America
- 5.4.2. South America
- 5.4.3. Europe
- 5.4.4. Middle East & Africa
- 5.4.5. Asia Pacific
- 5.1. Market Analysis, Insights and Forecast - by Packaging Type
- 6. Global UK Energy Drink Industry Analysis, Insights and Forecast, 2021-2033
- 6.1. Market Analysis, Insights and Forecast - by Packaging Type
- 6.1.1. Can
- 6.1.2. PET Bottle
- 6.2. Market Analysis, Insights and Forecast - by Product Type
- 6.2.1. Drinks
- 6.2.2. Shots
- 6.2.3. Mixers
- 6.3. Market Analysis, Insights and Forecast - by Distribution Channel
- 6.3.1. Supermarkets/Hypermarkets
- 6.3.2. Convenience Stores
- 6.3.3. Specalist Stores
- 6.3.4. Online Retail Stores
- 6.3.5. Other Distribution Channels
- 6.1. Market Analysis, Insights and Forecast - by Packaging Type
- 7. North America UK Energy Drink Industry Analysis, Insights and Forecast, 2020-2032
- 7.1. Market Analysis, Insights and Forecast - by Packaging Type
- 7.1.1. Can
- 7.1.2. PET Bottle
- 7.2. Market Analysis, Insights and Forecast - by Product Type
- 7.2.1. Drinks
- 7.2.2. Shots
- 7.2.3. Mixers
- 7.3. Market Analysis, Insights and Forecast - by Distribution Channel
- 7.3.1. Supermarkets/Hypermarkets
- 7.3.2. Convenience Stores
- 7.3.3. Specalist Stores
- 7.3.4. Online Retail Stores
- 7.3.5. Other Distribution Channels
- 7.1. Market Analysis, Insights and Forecast - by Packaging Type
- 8. South America UK Energy Drink Industry Analysis, Insights and Forecast, 2020-2032
- 8.1. Market Analysis, Insights and Forecast - by Packaging Type
- 8.1.1. Can
- 8.1.2. PET Bottle
- 8.2. Market Analysis, Insights and Forecast - by Product Type
- 8.2.1. Drinks
- 8.2.2. Shots
- 8.2.3. Mixers
- 8.3. Market Analysis, Insights and Forecast - by Distribution Channel
- 8.3.1. Supermarkets/Hypermarkets
- 8.3.2. Convenience Stores
- 8.3.3. Specalist Stores
- 8.3.4. Online Retail Stores
- 8.3.5. Other Distribution Channels
- 8.1. Market Analysis, Insights and Forecast - by Packaging Type
- 9. Europe UK Energy Drink Industry Analysis, Insights and Forecast, 2020-2032
- 9.1. Market Analysis, Insights and Forecast - by Packaging Type
- 9.1.1. Can
- 9.1.2. PET Bottle
- 9.2. Market Analysis, Insights and Forecast - by Product Type
- 9.2.1. Drinks
- 9.2.2. Shots
- 9.2.3. Mixers
- 9.3. Market Analysis, Insights and Forecast - by Distribution Channel
- 9.3.1. Supermarkets/Hypermarkets
- 9.3.2. Convenience Stores
- 9.3.3. Specalist Stores
- 9.3.4. Online Retail Stores
- 9.3.5. Other Distribution Channels
- 9.1. Market Analysis, Insights and Forecast - by Packaging Type
- 10. Middle East & Africa UK Energy Drink Industry Analysis, Insights and Forecast, 2020-2032
- 10.1. Market Analysis, Insights and Forecast - by Packaging Type
- 10.1.1. Can
- 10.1.2. PET Bottle
- 10.2. Market Analysis, Insights and Forecast - by Product Type
- 10.2.1. Drinks
- 10.2.2. Shots
- 10.2.3. Mixers
- 10.3. Market Analysis, Insights and Forecast - by Distribution Channel
- 10.3.1. Supermarkets/Hypermarkets
- 10.3.2. Convenience Stores
- 10.3.3. Specalist Stores
- 10.3.4. Online Retail Stores
- 10.3.5. Other Distribution Channels
- 10.1. Market Analysis, Insights and Forecast - by Packaging Type
- 11. Asia Pacific UK Energy Drink Industry Analysis, Insights and Forecast, 2020-2032
- 11.1. Market Analysis, Insights and Forecast - by Packaging Type
- 11.1.1. Can
- 11.1.2. PET Bottle
- 11.2. Market Analysis, Insights and Forecast - by Product Type
- 11.2.1. Drinks
- 11.2.2. Shots
- 11.2.3. Mixers
- 11.3. Market Analysis, Insights and Forecast - by Distribution Channel
- 11.3.1. Supermarkets/Hypermarkets
- 11.3.2. Convenience Stores
- 11.3.3. Specalist Stores
- 11.3.4. Online Retail Stores
- 11.3.5. Other Distribution Channels
- 11.1. Market Analysis, Insights and Forecast - by Packaging Type
- 12. Competitive Analysis
- 12.1. Company Profiles
- 12.1.1 TSI Consumer Goods GmbH
- 12.1.1.1. Company Overview
- 12.1.1.2. Products
- 12.1.1.3. Company Financials
- 12.1.1.4. SWOT Analysis
- 12.1.2 PepsiCo Inc
- 12.1.2.1. Company Overview
- 12.1.2.2. Products
- 12.1.2.3. Company Financials
- 12.1.2.4. SWOT Analysis
- 12.1.3 Max Muscle Nutrition
- 12.1.3.1. Company Overview
- 12.1.3.2. Products
- 12.1.3.3. Company Financials
- 12.1.3.4. SWOT Analysis
- 12.1.4 Suntory Holdings Limited
- 12.1.4.1. Company Overview
- 12.1.4.2. Products
- 12.1.4.3. Company Financials
- 12.1.4.4. SWOT Analysis
- 12.1.5 Red Bull GmbH
- 12.1.5.1. Company Overview
- 12.1.5.2. Products
- 12.1.5.3. Company Financials
- 12.1.5.4. SWOT Analysis
- 12.1.6 The Coca-Cola Company
- 12.1.6.1. Company Overview
- 12.1.6.2. Products
- 12.1.6.3. Company Financials
- 12.1.6.4. SWOT Analysis
- 12.1.7 Nestle SA*List Not Exhaustive
- 12.1.7.1. Company Overview
- 12.1.7.2. Products
- 12.1.7.3. Company Financials
- 12.1.7.4. SWOT Analysis
- 12.1.8 Global Trade Holdings Co Ltd
- 12.1.8.1. Company Overview
- 12.1.8.2. Products
- 12.1.8.3. Company Financials
- 12.1.8.4. SWOT Analysis
- 12.1.9 Monster Energy Company
- 12.1.9.1. Company Overview
- 12.1.9.2. Products
- 12.1.9.3. Company Financials
- 12.1.9.4. SWOT Analysis
- 12.1.10 GlaxoSmithKline PLC
- 12.1.10.1. Company Overview
- 12.1.10.2. Products
- 12.1.10.3. Company Financials
- 12.1.10.4. SWOT Analysis
- 12.1.1 TSI Consumer Goods GmbH
- 12.2. Market Entropy
- 12.2.1 Company's Key Areas Served
- 12.2.2 Recent Developments
- 12.3. Company Market Share Analysis 2025
- 12.3.1 Top 5 Companies Market Share Analysis
- 12.3.2 Top 3 Companies Market Share Analysis
- 12.4. List of Potential Customers
- 13. Research Methodology
List of Figures
- Figure 1: Global UK Energy Drink Industry Revenue Breakdown (billion, %) by Region 2025 & 2033
- Figure 2: Global UK Energy Drink Industry Volume Breakdown (K Liters, %) by Region 2025 & 2033
- Figure 3: North America UK Energy Drink Industry Revenue (billion), by Packaging Type 2025 & 2033
- Figure 4: North America UK Energy Drink Industry Volume (K Liters), by Packaging Type 2025 & 2033
- Figure 5: North America UK Energy Drink Industry Revenue Share (%), by Packaging Type 2025 & 2033
- Figure 6: North America UK Energy Drink Industry Volume Share (%), by Packaging Type 2025 & 2033
- Figure 7: North America UK Energy Drink Industry Revenue (billion), by Product Type 2025 & 2033
- Figure 8: North America UK Energy Drink Industry Volume (K Liters), by Product Type 2025 & 2033
- Figure 9: North America UK Energy Drink Industry Revenue Share (%), by Product Type 2025 & 2033
- Figure 10: North America UK Energy Drink Industry Volume Share (%), by Product Type 2025 & 2033
- Figure 11: North America UK Energy Drink Industry Revenue (billion), by Distribution Channel 2025 & 2033
- Figure 12: North America UK Energy Drink Industry Volume (K Liters), by Distribution Channel 2025 & 2033
- Figure 13: North America UK Energy Drink Industry Revenue Share (%), by Distribution Channel 2025 & 2033
- Figure 14: North America UK Energy Drink Industry Volume Share (%), by Distribution Channel 2025 & 2033
- Figure 15: North America UK Energy Drink Industry Revenue (billion), by Country 2025 & 2033
- Figure 16: North America UK Energy Drink Industry Volume (K Liters), by Country 2025 & 2033
- Figure 17: North America UK Energy Drink Industry Revenue Share (%), by Country 2025 & 2033
- Figure 18: North America UK Energy Drink Industry Volume Share (%), by Country 2025 & 2033
- Figure 19: South America UK Energy Drink Industry Revenue (billion), by Packaging Type 2025 & 2033
- Figure 20: South America UK Energy Drink Industry Volume (K Liters), by Packaging Type 2025 & 2033
- Figure 21: South America UK Energy Drink Industry Revenue Share (%), by Packaging Type 2025 & 2033
- Figure 22: South America UK Energy Drink Industry Volume Share (%), by Packaging Type 2025 & 2033
- Figure 23: South America UK Energy Drink Industry Revenue (billion), by Product Type 2025 & 2033
- Figure 24: South America UK Energy Drink Industry Volume (K Liters), by Product Type 2025 & 2033
- Figure 25: South America UK Energy Drink Industry Revenue Share (%), by Product Type 2025 & 2033
- Figure 26: South America UK Energy Drink Industry Volume Share (%), by Product Type 2025 & 2033
- Figure 27: South America UK Energy Drink Industry Revenue (billion), by Distribution Channel 2025 & 2033
- Figure 28: South America UK Energy Drink Industry Volume (K Liters), by Distribution Channel 2025 & 2033
- Figure 29: South America UK Energy Drink Industry Revenue Share (%), by Distribution Channel 2025 & 2033
- Figure 30: South America UK Energy Drink Industry Volume Share (%), by Distribution Channel 2025 & 2033
- Figure 31: South America UK Energy Drink Industry Revenue (billion), by Country 2025 & 2033
- Figure 32: South America UK Energy Drink Industry Volume (K Liters), by Country 2025 & 2033
- Figure 33: South America UK Energy Drink Industry Revenue Share (%), by Country 2025 & 2033
- Figure 34: South America UK Energy Drink Industry Volume Share (%), by Country 2025 & 2033
- Figure 35: Europe UK Energy Drink Industry Revenue (billion), by Packaging Type 2025 & 2033
- Figure 36: Europe UK Energy Drink Industry Volume (K Liters), by Packaging Type 2025 & 2033
- Figure 37: Europe UK Energy Drink Industry Revenue Share (%), by Packaging Type 2025 & 2033
- Figure 38: Europe UK Energy Drink Industry Volume Share (%), by Packaging Type 2025 & 2033
- Figure 39: Europe UK Energy Drink Industry Revenue (billion), by Product Type 2025 & 2033
- Figure 40: Europe UK Energy Drink Industry Volume (K Liters), by Product Type 2025 & 2033
- Figure 41: Europe UK Energy Drink Industry Revenue Share (%), by Product Type 2025 & 2033
- Figure 42: Europe UK Energy Drink Industry Volume Share (%), by Product Type 2025 & 2033
- Figure 43: Europe UK Energy Drink Industry Revenue (billion), by Distribution Channel 2025 & 2033
- Figure 44: Europe UK Energy Drink Industry Volume (K Liters), by Distribution Channel 2025 & 2033
- Figure 45: Europe UK Energy Drink Industry Revenue Share (%), by Distribution Channel 2025 & 2033
- Figure 46: Europe UK Energy Drink Industry Volume Share (%), by Distribution Channel 2025 & 2033
- Figure 47: Europe UK Energy Drink Industry Revenue (billion), by Country 2025 & 2033
- Figure 48: Europe UK Energy Drink Industry Volume (K Liters), by Country 2025 & 2033
- Figure 49: Europe UK Energy Drink Industry Revenue Share (%), by Country 2025 & 2033
- Figure 50: Europe UK Energy Drink Industry Volume Share (%), by Country 2025 & 2033
- Figure 51: Middle East & Africa UK Energy Drink Industry Revenue (billion), by Packaging Type 2025 & 2033
- Figure 52: Middle East & Africa UK Energy Drink Industry Volume (K Liters), by Packaging Type 2025 & 2033
- Figure 53: Middle East & Africa UK Energy Drink Industry Revenue Share (%), by Packaging Type 2025 & 2033
- Figure 54: Middle East & Africa UK Energy Drink Industry Volume Share (%), by Packaging Type 2025 & 2033
- Figure 55: Middle East & Africa UK Energy Drink Industry Revenue (billion), by Product Type 2025 & 2033
- Figure 56: Middle East & Africa UK Energy Drink Industry Volume (K Liters), by Product Type 2025 & 2033
- Figure 57: Middle East & Africa UK Energy Drink Industry Revenue Share (%), by Product Type 2025 & 2033
- Figure 58: Middle East & Africa UK Energy Drink Industry Volume Share (%), by Product Type 2025 & 2033
- Figure 59: Middle East & Africa UK Energy Drink Industry Revenue (billion), by Distribution Channel 2025 & 2033
- Figure 60: Middle East & Africa UK Energy Drink Industry Volume (K Liters), by Distribution Channel 2025 & 2033
- Figure 61: Middle East & Africa UK Energy Drink Industry Revenue Share (%), by Distribution Channel 2025 & 2033
- Figure 62: Middle East & Africa UK Energy Drink Industry Volume Share (%), by Distribution Channel 2025 & 2033
- Figure 63: Middle East & Africa UK Energy Drink Industry Revenue (billion), by Country 2025 & 2033
- Figure 64: Middle East & Africa UK Energy Drink Industry Volume (K Liters), by Country 2025 & 2033
- Figure 65: Middle East & Africa UK Energy Drink Industry Revenue Share (%), by Country 2025 & 2033
- Figure 66: Middle East & Africa UK Energy Drink Industry Volume Share (%), by Country 2025 & 2033
- Figure 67: Asia Pacific UK Energy Drink Industry Revenue (billion), by Packaging Type 2025 & 2033
- Figure 68: Asia Pacific UK Energy Drink Industry Volume (K Liters), by Packaging Type 2025 & 2033
- Figure 69: Asia Pacific UK Energy Drink Industry Revenue Share (%), by Packaging Type 2025 & 2033
- Figure 70: Asia Pacific UK Energy Drink Industry Volume Share (%), by Packaging Type 2025 & 2033
- Figure 71: Asia Pacific UK Energy Drink Industry Revenue (billion), by Product Type 2025 & 2033
- Figure 72: Asia Pacific UK Energy Drink Industry Volume (K Liters), by Product Type 2025 & 2033
- Figure 73: Asia Pacific UK Energy Drink Industry Revenue Share (%), by Product Type 2025 & 2033
- Figure 74: Asia Pacific UK Energy Drink Industry Volume Share (%), by Product Type 2025 & 2033
- Figure 75: Asia Pacific UK Energy Drink Industry Revenue (billion), by Distribution Channel 2025 & 2033
- Figure 76: Asia Pacific UK Energy Drink Industry Volume (K Liters), by Distribution Channel 2025 & 2033
- Figure 77: Asia Pacific UK Energy Drink Industry Revenue Share (%), by Distribution Channel 2025 & 2033
- Figure 78: Asia Pacific UK Energy Drink Industry Volume Share (%), by Distribution Channel 2025 & 2033
- Figure 79: Asia Pacific UK Energy Drink Industry Revenue (billion), by Country 2025 & 2033
- Figure 80: Asia Pacific UK Energy Drink Industry Volume (K Liters), by Country 2025 & 2033
- Figure 81: Asia Pacific UK Energy Drink Industry Revenue Share (%), by Country 2025 & 2033
- Figure 82: Asia Pacific UK Energy Drink Industry Volume Share (%), by Country 2025 & 2033
List of Tables
- Table 1: Global UK Energy Drink Industry Revenue billion Forecast, by Packaging Type 2020 & 2033
- Table 2: Global UK Energy Drink Industry Volume K Liters Forecast, by Packaging Type 2020 & 2033
- Table 3: Global UK Energy Drink Industry Revenue billion Forecast, by Product Type 2020 & 2033
- Table 4: Global UK Energy Drink Industry Volume K Liters Forecast, by Product Type 2020 & 2033
- Table 5: Global UK Energy Drink Industry Revenue billion Forecast, by Distribution Channel 2020 & 2033
- Table 6: Global UK Energy Drink Industry Volume K Liters Forecast, by Distribution Channel 2020 & 2033
- Table 7: Global UK Energy Drink Industry Revenue billion Forecast, by Region 2020 & 2033
- Table 8: Global UK Energy Drink Industry Volume K Liters Forecast, by Region 2020 & 2033
- Table 9: Global UK Energy Drink Industry Revenue billion Forecast, by Packaging Type 2020 & 2033
- Table 10: Global UK Energy Drink Industry Volume K Liters Forecast, by Packaging Type 2020 & 2033
- Table 11: Global UK Energy Drink Industry Revenue billion Forecast, by Product Type 2020 & 2033
- Table 12: Global UK Energy Drink Industry Volume K Liters Forecast, by Product Type 2020 & 2033
- Table 13: Global UK Energy Drink Industry Revenue billion Forecast, by Distribution Channel 2020 & 2033
- Table 14: Global UK Energy Drink Industry Volume K Liters Forecast, by Distribution Channel 2020 & 2033
- Table 15: Global UK Energy Drink Industry Revenue billion Forecast, by Country 2020 & 2033
- Table 16: Global UK Energy Drink Industry Volume K Liters Forecast, by Country 2020 & 2033
- Table 17: United States UK Energy Drink Industry Revenue (billion) Forecast, by Application 2020 & 2033
- Table 18: United States UK Energy Drink Industry Volume (K Liters) Forecast, by Application 2020 & 2033
- Table 19: Canada UK Energy Drink Industry Revenue (billion) Forecast, by Application 2020 & 2033
- Table 20: Canada UK Energy Drink Industry Volume (K Liters) Forecast, by Application 2020 & 2033
- Table 21: Mexico UK Energy Drink Industry Revenue (billion) Forecast, by Application 2020 & 2033
- Table 22: Mexico UK Energy Drink Industry Volume (K Liters) Forecast, by Application 2020 & 2033
- Table 23: Global UK Energy Drink Industry Revenue billion Forecast, by Packaging Type 2020 & 2033
- Table 24: Global UK Energy Drink Industry Volume K Liters Forecast, by Packaging Type 2020 & 2033
- Table 25: Global UK Energy Drink Industry Revenue billion Forecast, by Product Type 2020 & 2033
- Table 26: Global UK Energy Drink Industry Volume K Liters Forecast, by Product Type 2020 & 2033
- Table 27: Global UK Energy Drink Industry Revenue billion Forecast, by Distribution Channel 2020 & 2033
- Table 28: Global UK Energy Drink Industry Volume K Liters Forecast, by Distribution Channel 2020 & 2033
- Table 29: Global UK Energy Drink Industry Revenue billion Forecast, by Country 2020 & 2033
- Table 30: Global UK Energy Drink Industry Volume K Liters Forecast, by Country 2020 & 2033
- Table 31: Brazil UK Energy Drink Industry Revenue (billion) Forecast, by Application 2020 & 2033
- Table 32: Brazil UK Energy Drink Industry Volume (K Liters) Forecast, by Application 2020 & 2033
- Table 33: Argentina UK Energy Drink Industry Revenue (billion) Forecast, by Application 2020 & 2033
- Table 34: Argentina UK Energy Drink Industry Volume (K Liters) Forecast, by Application 2020 & 2033
- Table 35: Rest of South America UK Energy Drink Industry Revenue (billion) Forecast, by Application 2020 & 2033
- Table 36: Rest of South America UK Energy Drink Industry Volume (K Liters) Forecast, by Application 2020 & 2033
- Table 37: Global UK Energy Drink Industry Revenue billion Forecast, by Packaging Type 2020 & 2033
- Table 38: Global UK Energy Drink Industry Volume K Liters Forecast, by Packaging Type 2020 & 2033
- Table 39: Global UK Energy Drink Industry Revenue billion Forecast, by Product Type 2020 & 2033
- Table 40: Global UK Energy Drink Industry Volume K Liters Forecast, by Product Type 2020 & 2033
- Table 41: Global UK Energy Drink Industry Revenue billion Forecast, by Distribution Channel 2020 & 2033
- Table 42: Global UK Energy Drink Industry Volume K Liters Forecast, by Distribution Channel 2020 & 2033
- Table 43: Global UK Energy Drink Industry Revenue billion Forecast, by Country 2020 & 2033
- Table 44: Global UK Energy Drink Industry Volume K Liters Forecast, by Country 2020 & 2033
- Table 45: United Kingdom UK Energy Drink Industry Revenue (billion) Forecast, by Application 2020 & 2033
- Table 46: United Kingdom UK Energy Drink Industry Volume (K Liters) Forecast, by Application 2020 & 2033
- Table 47: Germany UK Energy Drink Industry Revenue (billion) Forecast, by Application 2020 & 2033
- Table 48: Germany UK Energy Drink Industry Volume (K Liters) Forecast, by Application 2020 & 2033
- Table 49: France UK Energy Drink Industry Revenue (billion) Forecast, by Application 2020 & 2033
- Table 50: France UK Energy Drink Industry Volume (K Liters) Forecast, by Application 2020 & 2033
- Table 51: Italy UK Energy Drink Industry Revenue (billion) Forecast, by Application 2020 & 2033
- Table 52: Italy UK Energy Drink Industry Volume (K Liters) Forecast, by Application 2020 & 2033
- Table 53: Spain UK Energy Drink Industry Revenue (billion) Forecast, by Application 2020 & 2033
- Table 54: Spain UK Energy Drink Industry Volume (K Liters) Forecast, by Application 2020 & 2033
- Table 55: Russia UK Energy Drink Industry Revenue (billion) Forecast, by Application 2020 & 2033
- Table 56: Russia UK Energy Drink Industry Volume (K Liters) Forecast, by Application 2020 & 2033
- Table 57: Benelux UK Energy Drink Industry Revenue (billion) Forecast, by Application 2020 & 2033
- Table 58: Benelux UK Energy Drink Industry Volume (K Liters) Forecast, by Application 2020 & 2033
- Table 59: Nordics UK Energy Drink Industry Revenue (billion) Forecast, by Application 2020 & 2033
- Table 60: Nordics UK Energy Drink Industry Volume (K Liters) Forecast, by Application 2020 & 2033
- Table 61: Rest of Europe UK Energy Drink Industry Revenue (billion) Forecast, by Application 2020 & 2033
- Table 62: Rest of Europe UK Energy Drink Industry Volume (K Liters) Forecast, by Application 2020 & 2033
- Table 63: Global UK Energy Drink Industry Revenue billion Forecast, by Packaging Type 2020 & 2033
- Table 64: Global UK Energy Drink Industry Volume K Liters Forecast, by Packaging Type 2020 & 2033
- Table 65: Global UK Energy Drink Industry Revenue billion Forecast, by Product Type 2020 & 2033
- Table 66: Global UK Energy Drink Industry Volume K Liters Forecast, by Product Type 2020 & 2033
- Table 67: Global UK Energy Drink Industry Revenue billion Forecast, by Distribution Channel 2020 & 2033
- Table 68: Global UK Energy Drink Industry Volume K Liters Forecast, by Distribution Channel 2020 & 2033
- Table 69: Global UK Energy Drink Industry Revenue billion Forecast, by Country 2020 & 2033
- Table 70: Global UK Energy Drink Industry Volume K Liters Forecast, by Country 2020 & 2033
- Table 71: Turkey UK Energy Drink Industry Revenue (billion) Forecast, by Application 2020 & 2033
- Table 72: Turkey UK Energy Drink Industry Volume (K Liters) Forecast, by Application 2020 & 2033
- Table 73: Israel UK Energy Drink Industry Revenue (billion) Forecast, by Application 2020 & 2033
- Table 74: Israel UK Energy Drink Industry Volume (K Liters) Forecast, by Application 2020 & 2033
- Table 75: GCC UK Energy Drink Industry Revenue (billion) Forecast, by Application 2020 & 2033
- Table 76: GCC UK Energy Drink Industry Volume (K Liters) Forecast, by Application 2020 & 2033
- Table 77: North Africa UK Energy Drink Industry Revenue (billion) Forecast, by Application 2020 & 2033
- Table 78: North Africa UK Energy Drink Industry Volume (K Liters) Forecast, by Application 2020 & 2033
- Table 79: South Africa UK Energy Drink Industry Revenue (billion) Forecast, by Application 2020 & 2033
- Table 80: South Africa UK Energy Drink Industry Volume (K Liters) Forecast, by Application 2020 & 2033
- Table 81: Rest of Middle East & Africa UK Energy Drink Industry Revenue (billion) Forecast, by Application 2020 & 2033
- Table 82: Rest of Middle East & Africa UK Energy Drink Industry Volume (K Liters) Forecast, by Application 2020 & 2033
- Table 83: Global UK Energy Drink Industry Revenue billion Forecast, by Packaging Type 2020 & 2033
- Table 84: Global UK Energy Drink Industry Volume K Liters Forecast, by Packaging Type 2020 & 2033
- Table 85: Global UK Energy Drink Industry Revenue billion Forecast, by Product Type 2020 & 2033
- Table 86: Global UK Energy Drink Industry Volume K Liters Forecast, by Product Type 2020 & 2033
- Table 87: Global UK Energy Drink Industry Revenue billion Forecast, by Distribution Channel 2020 & 2033
- Table 88: Global UK Energy Drink Industry Volume K Liters Forecast, by Distribution Channel 2020 & 2033
- Table 89: Global UK Energy Drink Industry Revenue billion Forecast, by Country 2020 & 2033
- Table 90: Global UK Energy Drink Industry Volume K Liters Forecast, by Country 2020 & 2033
- Table 91: China UK Energy Drink Industry Revenue (billion) Forecast, by Application 2020 & 2033
- Table 92: China UK Energy Drink Industry Volume (K Liters) Forecast, by Application 2020 & 2033
- Table 93: India UK Energy Drink Industry Revenue (billion) Forecast, by Application 2020 & 2033
- Table 94: India UK Energy Drink Industry Volume (K Liters) Forecast, by Application 2020 & 2033
- Table 95: Japan UK Energy Drink Industry Revenue (billion) Forecast, by Application 2020 & 2033
- Table 96: Japan UK Energy Drink Industry Volume (K Liters) Forecast, by Application 2020 & 2033
- Table 97: South Korea UK Energy Drink Industry Revenue (billion) Forecast, by Application 2020 & 2033
- Table 98: South Korea UK Energy Drink Industry Volume (K Liters) Forecast, by Application 2020 & 2033
- Table 99: ASEAN UK Energy Drink Industry Revenue (billion) Forecast, by Application 2020 & 2033
- Table 100: ASEAN UK Energy Drink Industry Volume (K Liters) Forecast, by Application 2020 & 2033
- Table 101: Oceania UK Energy Drink Industry Revenue (billion) Forecast, by Application 2020 & 2033
- Table 102: Oceania UK Energy Drink Industry Volume (K Liters) Forecast, by Application 2020 & 2033
- Table 103: Rest of Asia Pacific UK Energy Drink Industry Revenue (billion) Forecast, by Application 2020 & 2033
- Table 104: Rest of Asia Pacific UK Energy Drink Industry Volume (K Liters) Forecast, by Application 2020 & 2033
Frequently Asked Questions
1. What is the projected Compound Annual Growth Rate (CAGR) of the UK Energy Drink Industry?
The projected CAGR is approximately 5.67%.
2. Which companies are prominent players in the UK Energy Drink Industry?
Key companies in the market include TSI Consumer Goods GmbH, PepsiCo Inc, Max Muscle Nutrition, Suntory Holdings Limited, Red Bull GmbH, The Coca-Cola Company, Nestle SA*List Not Exhaustive, Global Trade Holdings Co Ltd, Monster Energy Company, GlaxoSmithKline PLC.
3. What are the main segments of the UK Energy Drink Industry?
The market segments include Packaging Type, Product Type, Distribution Channel.
4. Can you provide details about the market size?
The market size is estimated to be USD 2.2 billion as of 2022.
5. What are some drivers contributing to market growth?
Rising Health & Wellness Trends; Strategic Initiatives By Key Players.
6. What are the notable trends driving market growth?
The Drinks Segment Dominates the Energy Drink Market.
7. Are there any restraints impacting market growth?
Cost Considerations Coupled With Availability Of Alternatives.
8. Can you provide examples of recent developments in the market?
In September 2022, Virtue Clean Energy, the brand that creates clean alternatives in the energy drink category, launched its newest product, Virtue Clean Energy in the United Kingdom. Virtue Drinks contain zero sugar & zero calories, made with all-natural ingredients. It has 80mg of 100% organic caffeine derived from green coffee beans, plus B vitamins (B3, B6, B7, B12).
9. What pricing options are available for accessing the report?
Pricing options include single-user, multi-user, and enterprise licenses priced at USD 3800, USD 4500, and USD 5800 respectively.
10. Is the market size provided in terms of value or volume?
The market size is provided in terms of value, measured in billion and volume, measured in K Liters.
11. Are there any specific market keywords associated with the report?
Yes, the market keyword associated with the report is "UK Energy Drink Industry," which aids in identifying and referencing the specific market segment covered.
12. How do I determine which pricing option suits my needs best?
The pricing options vary based on user requirements and access needs. Individual users may opt for single-user licenses, while businesses requiring broader access may choose multi-user or enterprise licenses for cost-effective access to the report.
13. Are there any additional resources or data provided in the UK Energy Drink Industry report?
While the report offers comprehensive insights, it's advisable to review the specific contents or supplementary materials provided to ascertain if additional resources or data are available.
14. How can I stay updated on further developments or reports in the UK Energy Drink Industry?
To stay informed about further developments, trends, and reports in the UK Energy Drink Industry, consider subscribing to industry newsletters, following relevant companies and organizations, or regularly checking reputable industry news sources and publications.
Methodology
Step 1 - Identification of Relevant Samples Size from Population Database


Step 2 - Approaches for Defining Global Market Size (Value, Volume* & Price*)

Note*: In applicable scenarios
Step 3 - Data Sources
Primary Research
- Web Analytics
- Survey Reports
- Research Institute
- Latest Research Reports
- Opinion Leaders
Secondary Research
- Annual Reports
- White Paper
- Latest Press Release
- Industry Association
- Paid Database
- Investor Presentations

Step 4 - Data Triangulation
Involves using different sources of information in order to increase the validity of a study
These sources are likely to be stakeholders in a program - participants, other researchers, program staff, other community members, and so on.
Then we put all data in single framework & apply various statistical tools to find out the dynamic on the market.
During the analysis stage, feedback from the stakeholder groups would be compared to determine areas of agreement as well as areas of divergence