

Key Insights
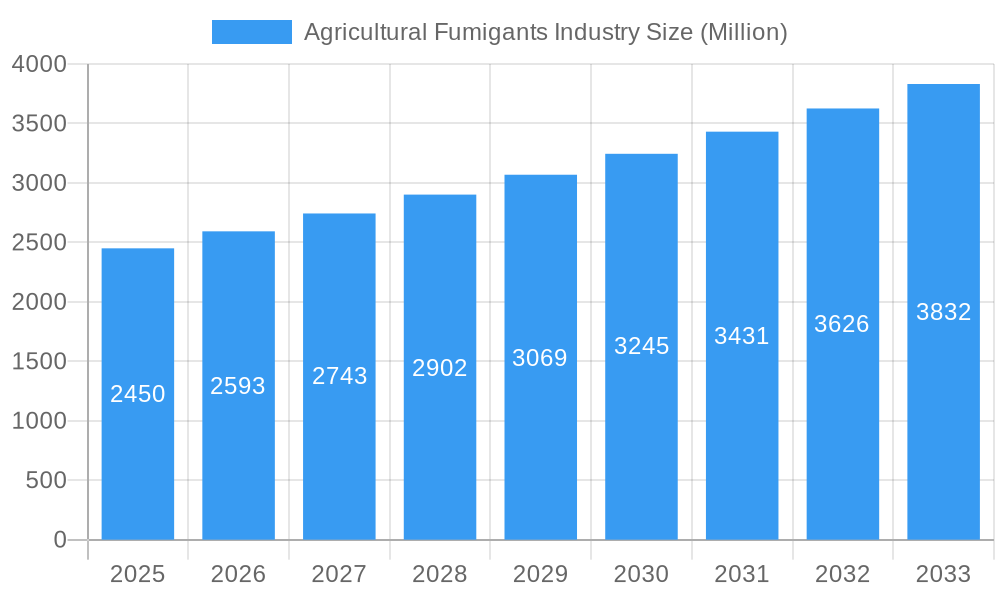
The global agricultural fumigants market, valued at $2.45 billion in 2025, is projected to experience robust growth, driven by a Compound Annual Growth Rate (CAGR) of 5.60% from 2025 to 2033. This expansion is fueled by several key factors. Increasing global food demand necessitates higher crop yields, leading to greater adoption of fumigants to control soilborne pests and diseases that significantly impact crop productivity. The rising prevalence of pest-resistant strains further underscores the need for effective fumigation solutions. Technological advancements in fumigation techniques, such as improved application methods and the development of safer and more efficient fumigants, are also contributing to market growth. However, stringent regulations concerning the environmental impact of certain fumigants, particularly methyl bromide due to its ozone-depleting potential, pose a significant restraint. The market is segmented by fumigant type (Methyl Bromide, Chloropicrin, Phosphine, Metam Sodium, 1,3-Dichloropropene, and Others), application method (Soil, Warehouse), form (Solid, Liquid, Gas), and crop application (Crop-based, Non-crop-based). The diverse range of fumigants caters to specific pest control needs across varied agricultural settings. Major players like VFC, FMC Corporation, and Adama Agricultural Solutions are actively engaged in research and development, aiming to introduce innovative and environmentally friendly fumigants to meet the evolving needs of the agricultural sector. Regional variations in market size will be influenced by factors such as agricultural practices, regulatory landscapes, and pest prevalence. Developing economies in Asia-Pacific and South America present considerable growth opportunities due to expanding agricultural production.
Agricultural Fumigants Industry Market Size (In Billion)
The competitive landscape is characterized by the presence of both large multinational corporations and specialized fumigation service providers. Companies are focusing on strategic partnerships, mergers, and acquisitions to expand their market reach and product portfolios. The emphasis is on developing sustainable fumigation solutions that minimize environmental impact while maximizing efficacy. This includes exploring alternative fumigants with reduced environmental risks and developing precision application technologies to minimize usage. The continued growth of the market will depend on the balance between addressing environmental concerns and meeting the escalating demand for food security and efficient pest management in agriculture. The forecast period of 2025-2033 offers significant opportunities for market expansion, particularly with a focus on environmentally sustainable fumigants and precise application technologies.
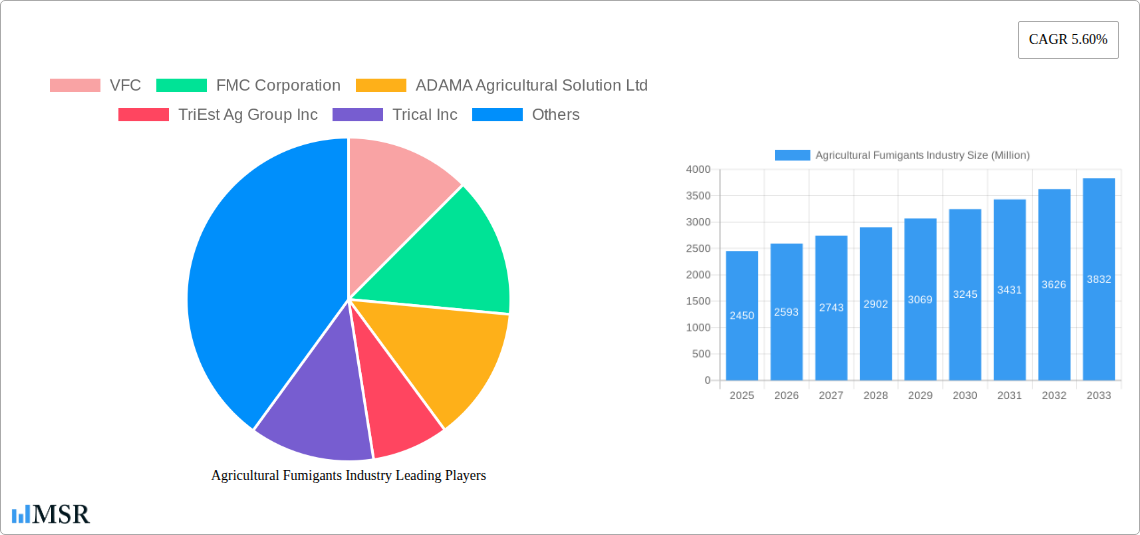
Agricultural Fumigants Industry Company Market Share
Agricultural Fumigants Industry Market Report: 2019-2033
This comprehensive report provides an in-depth analysis of the global Agricultural Fumigants Industry, offering invaluable insights for stakeholders seeking to navigate this dynamic market. Covering the period from 2019 to 2033, with a focus on 2025, this report meticulously examines market dynamics, key players, and future growth prospects. The market is projected to reach xx Million by 2033, exhibiting a CAGR of xx% during the forecast period (2025-2033). This report is essential for investors, manufacturers, researchers, and anyone involved in the agricultural sector.
Agricultural Fumigants Industry Market Concentration & Dynamics
The Agricultural Fumigants market is moderately concentrated, with key players like FMC Corporation, ADAMA Agricultural Solutions Ltd, and BASF SE holding significant market share. The combined market share of the top five players is estimated to be xx%. Innovation in this space centers around developing more environmentally friendly fumigants and improving application methods. Regulatory frameworks, particularly concerning Methyl Bromide, are constantly evolving, influencing market dynamics. Substitute products, including biological controls and other pest management techniques, pose a growing challenge. End-user trends lean towards sustainable and efficient solutions. M&A activity has been relatively moderate in recent years, with an estimated xx M&A deals concluded between 2019 and 2024.
- Market Share (2024 Estimate): FMC Corporation (xx%), ADAMA Agricultural Solutions Ltd (xx%), BASF SE (xx%), Others (xx%).
- M&A Activity (2019-2024): xx deals, primarily focusing on consolidation and expansion into new markets.
- Key Regulatory Factors: Montreal Protocol's phase-out of Methyl Bromide, regional restrictions on fumigant use.
- Substitute Products: Biological controls, integrated pest management (IPM) strategies.
Agricultural Fumigants Industry Insights & Trends
The global Agricultural Fumigants market experienced significant growth during the historical period (2019-2024), driven by factors such as the increasing demand for food, rising agricultural productivity, and the expansion of protected cultivation. Market size reached xx Million in 2024. Technological disruptions, including advancements in application techniques and the development of novel fumigants, have further propelled growth. Changing consumer preferences towards pesticide-free produce and the increasing awareness of environmental sustainability are influencing the market. The market is expected to maintain a robust growth trajectory in the forecast period, propelled by expanding agricultural land and the rising adoption of advanced farming practices in developing nations. The rising prevalence of soil-borne diseases and pests is also bolstering the demand for effective fumigation solutions. Furthermore, government initiatives supporting agricultural modernization and technological advancements are providing a positive impetus to the market.
Key Markets & Segments Leading Agricultural Fumigants Industry
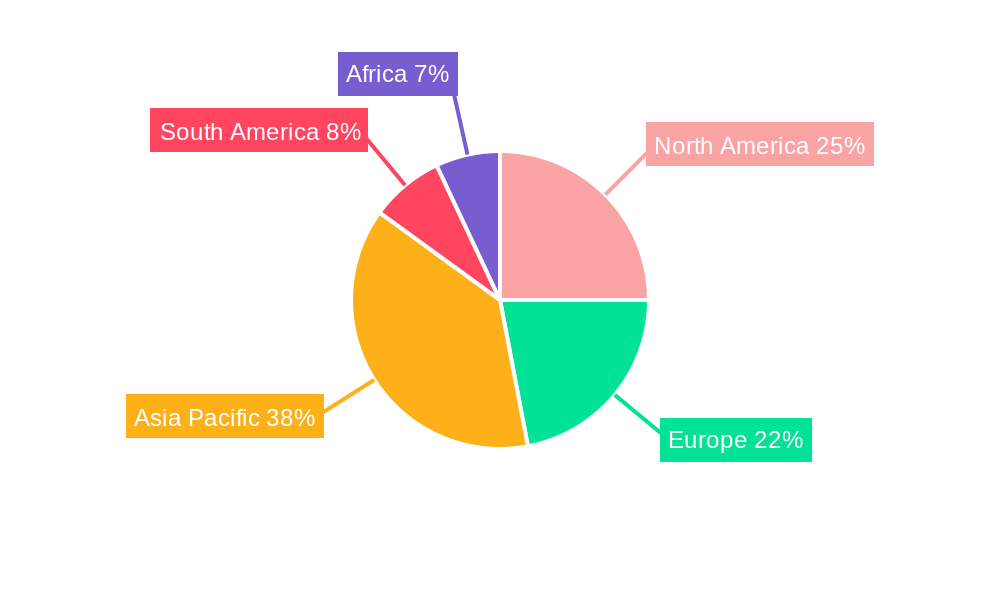
The Asia-Pacific region is currently the dominant market for agricultural fumigants, accounting for approximately xx% of the global market share in 2024. This is primarily driven by the large agricultural sector in countries like India and China. Within product types, Methyl Bromide remains a significant segment, despite regulatory restrictions, while Phosphine and Metam Sodium are witnessing substantial growth. Soil application accounts for the majority of fumigant usage. The demand for liquid formulations is consistently high. Crop-based applications constitute a larger segment compared to non-crop based applications.
- Regional Dominance: Asia-Pacific (xx%), followed by North America (xx%) and Europe (xx%).
- Type Segment Drivers:
- Methyl Bromide: High efficacy despite regulatory pressures.
- Phosphine: Increasing adoption due to its broad-spectrum efficacy and relatively lower environmental impact compared to Methyl Bromide.
- Metam Sodium: Growth driven by its effectiveness against nematodes and soil-borne diseases.
- Application Method Drivers:
- Soil Application: Predominant method due to its effectiveness in controlling soil-borne pests and diseases.
- Warehouse Application: Increasing adoption for protecting stored grains and other agricultural products.
- Form Drivers:
- Liquid: Ease of application and storage.
- Gas: Effectiveness in reaching wider areas and penetrating into the soil.
Agricultural Fumigants Industry Product Developments
Recent product innovations focus on developing fumigants with reduced environmental impact and enhanced efficacy. These include formulations with improved delivery systems, reduced emission rates, and targeted action against specific pests. The market is witnessing increased research and development in biofumigants, providing safer and eco-friendly alternatives to traditional chemical fumigants. These advancements aim to offer superior efficacy while mitigating environmental concerns and meeting stringent regulatory requirements.
Challenges in the Agricultural Fumigants Industry Market
The Agricultural Fumigants industry faces significant challenges, including stringent regulations limiting the use of certain fumigants (resulting in a xx% reduction in Methyl Bromide usage since 2019), increasing costs of raw materials and manufacturing impacting margins by xx%, and intense competition among existing players which has led to price wars. Supply chain disruptions can also significantly impact production and distribution, further adding to the complexity of operating in this sector.
Forces Driving Agricultural Fumigants Industry Growth
Key growth drivers include increasing food demand, expanding agricultural land under cultivation, and the rising prevalence of soil-borne diseases and pests. Technological advancements in fumigation techniques and the development of new, more environmentally friendly fumigants also contribute to the market's expansion. Moreover, governmental support for agricultural modernization and improved infrastructure facilitate the adoption of fumigation practices.
Long-Term Growth Catalysts in Agricultural Fumigants Industry
Long-term growth hinges on continued innovation in developing environmentally sustainable fumigants, strategic partnerships to expand market reach, and penetration into emerging markets with increasing agricultural production. This also includes collaborative efforts between research institutions and industry players to develop next-generation fumigation technologies.
Emerging Opportunities in Agricultural Fumigants Industry
Emerging opportunities lie in the development and commercialization of biofumigants and other eco-friendly alternatives, expanding into developing nations with high agricultural potential, and offering customized fumigation services based on specific crop needs. The exploration of new application technologies, like drone-based fumigation, also presents exciting possibilities.
Leading Players in the Agricultural Fumigants Industry Sector
- VFC
- FMC Corporation
- ADAMA Agricultural Solution Ltd
- TriEst Ag Group Inc
- Trical Inc
- Fumigation Services
- Ikeda Kogyo Co Ltd
- Detia Degesch GmbH
- DowDuPont
- Lanxess
- Isagro SpA
- Syngenta AG
- UPL Group
- Industrial Fumigation Compan
- Industrial Fumigation Company
- Amvac Chemical Corporation
- Reddick Fumigants LLC
- Cytec Solvay Group
- BASF SE
Key Milestones in Agricultural Fumigants Industry Industry
- 2020: Increased regulatory scrutiny on Methyl Bromide usage in several regions.
- 2022: Launch of a new biofumigant by FMC Corporation.
- 2023: Acquisition of a smaller fumigant manufacturer by ADAMA Agricultural Solutions Ltd.
Strategic Outlook for Agricultural Fumigants Industry Market
The future of the Agricultural Fumigants market looks promising, driven by factors such as the increasing demand for food, technological advancements, and the growing awareness of soil health. Strategic opportunities exist for companies that can innovate and develop sustainable and effective fumigants, while also navigating the complex regulatory landscape. The focus on environmental sustainability and the increasing adoption of precision agriculture will shape the future of this market.
Agricultural Fumigants Industry Segmentation
- 1. Production Analysis
- 2. Consumption Analysis
- 3. Import Market Analysis (Value & Volume)
- 4. Export Market Analysis (Value & Volume)
- 5. Price Trend Analysis
Agricultural Fumigants Industry Segmentation By Geography
-
1. North America
- 1.1. United States
- 1.2. Canada
- 1.3. Mexico
-
2. South America
- 2.1. Brazil
- 2.2. Argentina
- 2.3. Rest of South America
-
3. Europe
- 3.1. United Kingdom
- 3.2. Germany
- 3.3. France
- 3.4. Italy
- 3.5. Spain
- 3.6. Russia
- 3.7. Benelux
- 3.8. Nordics
- 3.9. Rest of Europe
-
4. Middle East & Africa
- 4.1. Turkey
- 4.2. Israel
- 4.3. GCC
- 4.4. North Africa
- 4.5. South Africa
- 4.6. Rest of Middle East & Africa
-
5. Asia Pacific
- 5.1. China
- 5.2. India
- 5.3. Japan
- 5.4. South Korea
- 5.5. ASEAN
- 5.6. Oceania
- 5.7. Rest of Asia Pacific
Agricultural Fumigants Industry Regional Market Share
Geographic Coverage of Agricultural Fumigants Industry
Agricultural Fumigants Industry REPORT HIGHLIGHTS
| Aspects | Details |
|---|---|
| Study Period | 2020-2034 |
| Base Year | 2025 |
| Estimated Year | 2026 |
| Forecast Period | 2026-2034 |
| Historical Period | 2020-2025 |
| Growth Rate | CAGR of 5.60% from 2020-2034 |
| Segmentation |
|
Table of Contents
- 1. Introduction
- 1.1. Research Scope
- 1.2. Market Segmentation
- 1.3. Research Objective
- 1.4. Definitions and Assumptions
- 2. Executive Summary
- 2.1. Market Snapshot
- 3. Market Dynamics
- 3.1. Market Drivers
- 3.2. Market Restrains
- 3.3. Market Trends
- 3.4. Market Opportunities
- 4. Market Factor Analysis
- 4.1. Porters Five Forces
- 4.1.1. Bargaining Power of Suppliers
- 4.1.2. Bargaining Power of Buyers
- 4.1.3. Threat of New Entrants
- 4.1.4. Threat of Substitutes
- 4.1.5. Competitive Rivalry
- 4.2. PESTEL analysis
- 4.3. BCG Analysis
- 4.3.1. Stars (High Growth, High Market Share)
- 4.3.2. Cash Cows (Low Growth, High Market Share)
- 4.3.3. Question Mark (High Growth, Low Market Share)
- 4.3.4. Dogs (Low Growth, Low Market Share)
- 4.4. Ansoff Matrix Analysis
- 4.5. Supply Chain Analysis
- 4.6. Regulatory Landscape
- 4.7. Current Market Potential and Opportunity Assessment (TAM–SAM–SOM Framework)
- 4.8. MSR Analyst Note
- 4.1. Porters Five Forces
- 5. Market Analysis, Insights and Forecast 2021-2033
- 5.1. Market Analysis, Insights and Forecast - by Production Analysis
- 5.2. Market Analysis, Insights and Forecast - by Consumption Analysis
- 5.3. Market Analysis, Insights and Forecast - by Import Market Analysis (Value & Volume)
- 5.4. Market Analysis, Insights and Forecast - by Export Market Analysis (Value & Volume)
- 5.5. Market Analysis, Insights and Forecast - by Price Trend Analysis
- 5.6. Market Analysis, Insights and Forecast - by Region
- 5.6.1. North America
- 5.6.2. South America
- 5.6.3. Europe
- 5.6.4. Middle East & Africa
- 5.6.5. Asia Pacific
- 6. Global Agricultural Fumigants Industry Analysis, Insights and Forecast, 2021-2033
- 6.1. Market Analysis, Insights and Forecast - by Production Analysis
- 6.2. Market Analysis, Insights and Forecast - by Consumption Analysis
- 6.3. Market Analysis, Insights and Forecast - by Import Market Analysis (Value & Volume)
- 6.4. Market Analysis, Insights and Forecast - by Export Market Analysis (Value & Volume)
- 6.5. Market Analysis, Insights and Forecast - by Price Trend Analysis
- 7. North America Agricultural Fumigants Industry Analysis, Insights and Forecast, 2020-2032
- 7.1. Market Analysis, Insights and Forecast - by Production Analysis
- 7.2. Market Analysis, Insights and Forecast - by Consumption Analysis
- 7.3. Market Analysis, Insights and Forecast - by Import Market Analysis (Value & Volume)
- 7.4. Market Analysis, Insights and Forecast - by Export Market Analysis (Value & Volume)
- 7.5. Market Analysis, Insights and Forecast - by Price Trend Analysis
- 8. South America Agricultural Fumigants Industry Analysis, Insights and Forecast, 2020-2032
- 8.1. Market Analysis, Insights and Forecast - by Production Analysis
- 8.2. Market Analysis, Insights and Forecast - by Consumption Analysis
- 8.3. Market Analysis, Insights and Forecast - by Import Market Analysis (Value & Volume)
- 8.4. Market Analysis, Insights and Forecast - by Export Market Analysis (Value & Volume)
- 8.5. Market Analysis, Insights and Forecast - by Price Trend Analysis
- 9. Europe Agricultural Fumigants Industry Analysis, Insights and Forecast, 2020-2032
- 9.1. Market Analysis, Insights and Forecast - by Production Analysis
- 9.2. Market Analysis, Insights and Forecast - by Consumption Analysis
- 9.3. Market Analysis, Insights and Forecast - by Import Market Analysis (Value & Volume)
- 9.4. Market Analysis, Insights and Forecast - by Export Market Analysis (Value & Volume)
- 9.5. Market Analysis, Insights and Forecast - by Price Trend Analysis
- 10. Middle East & Africa Agricultural Fumigants Industry Analysis, Insights and Forecast, 2020-2032
- 10.1. Market Analysis, Insights and Forecast - by Production Analysis
- 10.2. Market Analysis, Insights and Forecast - by Consumption Analysis
- 10.3. Market Analysis, Insights and Forecast - by Import Market Analysis (Value & Volume)
- 10.4. Market Analysis, Insights and Forecast - by Export Market Analysis (Value & Volume)
- 10.5. Market Analysis, Insights and Forecast - by Price Trend Analysis
- 11. Asia Pacific Agricultural Fumigants Industry Analysis, Insights and Forecast, 2020-2032
- 11.1. Market Analysis, Insights and Forecast - by Production Analysis
- 11.2. Market Analysis, Insights and Forecast - by Consumption Analysis
- 11.3. Market Analysis, Insights and Forecast - by Import Market Analysis (Value & Volume)
- 11.4. Market Analysis, Insights and Forecast - by Export Market Analysis (Value & Volume)
- 11.5. Market Analysis, Insights and Forecast - by Price Trend Analysis
- 12. Competitive Analysis
- 12.1. Company Profiles
- 12.1.1 VFC
- 12.1.1.1. Company Overview
- 12.1.1.2. Products
- 12.1.1.3. Company Financials
- 12.1.1.4. SWOT Analysis
- 12.1.2 FMC Corporation
- 12.1.2.1. Company Overview
- 12.1.2.2. Products
- 12.1.2.3. Company Financials
- 12.1.2.4. SWOT Analysis
- 12.1.3 ADAMA Agricultural Solution Ltd
- 12.1.3.1. Company Overview
- 12.1.3.2. Products
- 12.1.3.3. Company Financials
- 12.1.3.4. SWOT Analysis
- 12.1.4 TriEst Ag Group Inc
- 12.1.4.1. Company Overview
- 12.1.4.2. Products
- 12.1.4.3. Company Financials
- 12.1.4.4. SWOT Analysis
- 12.1.5 Trical Inc
- 12.1.5.1. Company Overview
- 12.1.5.2. Products
- 12.1.5.3. Company Financials
- 12.1.5.4. SWOT Analysis
- 12.1.6 Fumigation Services
- 12.1.6.1. Company Overview
- 12.1.6.2. Products
- 12.1.6.3. Company Financials
- 12.1.6.4. SWOT Analysis
- 12.1.7 Ikeda Kogyo Co Ltd
- 12.1.7.1. Company Overview
- 12.1.7.2. Products
- 12.1.7.3. Company Financials
- 12.1.7.4. SWOT Analysis
- 12.1.8 Detia Degesch GmbH
- 12.1.8.1. Company Overview
- 12.1.8.2. Products
- 12.1.8.3. Company Financials
- 12.1.8.4. SWOT Analysis
- 12.1.9 DowDuPont
- 12.1.9.1. Company Overview
- 12.1.9.2. Products
- 12.1.9.3. Company Financials
- 12.1.9.4. SWOT Analysis
- 12.1.10 Lanxess
- 12.1.10.1. Company Overview
- 12.1.10.2. Products
- 12.1.10.3. Company Financials
- 12.1.10.4. SWOT Analysis
- 12.1.11 Isagro SpA
- 12.1.11.1. Company Overview
- 12.1.11.2. Products
- 12.1.11.3. Company Financials
- 12.1.11.4. SWOT Analysis
- 12.1.12 Syngenta AG
- 12.1.12.1. Company Overview
- 12.1.12.2. Products
- 12.1.12.3. Company Financials
- 12.1.12.4. SWOT Analysis
- 12.1.13 UPL Group
- 12.1.13.1. Company Overview
- 12.1.13.2. Products
- 12.1.13.3. Company Financials
- 12.1.13.4. SWOT Analysis
- 12.1.14 Industrial Fumigation Compan
- 12.1.14.1. Company Overview
- 12.1.14.2. Products
- 12.1.14.3. Company Financials
- 12.1.14.4. SWOT Analysis
- 12.1.15 Industrial Fumigation Company
- 12.1.15.1. Company Overview
- 12.1.15.2. Products
- 12.1.15.3. Company Financials
- 12.1.15.4. SWOT Analysis
- 12.1.16 Amvac Chemical Corporation
- 12.1.16.1. Company Overview
- 12.1.16.2. Products
- 12.1.16.3. Company Financials
- 12.1.16.4. SWOT Analysis
- 12.1.17 Reddick Fumigants LLC
- 12.1.17.1. Company Overview
- 12.1.17.2. Products
- 12.1.17.3. Company Financials
- 12.1.17.4. SWOT Analysis
- 12.1.18 Cytec Solvay Group
- 12.1.18.1. Company Overview
- 12.1.18.2. Products
- 12.1.18.3. Company Financials
- 12.1.18.4. SWOT Analysis
- 12.1.19 BASF SE
- 12.1.19.1. Company Overview
- 12.1.19.2. Products
- 12.1.19.3. Company Financials
- 12.1.19.4. SWOT Analysis
- 12.1.1 VFC
- 12.2. Market Entropy
- 12.2.1 Company's Key Areas Served
- 12.2.2 Recent Developments
- 12.3. Company Market Share Analysis 2025
- 12.3.1 Top 5 Companies Market Share Analysis
- 12.3.2 Top 3 Companies Market Share Analysis
- 12.4. List of Potential Customers
- 13. Research Methodology
List of Figures
- Figure 1: Global Agricultural Fumigants Industry Revenue Breakdown (Million, %) by Region 2025 & 2033
- Figure 2: North America Agricultural Fumigants Industry Revenue (Million), by Production Analysis 2025 & 2033
- Figure 3: North America Agricultural Fumigants Industry Revenue Share (%), by Production Analysis 2025 & 2033
- Figure 4: North America Agricultural Fumigants Industry Revenue (Million), by Consumption Analysis 2025 & 2033
- Figure 5: North America Agricultural Fumigants Industry Revenue Share (%), by Consumption Analysis 2025 & 2033
- Figure 6: North America Agricultural Fumigants Industry Revenue (Million), by Import Market Analysis (Value & Volume) 2025 & 2033
- Figure 7: North America Agricultural Fumigants Industry Revenue Share (%), by Import Market Analysis (Value & Volume) 2025 & 2033
- Figure 8: North America Agricultural Fumigants Industry Revenue (Million), by Export Market Analysis (Value & Volume) 2025 & 2033
- Figure 9: North America Agricultural Fumigants Industry Revenue Share (%), by Export Market Analysis (Value & Volume) 2025 & 2033
- Figure 10: North America Agricultural Fumigants Industry Revenue (Million), by Price Trend Analysis 2025 & 2033
- Figure 11: North America Agricultural Fumigants Industry Revenue Share (%), by Price Trend Analysis 2025 & 2033
- Figure 12: North America Agricultural Fumigants Industry Revenue (Million), by Country 2025 & 2033
- Figure 13: North America Agricultural Fumigants Industry Revenue Share (%), by Country 2025 & 2033
- Figure 14: South America Agricultural Fumigants Industry Revenue (Million), by Production Analysis 2025 & 2033
- Figure 15: South America Agricultural Fumigants Industry Revenue Share (%), by Production Analysis 2025 & 2033
- Figure 16: South America Agricultural Fumigants Industry Revenue (Million), by Consumption Analysis 2025 & 2033
- Figure 17: South America Agricultural Fumigants Industry Revenue Share (%), by Consumption Analysis 2025 & 2033
- Figure 18: South America Agricultural Fumigants Industry Revenue (Million), by Import Market Analysis (Value & Volume) 2025 & 2033
- Figure 19: South America Agricultural Fumigants Industry Revenue Share (%), by Import Market Analysis (Value & Volume) 2025 & 2033
- Figure 20: South America Agricultural Fumigants Industry Revenue (Million), by Export Market Analysis (Value & Volume) 2025 & 2033
- Figure 21: South America Agricultural Fumigants Industry Revenue Share (%), by Export Market Analysis (Value & Volume) 2025 & 2033
- Figure 22: South America Agricultural Fumigants Industry Revenue (Million), by Price Trend Analysis 2025 & 2033
- Figure 23: South America Agricultural Fumigants Industry Revenue Share (%), by Price Trend Analysis 2025 & 2033
- Figure 24: South America Agricultural Fumigants Industry Revenue (Million), by Country 2025 & 2033
- Figure 25: South America Agricultural Fumigants Industry Revenue Share (%), by Country 2025 & 2033
- Figure 26: Europe Agricultural Fumigants Industry Revenue (Million), by Production Analysis 2025 & 2033
- Figure 27: Europe Agricultural Fumigants Industry Revenue Share (%), by Production Analysis 2025 & 2033
- Figure 28: Europe Agricultural Fumigants Industry Revenue (Million), by Consumption Analysis 2025 & 2033
- Figure 29: Europe Agricultural Fumigants Industry Revenue Share (%), by Consumption Analysis 2025 & 2033
- Figure 30: Europe Agricultural Fumigants Industry Revenue (Million), by Import Market Analysis (Value & Volume) 2025 & 2033
- Figure 31: Europe Agricultural Fumigants Industry Revenue Share (%), by Import Market Analysis (Value & Volume) 2025 & 2033
- Figure 32: Europe Agricultural Fumigants Industry Revenue (Million), by Export Market Analysis (Value & Volume) 2025 & 2033
- Figure 33: Europe Agricultural Fumigants Industry Revenue Share (%), by Export Market Analysis (Value & Volume) 2025 & 2033
- Figure 34: Europe Agricultural Fumigants Industry Revenue (Million), by Price Trend Analysis 2025 & 2033
- Figure 35: Europe Agricultural Fumigants Industry Revenue Share (%), by Price Trend Analysis 2025 & 2033
- Figure 36: Europe Agricultural Fumigants Industry Revenue (Million), by Country 2025 & 2033
- Figure 37: Europe Agricultural Fumigants Industry Revenue Share (%), by Country 2025 & 2033
- Figure 38: Middle East & Africa Agricultural Fumigants Industry Revenue (Million), by Production Analysis 2025 & 2033
- Figure 39: Middle East & Africa Agricultural Fumigants Industry Revenue Share (%), by Production Analysis 2025 & 2033
- Figure 40: Middle East & Africa Agricultural Fumigants Industry Revenue (Million), by Consumption Analysis 2025 & 2033
- Figure 41: Middle East & Africa Agricultural Fumigants Industry Revenue Share (%), by Consumption Analysis 2025 & 2033
- Figure 42: Middle East & Africa Agricultural Fumigants Industry Revenue (Million), by Import Market Analysis (Value & Volume) 2025 & 2033
- Figure 43: Middle East & Africa Agricultural Fumigants Industry Revenue Share (%), by Import Market Analysis (Value & Volume) 2025 & 2033
- Figure 44: Middle East & Africa Agricultural Fumigants Industry Revenue (Million), by Export Market Analysis (Value & Volume) 2025 & 2033
- Figure 45: Middle East & Africa Agricultural Fumigants Industry Revenue Share (%), by Export Market Analysis (Value & Volume) 2025 & 2033
- Figure 46: Middle East & Africa Agricultural Fumigants Industry Revenue (Million), by Price Trend Analysis 2025 & 2033
- Figure 47: Middle East & Africa Agricultural Fumigants Industry Revenue Share (%), by Price Trend Analysis 2025 & 2033
- Figure 48: Middle East & Africa Agricultural Fumigants Industry Revenue (Million), by Country 2025 & 2033
- Figure 49: Middle East & Africa Agricultural Fumigants Industry Revenue Share (%), by Country 2025 & 2033
- Figure 50: Asia Pacific Agricultural Fumigants Industry Revenue (Million), by Production Analysis 2025 & 2033
- Figure 51: Asia Pacific Agricultural Fumigants Industry Revenue Share (%), by Production Analysis 2025 & 2033
- Figure 52: Asia Pacific Agricultural Fumigants Industry Revenue (Million), by Consumption Analysis 2025 & 2033
- Figure 53: Asia Pacific Agricultural Fumigants Industry Revenue Share (%), by Consumption Analysis 2025 & 2033
- Figure 54: Asia Pacific Agricultural Fumigants Industry Revenue (Million), by Import Market Analysis (Value & Volume) 2025 & 2033
- Figure 55: Asia Pacific Agricultural Fumigants Industry Revenue Share (%), by Import Market Analysis (Value & Volume) 2025 & 2033
- Figure 56: Asia Pacific Agricultural Fumigants Industry Revenue (Million), by Export Market Analysis (Value & Volume) 2025 & 2033
- Figure 57: Asia Pacific Agricultural Fumigants Industry Revenue Share (%), by Export Market Analysis (Value & Volume) 2025 & 2033
- Figure 58: Asia Pacific Agricultural Fumigants Industry Revenue (Million), by Price Trend Analysis 2025 & 2033
- Figure 59: Asia Pacific Agricultural Fumigants Industry Revenue Share (%), by Price Trend Analysis 2025 & 2033
- Figure 60: Asia Pacific Agricultural Fumigants Industry Revenue (Million), by Country 2025 & 2033
- Figure 61: Asia Pacific Agricultural Fumigants Industry Revenue Share (%), by Country 2025 & 2033
List of Tables
- Table 1: Global Agricultural Fumigants Industry Revenue Million Forecast, by Production Analysis 2020 & 2033
- Table 2: Global Agricultural Fumigants Industry Revenue Million Forecast, by Consumption Analysis 2020 & 2033
- Table 3: Global Agricultural Fumigants Industry Revenue Million Forecast, by Import Market Analysis (Value & Volume) 2020 & 2033
- Table 4: Global Agricultural Fumigants Industry Revenue Million Forecast, by Export Market Analysis (Value & Volume) 2020 & 2033
- Table 5: Global Agricultural Fumigants Industry Revenue Million Forecast, by Price Trend Analysis 2020 & 2033
- Table 6: Global Agricultural Fumigants Industry Revenue Million Forecast, by Region 2020 & 2033
- Table 7: Global Agricultural Fumigants Industry Revenue Million Forecast, by Production Analysis 2020 & 2033
- Table 8: Global Agricultural Fumigants Industry Revenue Million Forecast, by Consumption Analysis 2020 & 2033
- Table 9: Global Agricultural Fumigants Industry Revenue Million Forecast, by Import Market Analysis (Value & Volume) 2020 & 2033
- Table 10: Global Agricultural Fumigants Industry Revenue Million Forecast, by Export Market Analysis (Value & Volume) 2020 & 2033
- Table 11: Global Agricultural Fumigants Industry Revenue Million Forecast, by Price Trend Analysis 2020 & 2033
- Table 12: Global Agricultural Fumigants Industry Revenue Million Forecast, by Country 2020 & 2033
- Table 13: United States Agricultural Fumigants Industry Revenue (Million) Forecast, by Application 2020 & 2033
- Table 14: Canada Agricultural Fumigants Industry Revenue (Million) Forecast, by Application 2020 & 2033
- Table 15: Mexico Agricultural Fumigants Industry Revenue (Million) Forecast, by Application 2020 & 2033
- Table 16: Global Agricultural Fumigants Industry Revenue Million Forecast, by Production Analysis 2020 & 2033
- Table 17: Global Agricultural Fumigants Industry Revenue Million Forecast, by Consumption Analysis 2020 & 2033
- Table 18: Global Agricultural Fumigants Industry Revenue Million Forecast, by Import Market Analysis (Value & Volume) 2020 & 2033
- Table 19: Global Agricultural Fumigants Industry Revenue Million Forecast, by Export Market Analysis (Value & Volume) 2020 & 2033
- Table 20: Global Agricultural Fumigants Industry Revenue Million Forecast, by Price Trend Analysis 2020 & 2033
- Table 21: Global Agricultural Fumigants Industry Revenue Million Forecast, by Country 2020 & 2033
- Table 22: Brazil Agricultural Fumigants Industry Revenue (Million) Forecast, by Application 2020 & 2033
- Table 23: Argentina Agricultural Fumigants Industry Revenue (Million) Forecast, by Application 2020 & 2033
- Table 24: Rest of South America Agricultural Fumigants Industry Revenue (Million) Forecast, by Application 2020 & 2033
- Table 25: Global Agricultural Fumigants Industry Revenue Million Forecast, by Production Analysis 2020 & 2033
- Table 26: Global Agricultural Fumigants Industry Revenue Million Forecast, by Consumption Analysis 2020 & 2033
- Table 27: Global Agricultural Fumigants Industry Revenue Million Forecast, by Import Market Analysis (Value & Volume) 2020 & 2033
- Table 28: Global Agricultural Fumigants Industry Revenue Million Forecast, by Export Market Analysis (Value & Volume) 2020 & 2033
- Table 29: Global Agricultural Fumigants Industry Revenue Million Forecast, by Price Trend Analysis 2020 & 2033
- Table 30: Global Agricultural Fumigants Industry Revenue Million Forecast, by Country 2020 & 2033
- Table 31: United Kingdom Agricultural Fumigants Industry Revenue (Million) Forecast, by Application 2020 & 2033
- Table 32: Germany Agricultural Fumigants Industry Revenue (Million) Forecast, by Application 2020 & 2033
- Table 33: France Agricultural Fumigants Industry Revenue (Million) Forecast, by Application 2020 & 2033
- Table 34: Italy Agricultural Fumigants Industry Revenue (Million) Forecast, by Application 2020 & 2033
- Table 35: Spain Agricultural Fumigants Industry Revenue (Million) Forecast, by Application 2020 & 2033
- Table 36: Russia Agricultural Fumigants Industry Revenue (Million) Forecast, by Application 2020 & 2033
- Table 37: Benelux Agricultural Fumigants Industry Revenue (Million) Forecast, by Application 2020 & 2033
- Table 38: Nordics Agricultural Fumigants Industry Revenue (Million) Forecast, by Application 2020 & 2033
- Table 39: Rest of Europe Agricultural Fumigants Industry Revenue (Million) Forecast, by Application 2020 & 2033
- Table 40: Global Agricultural Fumigants Industry Revenue Million Forecast, by Production Analysis 2020 & 2033
- Table 41: Global Agricultural Fumigants Industry Revenue Million Forecast, by Consumption Analysis 2020 & 2033
- Table 42: Global Agricultural Fumigants Industry Revenue Million Forecast, by Import Market Analysis (Value & Volume) 2020 & 2033
- Table 43: Global Agricultural Fumigants Industry Revenue Million Forecast, by Export Market Analysis (Value & Volume) 2020 & 2033
- Table 44: Global Agricultural Fumigants Industry Revenue Million Forecast, by Price Trend Analysis 2020 & 2033
- Table 45: Global Agricultural Fumigants Industry Revenue Million Forecast, by Country 2020 & 2033
- Table 46: Turkey Agricultural Fumigants Industry Revenue (Million) Forecast, by Application 2020 & 2033
- Table 47: Israel Agricultural Fumigants Industry Revenue (Million) Forecast, by Application 2020 & 2033
- Table 48: GCC Agricultural Fumigants Industry Revenue (Million) Forecast, by Application 2020 & 2033
- Table 49: North Africa Agricultural Fumigants Industry Revenue (Million) Forecast, by Application 2020 & 2033
- Table 50: South Africa Agricultural Fumigants Industry Revenue (Million) Forecast, by Application 2020 & 2033
- Table 51: Rest of Middle East & Africa Agricultural Fumigants Industry Revenue (Million) Forecast, by Application 2020 & 2033
- Table 52: Global Agricultural Fumigants Industry Revenue Million Forecast, by Production Analysis 2020 & 2033
- Table 53: Global Agricultural Fumigants Industry Revenue Million Forecast, by Consumption Analysis 2020 & 2033
- Table 54: Global Agricultural Fumigants Industry Revenue Million Forecast, by Import Market Analysis (Value & Volume) 2020 & 2033
- Table 55: Global Agricultural Fumigants Industry Revenue Million Forecast, by Export Market Analysis (Value & Volume) 2020 & 2033
- Table 56: Global Agricultural Fumigants Industry Revenue Million Forecast, by Price Trend Analysis 2020 & 2033
- Table 57: Global Agricultural Fumigants Industry Revenue Million Forecast, by Country 2020 & 2033
- Table 58: China Agricultural Fumigants Industry Revenue (Million) Forecast, by Application 2020 & 2033
- Table 59: India Agricultural Fumigants Industry Revenue (Million) Forecast, by Application 2020 & 2033
- Table 60: Japan Agricultural Fumigants Industry Revenue (Million) Forecast, by Application 2020 & 2033
- Table 61: South Korea Agricultural Fumigants Industry Revenue (Million) Forecast, by Application 2020 & 2033
- Table 62: ASEAN Agricultural Fumigants Industry Revenue (Million) Forecast, by Application 2020 & 2033
- Table 63: Oceania Agricultural Fumigants Industry Revenue (Million) Forecast, by Application 2020 & 2033
- Table 64: Rest of Asia Pacific Agricultural Fumigants Industry Revenue (Million) Forecast, by Application 2020 & 2033
Frequently Asked Questions
1. What is the projected Compound Annual Growth Rate (CAGR) of the Agricultural Fumigants Industry?
The projected CAGR is approximately 5.60%.
2. Which companies are prominent players in the Agricultural Fumigants Industry?
Key companies in the market include VFC, FMC Corporation, ADAMA Agricultural Solution Ltd, TriEst Ag Group Inc, Trical Inc, Fumigation Services, Ikeda Kogyo Co Ltd, Detia Degesch GmbH, DowDuPont, Lanxess, Isagro SpA, Syngenta AG, UPL Group, Industrial Fumigation Compan, Industrial Fumigation Company, Amvac Chemical Corporation, Reddick Fumigants LLC, Cytec Solvay Group, BASF SE.
3. What are the main segments of the Agricultural Fumigants Industry?
The market segments include Production Analysis, Consumption Analysis, Import Market Analysis (Value & Volume), Export Market Analysis (Value & Volume), Price Trend Analysis.
4. Can you provide details about the market size?
The market size is estimated to be USD 2.45 Million as of 2022.
5. What are some drivers contributing to market growth?
Low Availability of Skilled Labor; Technological Advancements.
6. What are the notable trends driving market growth?
Growing Agricultural Production.
7. Are there any restraints impacting market growth?
Increasing Farm Expenditure; Security Concerns in Modern Farming Machinery.
8. Can you provide examples of recent developments in the market?
N/A
9. What pricing options are available for accessing the report?
Pricing options include single-user, multi-user, and enterprise licenses priced at USD 4750, USD 5250, and USD 8750 respectively.
10. Is the market size provided in terms of value or volume?
The market size is provided in terms of value, measured in Million.
11. Are there any specific market keywords associated with the report?
Yes, the market keyword associated with the report is "Agricultural Fumigants Industry," which aids in identifying and referencing the specific market segment covered.
12. How do I determine which pricing option suits my needs best?
The pricing options vary based on user requirements and access needs. Individual users may opt for single-user licenses, while businesses requiring broader access may choose multi-user or enterprise licenses for cost-effective access to the report.
13. Are there any additional resources or data provided in the Agricultural Fumigants Industry report?
While the report offers comprehensive insights, it's advisable to review the specific contents or supplementary materials provided to ascertain if additional resources or data are available.
14. How can I stay updated on further developments or reports in the Agricultural Fumigants Industry?
To stay informed about further developments, trends, and reports in the Agricultural Fumigants Industry, consider subscribing to industry newsletters, following relevant companies and organizations, or regularly checking reputable industry news sources and publications.
Methodology
Step 1 - Identification of Relevant Samples Size from Population Database


Step 2 - Approaches for Defining Global Market Size (Value, Volume* & Price*)

Note*: In applicable scenarios
Step 3 - Data Sources
Primary Research
- Web Analytics
- Survey Reports
- Research Institute
- Latest Research Reports
- Opinion Leaders
Secondary Research
- Annual Reports
- White Paper
- Latest Press Release
- Industry Association
- Paid Database
- Investor Presentations

Step 4 - Data Triangulation
Involves using different sources of information in order to increase the validity of a study
These sources are likely to be stakeholders in a program - participants, other researchers, program staff, other community members, and so on.
Then we put all data in single framework & apply various statistical tools to find out the dynamic on the market.
During the analysis stage, feedback from the stakeholder groups would be compared to determine areas of agreement as well as areas of divergence