

Key Insights
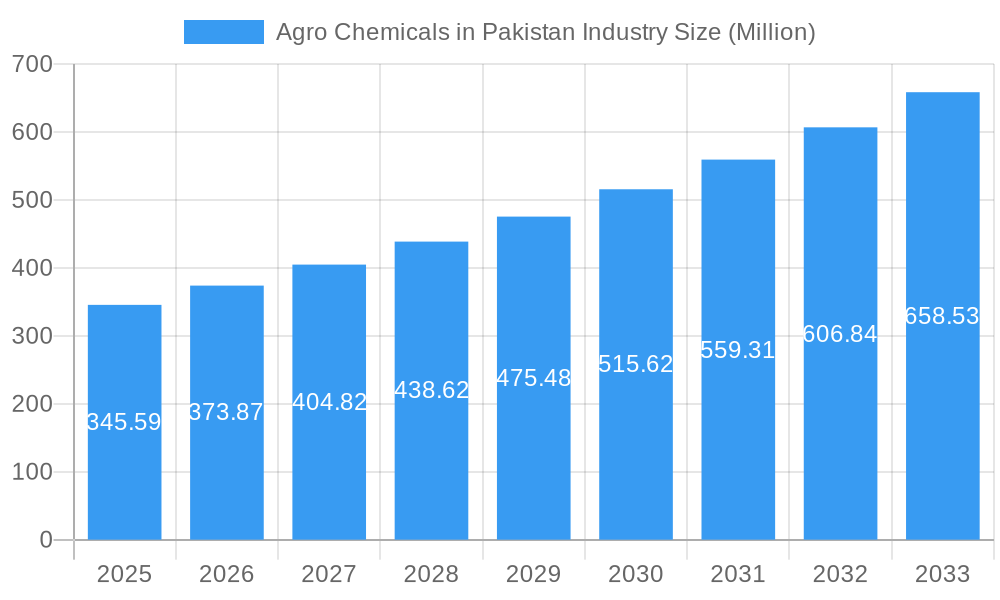
The Pakistani agrochemicals market, valued at $345.59 million in 2025, exhibits robust growth potential, projected to expand at a Compound Annual Growth Rate (CAGR) of 7.99% from 2025 to 2033. This expansion is driven by several key factors. Increasing agricultural production to meet the food demands of a growing population necessitates higher fertilizer and pesticide usage. Furthermore, a rising awareness of improved crop yields through the adoption of advanced agricultural techniques, including plant growth regulators and adjuvants, fuels market growth. Government initiatives promoting sustainable agricultural practices and investment in research and development further contribute to the sector's positive trajectory. While challenges exist, such as fluctuating commodity prices and potential environmental concerns related to pesticide use, the overall market outlook remains optimistic. The segmentation reveals that fertilizers likely dominate the market, followed by pesticides, with grains and cereals representing the largest application segment. Competition is intense, with both multinational corporations like Syngenta and BASF, and local players like Welcon Chemicals and Pakistan Agro Chemicals vying for market share.
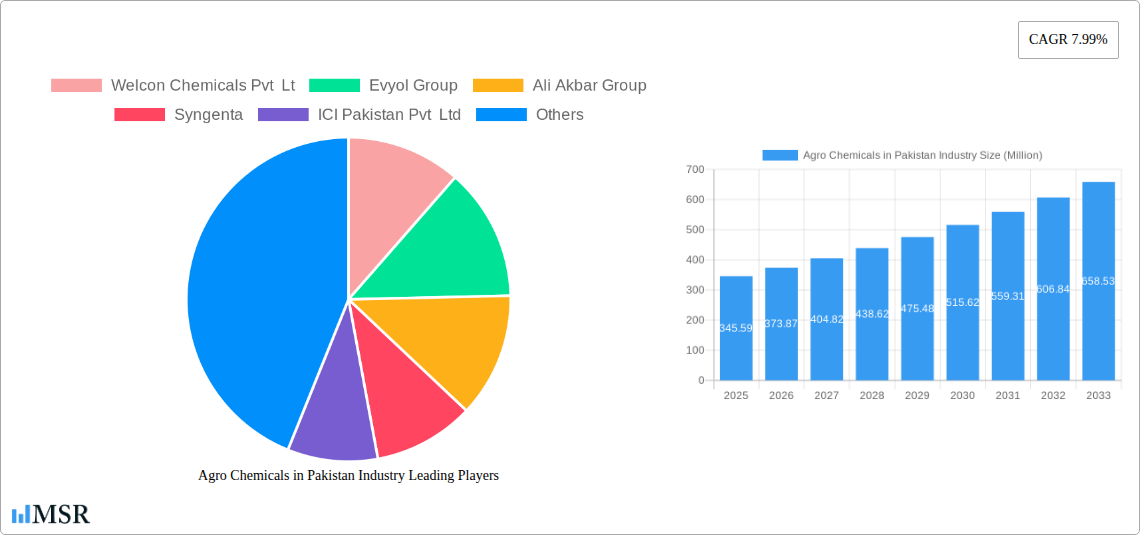
Agro Chemicals in Pakistan Industry Market Size (In Million)
The significant growth in the Pakistani agrochemicals market is expected to continue, driven by factors such as increasing agricultural land under cultivation, government support for modern farming techniques, and rising demand for high-yield crops. However, market players face challenges including supply chain disruptions, price volatility of raw materials, and the need to comply with stringent environmental regulations. The market's regional variations are likely influenced by factors such as irrigation access, soil fertility, and farming practices, with potentially higher concentration in fertile regions. Strategic partnerships, technological advancements in formulation and delivery, and a focus on sustainable and eco-friendly solutions will be crucial for companies aiming to capitalize on the market's growth potential.
Agro Chemicals in Pakistan Industry Company Market Share
Agro Chemicals in Pakistan Industry: A Comprehensive Market Report (2019-2033)
This in-depth report provides a comprehensive analysis of the Agro Chemicals industry in Pakistan, covering market dynamics, key segments, leading players, and future growth prospects. The study period spans from 2019 to 2033, with a base year of 2025 and a forecast period of 2025-2033. This report is essential for stakeholders including investors, manufacturers, distributors, and policymakers seeking to understand and navigate this dynamic market. The report utilizes extensive data analysis to provide actionable insights and strategic recommendations.
Agro Chemicals in Pakistan Industry Market Concentration & Dynamics
The Pakistani agrochemicals market exhibits a moderately concentrated structure, with a few multinational corporations holding significant market share alongside several domestic players. The market share of the top five players is estimated at xx%, indicating room for both consolidation and new entrants. Innovation is driven by both domestic research and development and the introduction of globally-advanced technologies. The regulatory framework, while evolving, presents certain challenges related to registration and approval processes. Substitute products, such as organic farming practices, are gradually gaining traction, but their current market penetration remains limited to xx%. End-user trends show increasing demand for high-yield, disease-resistant crops, driving the need for more effective and targeted agrochemicals. The M&A activity in the sector has been relatively moderate in recent years, with approximately xx deals recorded between 2019 and 2024.
- Market Concentration: Top 5 players hold xx% market share.
- M&A Activity: Approximately xx deals between 2019-2024.
- Regulatory Landscape: Evolving, with potential hurdles for new entrants.
- Substitute Products: Growing adoption of organic methods, but limited penetration (xx%).
Agro Chemicals in Pakistan Industry Industry Insights & Trends
The Pakistani agrochemicals market is experiencing robust growth, driven by factors such as rising agricultural output, increasing government support for the sector, and growing adoption of modern farming practices. The market size in 2024 was estimated at xx Million USD, and it is projected to reach xx Million USD by 2033, exhibiting a CAGR of xx% during the forecast period. Technological disruptions, including the adoption of precision agriculture technologies and the development of biopesticides, are reshaping the industry landscape. Evolving consumer behaviors, characterized by a growing awareness of environmental sustainability, are leading to greater demand for eco-friendly agrochemical products. These trends are further influenced by climate change, necessitating the development of climate-resilient crop solutions.
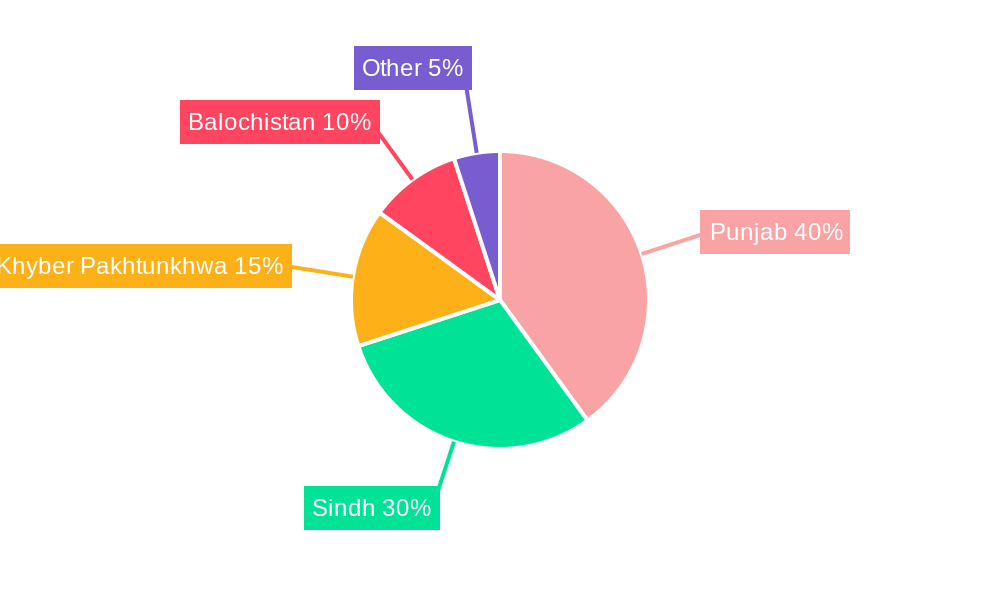
Key Markets & Segments Leading Agro Chemicals in Pakistan Industry
The Pakistani agrochemicals market is characterized by diverse segments, with fertilizers, pesticides, and plant growth regulators representing the major product types. The application segments show strong demand across Grains and Cereals, Pulses and Oilseeds, and Fruits and Vegetables. Punjab province holds the largest market share due to its extensive agricultural land and high crop production.
Drivers for Key Segments:
- Fertilizers: Increasing demand driven by rising food production requirements and government initiatives.
- Pesticides: High prevalence of crop pests and diseases necessitates significant pesticide usage.
- Grains & Cereals: Large cultivated area and high demand for food staples drive segment growth.
- Pulses & Oilseeds: Growing consumer demand for pulses and oilseeds fuels higher agricultural activity.
- Fruits & Vegetables: Expanding horticulture sector contributes to increased agrochemical demand.
The dominance of specific segments is further influenced by factors such as climate conditions, government policies, and the availability of irrigation resources.
Agro Chemicals in Pakistan Industry Product Developments
Recent years have witnessed significant product innovations in the Pakistani agrochemicals market. The introduction of novel insecticides, such as Sefina by BASF, showcases advancements in pest control. Similarly, the launch of HANARO (Bistrifluron 10% EC) highlights the growing adoption of biological control agents. These developments are driven by the need to enhance crop yields while minimizing environmental impacts and improving the efficacy of crop protection measures. Companies are increasingly focusing on developing products tailored to the specific needs of local crops and farming conditions.
Challenges in the Agro Chemicals in Pakistan Industry Market
The Pakistani agrochemicals market faces several challenges. Regulatory hurdles related to product registration and approval processes can delay market entry for new products. Supply chain disruptions, particularly those related to raw material sourcing and logistics, can impact the availability and affordability of agrochemicals. Intense competition among domestic and international players further complicates the market landscape, affecting pricing and profitability. Furthermore, the fluctuating prices of raw materials pose significant challenges to manufacturers. These factors collectively impact the overall market growth and stability.
Forces Driving Agro Chemicals in Pakistan Industry Growth
The growth of the Pakistani agrochemicals market is fueled by several key factors. Technological advancements, such as the development of precision agriculture techniques and the introduction of next-generation biopesticides, are boosting efficiency and productivity. Economic growth and rising disposable incomes contribute to increased agricultural investment and higher demand for higher-yielding crops. Government policies supporting agricultural development further enhance market expansion. These factors work synergistically to drive the industry's positive trajectory.
Challenges in the Agro Chemicals in Pakistan Industry Market
Long-term growth in the Pakistani agrochemicals market hinges on several crucial aspects. Continued investments in research and development, especially in biopesticides and sustainable solutions, are crucial. Strategic partnerships between local companies and multinational corporations will foster technology transfer and enhance innovation capabilities. Market expansion into new regions and diversification into new product segments will broaden the market reach.
Emerging Opportunities in Agro Chemicals in Pakistan Industry
The Pakistani agrochemicals market presents several promising opportunities. The growing demand for organic and bio-based products creates a niche market for environmentally friendly agrochemicals. Expanding into precision agriculture technologies offers efficient resource management solutions. Finally, addressing the need for climate-resilient crops through innovative solutions presents considerable potential. These opportunities highlight the need for diversification and sustainable practices within the industry.
Leading Players in the Agro Chemicals in Pakistan Industry Sector
- Welcon Chemicals Pvt Lt
- Evyol Group
- Ali Akbar Group
- Syngenta
- ICI Pakistan Pvt Ltd
- BASF SE
- FMC Corporation
- Pakistan Agro Chemicals Pvt Ltd
- Bayer Ag
Key Milestones in Agro Chemicals in Pakistan Industry Industry
- February 2023: Bayer's partnership with Kimitec signals a shift towards biological solutions and sustainable agriculture.
- February 2021: The launch of Sefina insecticide by BASF and Engro Fertilizers introduces a novel pest control solution to the market.
- January 2021: The introduction of HANARO (Bistrifluron 10% EC) highlights the increasing importance of biopesticides in managing crop pests. These milestones represent significant advancements in the Pakistani agrochemicals sector, highlighting the industry’s commitment to innovation and sustainability.
Strategic Outlook for Agro Chemicals in Pakistan Industry Market
The Pakistani agrochemicals market exhibits considerable growth potential, driven by a combination of factors including rising agricultural output, technological advancements, and supportive government policies. Companies adopting a proactive approach to innovation, sustainability, and market diversification will be best positioned to capitalize on this potential. A focus on environmentally friendly products and efficient resource management will be key differentiators in the long term. This necessitates strategic partnerships and investments in research and development to achieve this vision.
Agro Chemicals in Pakistan Industry Segmentation
- 1. Production Analysis
- 2. Consumption Analysis
- 3. Import Market Analysis (Value & Volume)
- 4. Export Market Analysis (Value & Volume)
- 5. Price Trend Analysis
Agro Chemicals in Pakistan Industry Segmentation By Geography
-
1. North America
- 1.1. United States
- 1.2. Canada
- 1.3. Mexico
-
2. South America
- 2.1. Brazil
- 2.2. Argentina
- 2.3. Rest of South America
-
3. Europe
- 3.1. United Kingdom
- 3.2. Germany
- 3.3. France
- 3.4. Italy
- 3.5. Spain
- 3.6. Russia
- 3.7. Benelux
- 3.8. Nordics
- 3.9. Rest of Europe
-
4. Middle East & Africa
- 4.1. Turkey
- 4.2. Israel
- 4.3. GCC
- 4.4. North Africa
- 4.5. South Africa
- 4.6. Rest of Middle East & Africa
-
5. Asia Pacific
- 5.1. China
- 5.2. India
- 5.3. Japan
- 5.4. South Korea
- 5.5. ASEAN
- 5.6. Oceania
- 5.7. Rest of Asia Pacific
Agro Chemicals in Pakistan Industry Regional Market Share
Geographic Coverage of Agro Chemicals in Pakistan Industry
Agro Chemicals in Pakistan Industry REPORT HIGHLIGHTS
| Aspects | Details |
|---|---|
| Study Period | 2020-2034 |
| Base Year | 2025 |
| Estimated Year | 2026 |
| Forecast Period | 2026-2034 |
| Historical Period | 2020-2025 |
| Growth Rate | CAGR of 7.99% from 2020-2034 |
| Segmentation |
|
Table of Contents
- 1. Introduction
- 1.1. Research Scope
- 1.2. Market Segmentation
- 1.3. Research Objective
- 1.4. Definitions and Assumptions
- 2. Executive Summary
- 2.1. Market Snapshot
- 3. Market Dynamics
- 3.1. Market Drivers
- 3.2. Market Restrains
- 3.3. Market Trends
- 3.4. Market Opportunities
- 4. Market Factor Analysis
- 4.1. Porters Five Forces
- 4.1.1. Bargaining Power of Suppliers
- 4.1.2. Bargaining Power of Buyers
- 4.1.3. Threat of New Entrants
- 4.1.4. Threat of Substitutes
- 4.1.5. Competitive Rivalry
- 4.2. PESTEL analysis
- 4.3. BCG Analysis
- 4.3.1. Stars (High Growth, High Market Share)
- 4.3.2. Cash Cows (Low Growth, High Market Share)
- 4.3.3. Question Mark (High Growth, Low Market Share)
- 4.3.4. Dogs (Low Growth, Low Market Share)
- 4.4. Ansoff Matrix Analysis
- 4.5. Supply Chain Analysis
- 4.6. Regulatory Landscape
- 4.7. Current Market Potential and Opportunity Assessment (TAM–SAM–SOM Framework)
- 4.8. MSR Analyst Note
- 4.1. Porters Five Forces
- 5. Market Analysis, Insights and Forecast 2021-2033
- 5.1. Market Analysis, Insights and Forecast - by Production Analysis
- 5.2. Market Analysis, Insights and Forecast - by Consumption Analysis
- 5.3. Market Analysis, Insights and Forecast - by Import Market Analysis (Value & Volume)
- 5.4. Market Analysis, Insights and Forecast - by Export Market Analysis (Value & Volume)
- 5.5. Market Analysis, Insights and Forecast - by Price Trend Analysis
- 5.6. Market Analysis, Insights and Forecast - by Region
- 5.6.1. North America
- 5.6.2. South America
- 5.6.3. Europe
- 5.6.4. Middle East & Africa
- 5.6.5. Asia Pacific
- 6. Global Agro Chemicals in Pakistan Industry Analysis, Insights and Forecast, 2021-2033
- 6.1. Market Analysis, Insights and Forecast - by Production Analysis
- 6.2. Market Analysis, Insights and Forecast - by Consumption Analysis
- 6.3. Market Analysis, Insights and Forecast - by Import Market Analysis (Value & Volume)
- 6.4. Market Analysis, Insights and Forecast - by Export Market Analysis (Value & Volume)
- 6.5. Market Analysis, Insights and Forecast - by Price Trend Analysis
- 7. North America Agro Chemicals in Pakistan Industry Analysis, Insights and Forecast, 2020-2032
- 7.1. Market Analysis, Insights and Forecast - by Production Analysis
- 7.2. Market Analysis, Insights and Forecast - by Consumption Analysis
- 7.3. Market Analysis, Insights and Forecast - by Import Market Analysis (Value & Volume)
- 7.4. Market Analysis, Insights and Forecast - by Export Market Analysis (Value & Volume)
- 7.5. Market Analysis, Insights and Forecast - by Price Trend Analysis
- 8. South America Agro Chemicals in Pakistan Industry Analysis, Insights and Forecast, 2020-2032
- 8.1. Market Analysis, Insights and Forecast - by Production Analysis
- 8.2. Market Analysis, Insights and Forecast - by Consumption Analysis
- 8.3. Market Analysis, Insights and Forecast - by Import Market Analysis (Value & Volume)
- 8.4. Market Analysis, Insights and Forecast - by Export Market Analysis (Value & Volume)
- 8.5. Market Analysis, Insights and Forecast - by Price Trend Analysis
- 9. Europe Agro Chemicals in Pakistan Industry Analysis, Insights and Forecast, 2020-2032
- 9.1. Market Analysis, Insights and Forecast - by Production Analysis
- 9.2. Market Analysis, Insights and Forecast - by Consumption Analysis
- 9.3. Market Analysis, Insights and Forecast - by Import Market Analysis (Value & Volume)
- 9.4. Market Analysis, Insights and Forecast - by Export Market Analysis (Value & Volume)
- 9.5. Market Analysis, Insights and Forecast - by Price Trend Analysis
- 10. Middle East & Africa Agro Chemicals in Pakistan Industry Analysis, Insights and Forecast, 2020-2032
- 10.1. Market Analysis, Insights and Forecast - by Production Analysis
- 10.2. Market Analysis, Insights and Forecast - by Consumption Analysis
- 10.3. Market Analysis, Insights and Forecast - by Import Market Analysis (Value & Volume)
- 10.4. Market Analysis, Insights and Forecast - by Export Market Analysis (Value & Volume)
- 10.5. Market Analysis, Insights and Forecast - by Price Trend Analysis
- 11. Asia Pacific Agro Chemicals in Pakistan Industry Analysis, Insights and Forecast, 2020-2032
- 11.1. Market Analysis, Insights and Forecast - by Production Analysis
- 11.2. Market Analysis, Insights and Forecast - by Consumption Analysis
- 11.3. Market Analysis, Insights and Forecast - by Import Market Analysis (Value & Volume)
- 11.4. Market Analysis, Insights and Forecast - by Export Market Analysis (Value & Volume)
- 11.5. Market Analysis, Insights and Forecast - by Price Trend Analysis
- 12. Competitive Analysis
- 12.1. Company Profiles
- 12.1.1 Welcon Chemicals Pvt Lt
- 12.1.1.1. Company Overview
- 12.1.1.2. Products
- 12.1.1.3. Company Financials
- 12.1.1.4. SWOT Analysis
- 12.1.2 Evyol Group
- 12.1.2.1. Company Overview
- 12.1.2.2. Products
- 12.1.2.3. Company Financials
- 12.1.2.4. SWOT Analysis
- 12.1.3 Ali Akbar Group
- 12.1.3.1. Company Overview
- 12.1.3.2. Products
- 12.1.3.3. Company Financials
- 12.1.3.4. SWOT Analysis
- 12.1.4 Syngenta
- 12.1.4.1. Company Overview
- 12.1.4.2. Products
- 12.1.4.3. Company Financials
- 12.1.4.4. SWOT Analysis
- 12.1.5 ICI Pakistan Pvt Ltd
- 12.1.5.1. Company Overview
- 12.1.5.2. Products
- 12.1.5.3. Company Financials
- 12.1.5.4. SWOT Analysis
- 12.1.6 BASF SE
- 12.1.6.1. Company Overview
- 12.1.6.2. Products
- 12.1.6.3. Company Financials
- 12.1.6.4. SWOT Analysis
- 12.1.7 FMC Corporation
- 12.1.7.1. Company Overview
- 12.1.7.2. Products
- 12.1.7.3. Company Financials
- 12.1.7.4. SWOT Analysis
- 12.1.8 Pakistan Agro Chemicals Pvt Ltd
- 12.1.8.1. Company Overview
- 12.1.8.2. Products
- 12.1.8.3. Company Financials
- 12.1.8.4. SWOT Analysis
- 12.1.9 Bayer Ag
- 12.1.9.1. Company Overview
- 12.1.9.2. Products
- 12.1.9.3. Company Financials
- 12.1.9.4. SWOT Analysis
- 12.1.1 Welcon Chemicals Pvt Lt
- 12.2. Market Entropy
- 12.2.1 Company's Key Areas Served
- 12.2.2 Recent Developments
- 12.3. Company Market Share Analysis 2025
- 12.3.1 Top 5 Companies Market Share Analysis
- 12.3.2 Top 3 Companies Market Share Analysis
- 12.4. List of Potential Customers
- 13. Research Methodology
List of Figures
- Figure 1: Global Agro Chemicals in Pakistan Industry Revenue Breakdown (Million, %) by Region 2025 & 2033
- Figure 2: North America Agro Chemicals in Pakistan Industry Revenue (Million), by Production Analysis 2025 & 2033
- Figure 3: North America Agro Chemicals in Pakistan Industry Revenue Share (%), by Production Analysis 2025 & 2033
- Figure 4: North America Agro Chemicals in Pakistan Industry Revenue (Million), by Consumption Analysis 2025 & 2033
- Figure 5: North America Agro Chemicals in Pakistan Industry Revenue Share (%), by Consumption Analysis 2025 & 2033
- Figure 6: North America Agro Chemicals in Pakistan Industry Revenue (Million), by Import Market Analysis (Value & Volume) 2025 & 2033
- Figure 7: North America Agro Chemicals in Pakistan Industry Revenue Share (%), by Import Market Analysis (Value & Volume) 2025 & 2033
- Figure 8: North America Agro Chemicals in Pakistan Industry Revenue (Million), by Export Market Analysis (Value & Volume) 2025 & 2033
- Figure 9: North America Agro Chemicals in Pakistan Industry Revenue Share (%), by Export Market Analysis (Value & Volume) 2025 & 2033
- Figure 10: North America Agro Chemicals in Pakistan Industry Revenue (Million), by Price Trend Analysis 2025 & 2033
- Figure 11: North America Agro Chemicals in Pakistan Industry Revenue Share (%), by Price Trend Analysis 2025 & 2033
- Figure 12: North America Agro Chemicals in Pakistan Industry Revenue (Million), by Country 2025 & 2033
- Figure 13: North America Agro Chemicals in Pakistan Industry Revenue Share (%), by Country 2025 & 2033
- Figure 14: South America Agro Chemicals in Pakistan Industry Revenue (Million), by Production Analysis 2025 & 2033
- Figure 15: South America Agro Chemicals in Pakistan Industry Revenue Share (%), by Production Analysis 2025 & 2033
- Figure 16: South America Agro Chemicals in Pakistan Industry Revenue (Million), by Consumption Analysis 2025 & 2033
- Figure 17: South America Agro Chemicals in Pakistan Industry Revenue Share (%), by Consumption Analysis 2025 & 2033
- Figure 18: South America Agro Chemicals in Pakistan Industry Revenue (Million), by Import Market Analysis (Value & Volume) 2025 & 2033
- Figure 19: South America Agro Chemicals in Pakistan Industry Revenue Share (%), by Import Market Analysis (Value & Volume) 2025 & 2033
- Figure 20: South America Agro Chemicals in Pakistan Industry Revenue (Million), by Export Market Analysis (Value & Volume) 2025 & 2033
- Figure 21: South America Agro Chemicals in Pakistan Industry Revenue Share (%), by Export Market Analysis (Value & Volume) 2025 & 2033
- Figure 22: South America Agro Chemicals in Pakistan Industry Revenue (Million), by Price Trend Analysis 2025 & 2033
- Figure 23: South America Agro Chemicals in Pakistan Industry Revenue Share (%), by Price Trend Analysis 2025 & 2033
- Figure 24: South America Agro Chemicals in Pakistan Industry Revenue (Million), by Country 2025 & 2033
- Figure 25: South America Agro Chemicals in Pakistan Industry Revenue Share (%), by Country 2025 & 2033
- Figure 26: Europe Agro Chemicals in Pakistan Industry Revenue (Million), by Production Analysis 2025 & 2033
- Figure 27: Europe Agro Chemicals in Pakistan Industry Revenue Share (%), by Production Analysis 2025 & 2033
- Figure 28: Europe Agro Chemicals in Pakistan Industry Revenue (Million), by Consumption Analysis 2025 & 2033
- Figure 29: Europe Agro Chemicals in Pakistan Industry Revenue Share (%), by Consumption Analysis 2025 & 2033
- Figure 30: Europe Agro Chemicals in Pakistan Industry Revenue (Million), by Import Market Analysis (Value & Volume) 2025 & 2033
- Figure 31: Europe Agro Chemicals in Pakistan Industry Revenue Share (%), by Import Market Analysis (Value & Volume) 2025 & 2033
- Figure 32: Europe Agro Chemicals in Pakistan Industry Revenue (Million), by Export Market Analysis (Value & Volume) 2025 & 2033
- Figure 33: Europe Agro Chemicals in Pakistan Industry Revenue Share (%), by Export Market Analysis (Value & Volume) 2025 & 2033
- Figure 34: Europe Agro Chemicals in Pakistan Industry Revenue (Million), by Price Trend Analysis 2025 & 2033
- Figure 35: Europe Agro Chemicals in Pakistan Industry Revenue Share (%), by Price Trend Analysis 2025 & 2033
- Figure 36: Europe Agro Chemicals in Pakistan Industry Revenue (Million), by Country 2025 & 2033
- Figure 37: Europe Agro Chemicals in Pakistan Industry Revenue Share (%), by Country 2025 & 2033
- Figure 38: Middle East & Africa Agro Chemicals in Pakistan Industry Revenue (Million), by Production Analysis 2025 & 2033
- Figure 39: Middle East & Africa Agro Chemicals in Pakistan Industry Revenue Share (%), by Production Analysis 2025 & 2033
- Figure 40: Middle East & Africa Agro Chemicals in Pakistan Industry Revenue (Million), by Consumption Analysis 2025 & 2033
- Figure 41: Middle East & Africa Agro Chemicals in Pakistan Industry Revenue Share (%), by Consumption Analysis 2025 & 2033
- Figure 42: Middle East & Africa Agro Chemicals in Pakistan Industry Revenue (Million), by Import Market Analysis (Value & Volume) 2025 & 2033
- Figure 43: Middle East & Africa Agro Chemicals in Pakistan Industry Revenue Share (%), by Import Market Analysis (Value & Volume) 2025 & 2033
- Figure 44: Middle East & Africa Agro Chemicals in Pakistan Industry Revenue (Million), by Export Market Analysis (Value & Volume) 2025 & 2033
- Figure 45: Middle East & Africa Agro Chemicals in Pakistan Industry Revenue Share (%), by Export Market Analysis (Value & Volume) 2025 & 2033
- Figure 46: Middle East & Africa Agro Chemicals in Pakistan Industry Revenue (Million), by Price Trend Analysis 2025 & 2033
- Figure 47: Middle East & Africa Agro Chemicals in Pakistan Industry Revenue Share (%), by Price Trend Analysis 2025 & 2033
- Figure 48: Middle East & Africa Agro Chemicals in Pakistan Industry Revenue (Million), by Country 2025 & 2033
- Figure 49: Middle East & Africa Agro Chemicals in Pakistan Industry Revenue Share (%), by Country 2025 & 2033
- Figure 50: Asia Pacific Agro Chemicals in Pakistan Industry Revenue (Million), by Production Analysis 2025 & 2033
- Figure 51: Asia Pacific Agro Chemicals in Pakistan Industry Revenue Share (%), by Production Analysis 2025 & 2033
- Figure 52: Asia Pacific Agro Chemicals in Pakistan Industry Revenue (Million), by Consumption Analysis 2025 & 2033
- Figure 53: Asia Pacific Agro Chemicals in Pakistan Industry Revenue Share (%), by Consumption Analysis 2025 & 2033
- Figure 54: Asia Pacific Agro Chemicals in Pakistan Industry Revenue (Million), by Import Market Analysis (Value & Volume) 2025 & 2033
- Figure 55: Asia Pacific Agro Chemicals in Pakistan Industry Revenue Share (%), by Import Market Analysis (Value & Volume) 2025 & 2033
- Figure 56: Asia Pacific Agro Chemicals in Pakistan Industry Revenue (Million), by Export Market Analysis (Value & Volume) 2025 & 2033
- Figure 57: Asia Pacific Agro Chemicals in Pakistan Industry Revenue Share (%), by Export Market Analysis (Value & Volume) 2025 & 2033
- Figure 58: Asia Pacific Agro Chemicals in Pakistan Industry Revenue (Million), by Price Trend Analysis 2025 & 2033
- Figure 59: Asia Pacific Agro Chemicals in Pakistan Industry Revenue Share (%), by Price Trend Analysis 2025 & 2033
- Figure 60: Asia Pacific Agro Chemicals in Pakistan Industry Revenue (Million), by Country 2025 & 2033
- Figure 61: Asia Pacific Agro Chemicals in Pakistan Industry Revenue Share (%), by Country 2025 & 2033
List of Tables
- Table 1: Global Agro Chemicals in Pakistan Industry Revenue Million Forecast, by Production Analysis 2020 & 2033
- Table 2: Global Agro Chemicals in Pakistan Industry Revenue Million Forecast, by Consumption Analysis 2020 & 2033
- Table 3: Global Agro Chemicals in Pakistan Industry Revenue Million Forecast, by Import Market Analysis (Value & Volume) 2020 & 2033
- Table 4: Global Agro Chemicals in Pakistan Industry Revenue Million Forecast, by Export Market Analysis (Value & Volume) 2020 & 2033
- Table 5: Global Agro Chemicals in Pakistan Industry Revenue Million Forecast, by Price Trend Analysis 2020 & 2033
- Table 6: Global Agro Chemicals in Pakistan Industry Revenue Million Forecast, by Region 2020 & 2033
- Table 7: Global Agro Chemicals in Pakistan Industry Revenue Million Forecast, by Production Analysis 2020 & 2033
- Table 8: Global Agro Chemicals in Pakistan Industry Revenue Million Forecast, by Consumption Analysis 2020 & 2033
- Table 9: Global Agro Chemicals in Pakistan Industry Revenue Million Forecast, by Import Market Analysis (Value & Volume) 2020 & 2033
- Table 10: Global Agro Chemicals in Pakistan Industry Revenue Million Forecast, by Export Market Analysis (Value & Volume) 2020 & 2033
- Table 11: Global Agro Chemicals in Pakistan Industry Revenue Million Forecast, by Price Trend Analysis 2020 & 2033
- Table 12: Global Agro Chemicals in Pakistan Industry Revenue Million Forecast, by Country 2020 & 2033
- Table 13: United States Agro Chemicals in Pakistan Industry Revenue (Million) Forecast, by Application 2020 & 2033
- Table 14: Canada Agro Chemicals in Pakistan Industry Revenue (Million) Forecast, by Application 2020 & 2033
- Table 15: Mexico Agro Chemicals in Pakistan Industry Revenue (Million) Forecast, by Application 2020 & 2033
- Table 16: Global Agro Chemicals in Pakistan Industry Revenue Million Forecast, by Production Analysis 2020 & 2033
- Table 17: Global Agro Chemicals in Pakistan Industry Revenue Million Forecast, by Consumption Analysis 2020 & 2033
- Table 18: Global Agro Chemicals in Pakistan Industry Revenue Million Forecast, by Import Market Analysis (Value & Volume) 2020 & 2033
- Table 19: Global Agro Chemicals in Pakistan Industry Revenue Million Forecast, by Export Market Analysis (Value & Volume) 2020 & 2033
- Table 20: Global Agro Chemicals in Pakistan Industry Revenue Million Forecast, by Price Trend Analysis 2020 & 2033
- Table 21: Global Agro Chemicals in Pakistan Industry Revenue Million Forecast, by Country 2020 & 2033
- Table 22: Brazil Agro Chemicals in Pakistan Industry Revenue (Million) Forecast, by Application 2020 & 2033
- Table 23: Argentina Agro Chemicals in Pakistan Industry Revenue (Million) Forecast, by Application 2020 & 2033
- Table 24: Rest of South America Agro Chemicals in Pakistan Industry Revenue (Million) Forecast, by Application 2020 & 2033
- Table 25: Global Agro Chemicals in Pakistan Industry Revenue Million Forecast, by Production Analysis 2020 & 2033
- Table 26: Global Agro Chemicals in Pakistan Industry Revenue Million Forecast, by Consumption Analysis 2020 & 2033
- Table 27: Global Agro Chemicals in Pakistan Industry Revenue Million Forecast, by Import Market Analysis (Value & Volume) 2020 & 2033
- Table 28: Global Agro Chemicals in Pakistan Industry Revenue Million Forecast, by Export Market Analysis (Value & Volume) 2020 & 2033
- Table 29: Global Agro Chemicals in Pakistan Industry Revenue Million Forecast, by Price Trend Analysis 2020 & 2033
- Table 30: Global Agro Chemicals in Pakistan Industry Revenue Million Forecast, by Country 2020 & 2033
- Table 31: United Kingdom Agro Chemicals in Pakistan Industry Revenue (Million) Forecast, by Application 2020 & 2033
- Table 32: Germany Agro Chemicals in Pakistan Industry Revenue (Million) Forecast, by Application 2020 & 2033
- Table 33: France Agro Chemicals in Pakistan Industry Revenue (Million) Forecast, by Application 2020 & 2033
- Table 34: Italy Agro Chemicals in Pakistan Industry Revenue (Million) Forecast, by Application 2020 & 2033
- Table 35: Spain Agro Chemicals in Pakistan Industry Revenue (Million) Forecast, by Application 2020 & 2033
- Table 36: Russia Agro Chemicals in Pakistan Industry Revenue (Million) Forecast, by Application 2020 & 2033
- Table 37: Benelux Agro Chemicals in Pakistan Industry Revenue (Million) Forecast, by Application 2020 & 2033
- Table 38: Nordics Agro Chemicals in Pakistan Industry Revenue (Million) Forecast, by Application 2020 & 2033
- Table 39: Rest of Europe Agro Chemicals in Pakistan Industry Revenue (Million) Forecast, by Application 2020 & 2033
- Table 40: Global Agro Chemicals in Pakistan Industry Revenue Million Forecast, by Production Analysis 2020 & 2033
- Table 41: Global Agro Chemicals in Pakistan Industry Revenue Million Forecast, by Consumption Analysis 2020 & 2033
- Table 42: Global Agro Chemicals in Pakistan Industry Revenue Million Forecast, by Import Market Analysis (Value & Volume) 2020 & 2033
- Table 43: Global Agro Chemicals in Pakistan Industry Revenue Million Forecast, by Export Market Analysis (Value & Volume) 2020 & 2033
- Table 44: Global Agro Chemicals in Pakistan Industry Revenue Million Forecast, by Price Trend Analysis 2020 & 2033
- Table 45: Global Agro Chemicals in Pakistan Industry Revenue Million Forecast, by Country 2020 & 2033
- Table 46: Turkey Agro Chemicals in Pakistan Industry Revenue (Million) Forecast, by Application 2020 & 2033
- Table 47: Israel Agro Chemicals in Pakistan Industry Revenue (Million) Forecast, by Application 2020 & 2033
- Table 48: GCC Agro Chemicals in Pakistan Industry Revenue (Million) Forecast, by Application 2020 & 2033
- Table 49: North Africa Agro Chemicals in Pakistan Industry Revenue (Million) Forecast, by Application 2020 & 2033
- Table 50: South Africa Agro Chemicals in Pakistan Industry Revenue (Million) Forecast, by Application 2020 & 2033
- Table 51: Rest of Middle East & Africa Agro Chemicals in Pakistan Industry Revenue (Million) Forecast, by Application 2020 & 2033
- Table 52: Global Agro Chemicals in Pakistan Industry Revenue Million Forecast, by Production Analysis 2020 & 2033
- Table 53: Global Agro Chemicals in Pakistan Industry Revenue Million Forecast, by Consumption Analysis 2020 & 2033
- Table 54: Global Agro Chemicals in Pakistan Industry Revenue Million Forecast, by Import Market Analysis (Value & Volume) 2020 & 2033
- Table 55: Global Agro Chemicals in Pakistan Industry Revenue Million Forecast, by Export Market Analysis (Value & Volume) 2020 & 2033
- Table 56: Global Agro Chemicals in Pakistan Industry Revenue Million Forecast, by Price Trend Analysis 2020 & 2033
- Table 57: Global Agro Chemicals in Pakistan Industry Revenue Million Forecast, by Country 2020 & 2033
- Table 58: China Agro Chemicals in Pakistan Industry Revenue (Million) Forecast, by Application 2020 & 2033
- Table 59: India Agro Chemicals in Pakistan Industry Revenue (Million) Forecast, by Application 2020 & 2033
- Table 60: Japan Agro Chemicals in Pakistan Industry Revenue (Million) Forecast, by Application 2020 & 2033
- Table 61: South Korea Agro Chemicals in Pakistan Industry Revenue (Million) Forecast, by Application 2020 & 2033
- Table 62: ASEAN Agro Chemicals in Pakistan Industry Revenue (Million) Forecast, by Application 2020 & 2033
- Table 63: Oceania Agro Chemicals in Pakistan Industry Revenue (Million) Forecast, by Application 2020 & 2033
- Table 64: Rest of Asia Pacific Agro Chemicals in Pakistan Industry Revenue (Million) Forecast, by Application 2020 & 2033
Frequently Asked Questions
1. What is the projected Compound Annual Growth Rate (CAGR) of the Agro Chemicals in Pakistan Industry?
The projected CAGR is approximately 7.99%.
2. Which companies are prominent players in the Agro Chemicals in Pakistan Industry?
Key companies in the market include Welcon Chemicals Pvt Lt, Evyol Group, Ali Akbar Group, Syngenta, ICI Pakistan Pvt Ltd, BASF SE, FMC Corporation, Pakistan Agro Chemicals Pvt Ltd, Bayer Ag.
3. What are the main segments of the Agro Chemicals in Pakistan Industry?
The market segments include Production Analysis, Consumption Analysis, Import Market Analysis (Value & Volume), Export Market Analysis (Value & Volume), Price Trend Analysis.
4. Can you provide details about the market size?
The market size is estimated to be USD 345.59 Million as of 2022.
5. What are some drivers contributing to market growth?
Increasing Berry Consumption for Health Benefits; Increasing Adoption of High-Technology Farm Practices; Growing Usage of Berries in the Food and Beverage Industries.
6. What are the notable trends driving market growth?
Need for Increased Land Productivity.
7. Are there any restraints impacting market growth?
High Production Cost Involved in Berry Production; Increasing Disease and Pest Infestations.
8. Can you provide examples of recent developments in the market?
February 2023: Bayer partnered with Kimitec to bring the next generation of biologicals to millions of growers worldwide. This includes crop protection and biostimulant products based on molecules derived from natural sources.
9. What pricing options are available for accessing the report?
Pricing options include single-user, multi-user, and enterprise licenses priced at USD 3800, USD 4500, and USD 5800 respectively.
10. Is the market size provided in terms of value or volume?
The market size is provided in terms of value, measured in Million.
11. Are there any specific market keywords associated with the report?
Yes, the market keyword associated with the report is "Agro Chemicals in Pakistan Industry," which aids in identifying and referencing the specific market segment covered.
12. How do I determine which pricing option suits my needs best?
The pricing options vary based on user requirements and access needs. Individual users may opt for single-user licenses, while businesses requiring broader access may choose multi-user or enterprise licenses for cost-effective access to the report.
13. Are there any additional resources or data provided in the Agro Chemicals in Pakistan Industry report?
While the report offers comprehensive insights, it's advisable to review the specific contents or supplementary materials provided to ascertain if additional resources or data are available.
14. How can I stay updated on further developments or reports in the Agro Chemicals in Pakistan Industry?
To stay informed about further developments, trends, and reports in the Agro Chemicals in Pakistan Industry, consider subscribing to industry newsletters, following relevant companies and organizations, or regularly checking reputable industry news sources and publications.
Methodology
Step 1 - Identification of Relevant Samples Size from Population Database


Step 2 - Approaches for Defining Global Market Size (Value, Volume* & Price*)

Note*: In applicable scenarios
Step 3 - Data Sources
Primary Research
- Web Analytics
- Survey Reports
- Research Institute
- Latest Research Reports
- Opinion Leaders
Secondary Research
- Annual Reports
- White Paper
- Latest Press Release
- Industry Association
- Paid Database
- Investor Presentations

Step 4 - Data Triangulation
Involves using different sources of information in order to increase the validity of a study
These sources are likely to be stakeholders in a program - participants, other researchers, program staff, other community members, and so on.
Then we put all data in single framework & apply various statistical tools to find out the dynamic on the market.
During the analysis stage, feedback from the stakeholder groups would be compared to determine areas of agreement as well as areas of divergence