

Key Insights
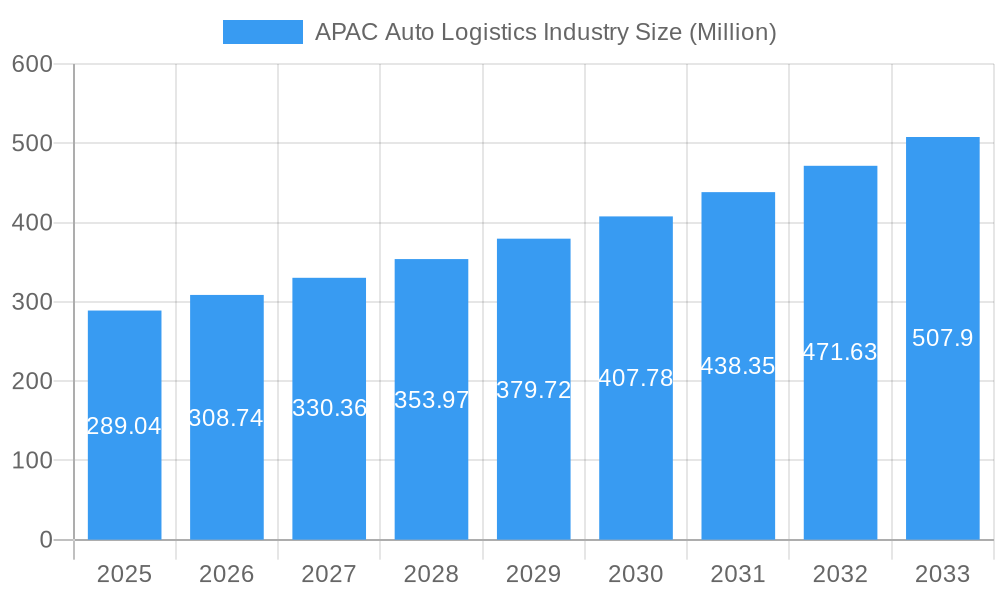
The Asia-Pacific (APAC) auto logistics market, valued at $289.04 million in 2025, is projected to experience robust growth, driven by a Compound Annual Growth Rate (CAGR) exceeding 6.50% from 2025 to 2033. This expansion is fueled by several key factors. Firstly, the burgeoning automotive manufacturing and sales within the region, particularly in China, India, and other emerging economies, significantly boosts demand for efficient transportation, warehousing, and distribution of finished vehicles and auto components. Secondly, the rise of e-commerce and a growing preference for direct-to-consumer vehicle sales models are reshaping the logistics landscape, requiring adaptable and technologically advanced solutions. The increasing adoption of sophisticated technologies like real-time tracking, route optimization software, and automated warehousing systems is further contributing to market growth. While challenges such as fluctuating fuel prices and infrastructure limitations in certain areas exist, the overall market outlook remains positive due to the strong underlying growth of the automotive sector in APAC.
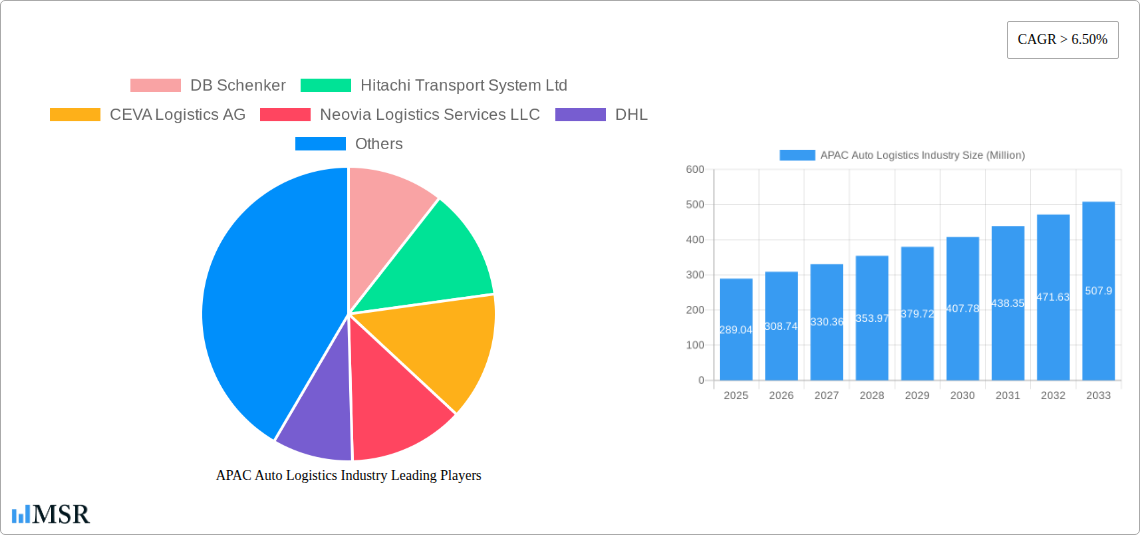
APAC Auto Logistics Industry Market Size (In Million)
Furthermore, the APAC auto logistics market is segmented by service type (transportation, warehousing, distribution, and inventory management), vehicle type (finished vehicles, auto components), and country. China and India, as major automotive manufacturing hubs, command significant market share. However, other countries like Japan, South Korea, and Indonesia are also experiencing substantial growth due to expanding domestic automotive industries and increasing cross-border trade. The competitive landscape is dominated by both global giants like DHL, UPS, and DB Schenker, and regional players who leverage their understanding of local market dynamics. The ongoing investments in infrastructure development and technological upgrades across the region will further enhance the efficiency and scalability of auto logistics operations, reinforcing the market's positive trajectory.
APAC Auto Logistics Industry Company Market Share
APAC Auto Logistics Industry Report: 2019-2033 Forecast
This comprehensive report provides an in-depth analysis of the Asia-Pacific (APAC) auto logistics industry, covering market size, growth drivers, key players, and future trends. With a study period spanning 2019-2033, a base year of 2025, and a forecast period of 2025-2033, this report is an invaluable resource for industry stakeholders, investors, and strategic decision-makers. The report utilizes data from the historical period (2019-2024) and offers actionable insights into the dynamic APAC automotive landscape. The market is segmented by service (Transportation, Warehousing, Distribution and Inventory Management, Other Services), vehicle type (Finished Vehicle, Auto Components, Other types), and country (China, India, Japan, South Korea, Indonesia, Philippines, Rest of Asia-Pacific). Key players analyzed include DB Schenker, Hitachi Transport System Ltd, CEVA Logistics AG, Neovia Logistics Services LLC, DHL, Yusen Logistics Co Ltd, GEODIS, Nippon Express Co Ltd, United Parcel Service Inc, XPO Logistics Inc, KUEHNE + NAGEL International AG, DSV, and Ryder System Inc. This list is not exhaustive. The report projects a market size of xx Million by 2033.
APAC Auto Logistics Industry Market Concentration & Dynamics
The APAC auto logistics market exhibits a moderately concentrated structure, with several large multinational players holding significant market share. However, a substantial number of regional and specialized logistics providers also contribute to the overall market dynamics. Market share analysis reveals that the top 5 players collectively account for approximately xx% of the total revenue, with DB Schenker, DHL, and KUEHNE + NAGEL among the leading firms. The competitive landscape is characterized by intense rivalry, with companies focusing on innovation, service diversification, and strategic partnerships to maintain their competitive edge.
- Innovation Ecosystems: Significant investments in technological advancements, particularly in areas like automation, telematics, and data analytics, are reshaping the industry. The development of sophisticated supply chain management systems and the integration of IoT technologies are prominent trends.
- Regulatory Frameworks: Government regulations concerning environmental protection, trade policies, and safety standards play a vital role in shaping the market dynamics. Fluctuations in these regulations can impact operational costs and efficiency.
- Substitute Products: The emergence of alternative transportation modes and innovative logistics solutions poses a moderate threat to traditional auto logistics services. Companies are adapting by integrating these options into their service portfolios.
- End-User Trends: The growing preference for just-in-time delivery systems and increased demand for efficient supply chain management are influencing the industry's strategic direction. The electric vehicle (EV) boom is a significant factor in this transformation.
- M&A Activities: The APAC auto logistics sector witnesses considerable M&A activity, with larger companies strategically acquiring smaller firms to expand their geographical reach and service capabilities. An estimated xx M&A deals were recorded in the last five years.
APAC Auto Logistics Industry Industry Insights & Trends
The APAC auto logistics market is experiencing robust growth, driven by several factors. The expanding automotive industry, particularly in emerging economies like India and Indonesia, fuels significant demand for efficient logistics solutions. The rising adoption of e-commerce and the growth of cross-border automotive trade further contribute to market expansion. Technological advancements, including the adoption of automation, AI, and blockchain technology, are improving efficiency and transparency across the supply chain. The market size was valued at xx Million in 2024 and is projected to reach xx Million by 2033, exhibiting a CAGR of xx%. Changes in consumer behavior, such as a preference for personalized delivery options, are also influencing the industry’s evolution.
Key Markets & Segments Leading APAC Auto Logistics Industry
China remains the dominant market within the APAC auto logistics sector, accounting for a significant portion of the overall market share. This is primarily attributed to its massive automotive production and consumption base. India and Japan also represent substantial markets, exhibiting strong growth potential driven by economic expansion and infrastructural improvements. Within the service segment, transportation accounts for the largest share, followed by warehousing and distribution. Finished vehicle logistics is the leading type of service, given the volume of automotive production in the region.
- China: Strong economic growth, well-established infrastructure, and a large automotive manufacturing base are key drivers.
- India: Rapid automotive industry expansion, coupled with supportive government policies, is accelerating market growth.
- Japan: A highly developed automotive industry and a focus on high-quality logistics services contribute to the market's strength.
- South Korea: Advanced manufacturing capabilities and a robust export market for vehicles are key growth factors.
- Indonesia, Philippines, Rest of Asia-Pacific: These markets exhibit strong growth potential driven by rising disposable incomes and increased automotive demand.
APAC Auto Logistics Industry Product Developments
Recent product innovations focus on enhancing efficiency, transparency, and security within the automotive logistics chain. This includes the implementation of real-time tracking systems, improved warehouse management systems (WMS), and the development of specialized transportation solutions for electric vehicles and sensitive auto components. These advancements are crucial for companies aiming to gain a competitive edge in the market by offering superior service quality and cost-effectiveness. Furthermore, the integration of blockchain technology for enhanced supply chain visibility and security is rapidly gaining traction.
Challenges in the APAC Auto Logistics Industry Market
The APAC auto logistics sector faces several challenges. Fluctuating fuel prices significantly impact operational costs. Supply chain disruptions caused by geopolitical instability or natural disasters can lead to delays and increased expenses. Intense competition among numerous players creates pressure on profit margins. Regulatory hurdles and varying infrastructure quality across different countries also pose considerable operational challenges, adding complexity to logistics operations.
Forces Driving APAC Auto Logistics Industry Growth
Technological advancements, specifically the implementation of automation and AI-powered solutions for route optimization and inventory management, are significant growth drivers. The rising demand for EVs is creating specialized logistical needs, further boosting market expansion. Government initiatives promoting infrastructure development and easing trade regulations contribute to a favorable business environment. Economic growth in several APAC countries significantly increases the demand for automotive transportation and logistics services.
Challenges in the APAC Auto Logistics Industry Market
Long-term growth hinges on the continuous adoption of innovative technologies and the formation of strategic alliances. Companies are increasingly focusing on expanding their service portfolios to offer comprehensive end-to-end logistics solutions. Exploring new markets within the APAC region and investing in sustainable logistics practices are also crucial for sustained growth. Addressing the issue of supply chain resilience through diversification and robust risk management strategies is pivotal for long-term success.
Emerging Opportunities in APAC Auto Logistics Industry
The growing demand for last-mile delivery services and the rise of e-commerce platforms present significant opportunities. The increasing adoption of electric and autonomous vehicles necessitates specialized logistics solutions, creating new market segments. Expanding into underserved markets within the APAC region and focusing on specialized logistics solutions for niche automotive segments, such as electric vehicle components or luxury cars, offers considerable potential for growth.
Leading Players in the APAC Auto Logistics Industry Sector
- DB Schenker
- Hitachi Transport System Ltd
- CEVA Logistics AG
- Neovia Logistics Services LLC
- DHL
- Yusen Logistics Co Ltd
- GEODIS
- Nippon Express Co Ltd
- United Parcel Service Inc
- XPO Logistics Inc
- KUEHNE + NAGEL International AG
- DSV
- Ryder System Inc
Key Milestones in APAC Auto Logistics Industry Industry
- December 2022: Tata Motors signed a contract with Everest Fleet Pvt. Ltd. for the delivery of 5,000 XPRES-T EVs, signifying growing demand for electric vehicle logistics.
- March 2023: Tata Motors received an order for 1000 XPRES-T EVs from OHM E Logistics Pvt. Ltd., further highlighting the increasing adoption of EVs and the associated logistical requirements. These orders demonstrate the significant shift towards electric vehicles and the resulting impact on the auto logistics sector.
Strategic Outlook for APAC Auto Logistics Industry Market
The APAC auto logistics market presents substantial growth potential driven by factors such as rising automotive production, e-commerce expansion, and technological advancements. Companies should prioritize strategic investments in technology, sustainable practices, and talent acquisition to thrive in this competitive landscape. Focusing on enhancing supply chain resilience, expanding into new markets, and offering innovative logistics solutions will be crucial for achieving sustained growth and capturing a larger market share in the years to come.
APAC Auto Logistics Industry Segmentation
-
1. Service
- 1.1. Transportation
- 1.2. Warehousing, Distribution and Inventory Management
- 1.3. Other Services
-
2. Type
- 2.1. Finished Vehicle
- 2.2. Auto Components
- 2.3. Other types
APAC Auto Logistics Industry Segmentation By Geography
-
1. North America
- 1.1. United States
- 1.2. Canada
- 1.3. Mexico
-
2. South America
- 2.1. Brazil
- 2.2. Argentina
- 2.3. Rest of South America
-
3. Europe
- 3.1. United Kingdom
- 3.2. Germany
- 3.3. France
- 3.4. Italy
- 3.5. Spain
- 3.6. Russia
- 3.7. Benelux
- 3.8. Nordics
- 3.9. Rest of Europe
-
4. Middle East & Africa
- 4.1. Turkey
- 4.2. Israel
- 4.3. GCC
- 4.4. North Africa
- 4.5. South Africa
- 4.6. Rest of Middle East & Africa
-
5. Asia Pacific
- 5.1. China
- 5.2. India
- 5.3. Japan
- 5.4. South Korea
- 5.5. ASEAN
- 5.6. Oceania
- 5.7. Rest of Asia Pacific
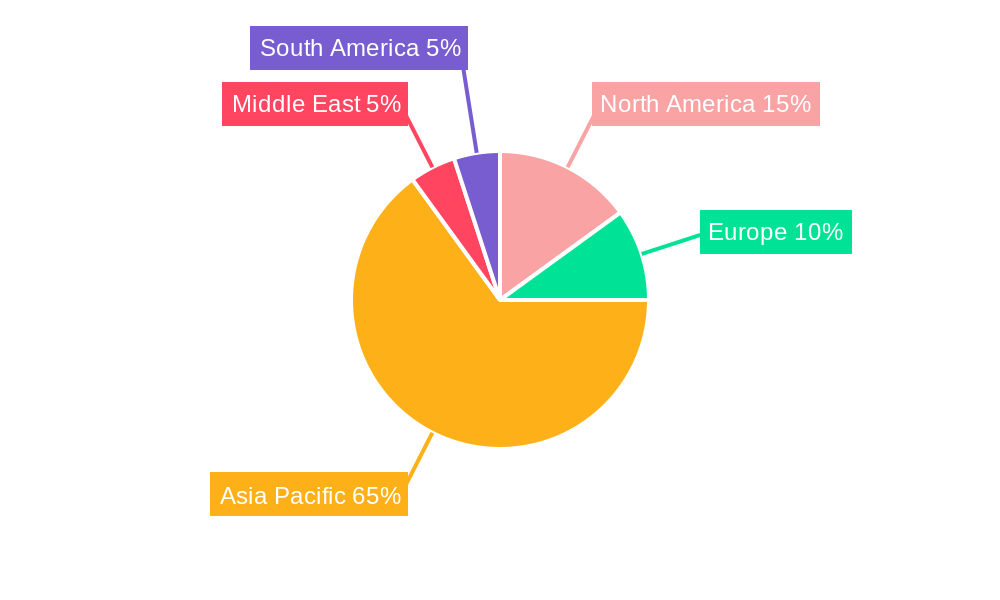
APAC Auto Logistics Industry Regional Market Share
Geographic Coverage of APAC Auto Logistics Industry
APAC Auto Logistics Industry REPORT HIGHLIGHTS
| Aspects | Details |
|---|---|
| Study Period | 2020-2034 |
| Base Year | 2025 |
| Estimated Year | 2026 |
| Forecast Period | 2026-2034 |
| Historical Period | 2020-2025 |
| Growth Rate | CAGR of > 6.50% from 2020-2034 |
| Segmentation |
|
Table of Contents
- 1. Introduction
- 1.1. Research Scope
- 1.2. Market Segmentation
- 1.3. Research Objective
- 1.4. Definitions and Assumptions
- 2. Executive Summary
- 2.1. Market Snapshot
- 3. Market Dynamics
- 3.1. Market Drivers
- 3.2. Market Restrains
- 3.3. Market Trends
- 3.4. Market Opportunities
- 4. Market Factor Analysis
- 4.1. Porters Five Forces
- 4.1.1. Bargaining Power of Suppliers
- 4.1.2. Bargaining Power of Buyers
- 4.1.3. Threat of New Entrants
- 4.1.4. Threat of Substitutes
- 4.1.5. Competitive Rivalry
- 4.2. PESTEL analysis
- 4.3. BCG Analysis
- 4.3.1. Stars (High Growth, High Market Share)
- 4.3.2. Cash Cows (Low Growth, High Market Share)
- 4.3.3. Question Mark (High Growth, Low Market Share)
- 4.3.4. Dogs (Low Growth, Low Market Share)
- 4.4. Ansoff Matrix Analysis
- 4.5. Supply Chain Analysis
- 4.6. Regulatory Landscape
- 4.7. Current Market Potential and Opportunity Assessment (TAM–SAM–SOM Framework)
- 4.8. MSR Analyst Note
- 4.1. Porters Five Forces
- 5. Market Analysis, Insights and Forecast 2021-2033
- 5.1. Market Analysis, Insights and Forecast - by Service
- 5.1.1. Transportation
- 5.1.2. Warehousing, Distribution and Inventory Management
- 5.1.3. Other Services
- 5.2. Market Analysis, Insights and Forecast - by Type
- 5.2.1. Finished Vehicle
- 5.2.2. Auto Components
- 5.2.3. Other types
- 5.3. Market Analysis, Insights and Forecast - by Region
- 5.3.1. North America
- 5.3.2. South America
- 5.3.3. Europe
- 5.3.4. Middle East & Africa
- 5.3.5. Asia Pacific
- 5.1. Market Analysis, Insights and Forecast - by Service
- 6. Global APAC Auto Logistics Industry Analysis, Insights and Forecast, 2021-2033
- 6.1. Market Analysis, Insights and Forecast - by Service
- 6.1.1. Transportation
- 6.1.2. Warehousing, Distribution and Inventory Management
- 6.1.3. Other Services
- 6.2. Market Analysis, Insights and Forecast - by Type
- 6.2.1. Finished Vehicle
- 6.2.2. Auto Components
- 6.2.3. Other types
- 6.1. Market Analysis, Insights and Forecast - by Service
- 7. North America APAC Auto Logistics Industry Analysis, Insights and Forecast, 2020-2032
- 7.1. Market Analysis, Insights and Forecast - by Service
- 7.1.1. Transportation
- 7.1.2. Warehousing, Distribution and Inventory Management
- 7.1.3. Other Services
- 7.2. Market Analysis, Insights and Forecast - by Type
- 7.2.1. Finished Vehicle
- 7.2.2. Auto Components
- 7.2.3. Other types
- 7.1. Market Analysis, Insights and Forecast - by Service
- 8. South America APAC Auto Logistics Industry Analysis, Insights and Forecast, 2020-2032
- 8.1. Market Analysis, Insights and Forecast - by Service
- 8.1.1. Transportation
- 8.1.2. Warehousing, Distribution and Inventory Management
- 8.1.3. Other Services
- 8.2. Market Analysis, Insights and Forecast - by Type
- 8.2.1. Finished Vehicle
- 8.2.2. Auto Components
- 8.2.3. Other types
- 8.1. Market Analysis, Insights and Forecast - by Service
- 9. Europe APAC Auto Logistics Industry Analysis, Insights and Forecast, 2020-2032
- 9.1. Market Analysis, Insights and Forecast - by Service
- 9.1.1. Transportation
- 9.1.2. Warehousing, Distribution and Inventory Management
- 9.1.3. Other Services
- 9.2. Market Analysis, Insights and Forecast - by Type
- 9.2.1. Finished Vehicle
- 9.2.2. Auto Components
- 9.2.3. Other types
- 9.1. Market Analysis, Insights and Forecast - by Service
- 10. Middle East & Africa APAC Auto Logistics Industry Analysis, Insights and Forecast, 2020-2032
- 10.1. Market Analysis, Insights and Forecast - by Service
- 10.1.1. Transportation
- 10.1.2. Warehousing, Distribution and Inventory Management
- 10.1.3. Other Services
- 10.2. Market Analysis, Insights and Forecast - by Type
- 10.2.1. Finished Vehicle
- 10.2.2. Auto Components
- 10.2.3. Other types
- 10.1. Market Analysis, Insights and Forecast - by Service
- 11. Asia Pacific APAC Auto Logistics Industry Analysis, Insights and Forecast, 2020-2032
- 11.1. Market Analysis, Insights and Forecast - by Service
- 11.1.1. Transportation
- 11.1.2. Warehousing, Distribution and Inventory Management
- 11.1.3. Other Services
- 11.2. Market Analysis, Insights and Forecast - by Type
- 11.2.1. Finished Vehicle
- 11.2.2. Auto Components
- 11.2.3. Other types
- 11.1. Market Analysis, Insights and Forecast - by Service
- 12. Competitive Analysis
- 12.1. Company Profiles
- 12.1.1 DB Schenker
- 12.1.1.1. Company Overview
- 12.1.1.2. Products
- 12.1.1.3. Company Financials
- 12.1.1.4. SWOT Analysis
- 12.1.2 Hitachi Transport System Ltd
- 12.1.2.1. Company Overview
- 12.1.2.2. Products
- 12.1.2.3. Company Financials
- 12.1.2.4. SWOT Analysis
- 12.1.3 CEVA Logistics AG
- 12.1.3.1. Company Overview
- 12.1.3.2. Products
- 12.1.3.3. Company Financials
- 12.1.3.4. SWOT Analysis
- 12.1.4 Neovia Logistics Services LLC
- 12.1.4.1. Company Overview
- 12.1.4.2. Products
- 12.1.4.3. Company Financials
- 12.1.4.4. SWOT Analysis
- 12.1.5 DHL
- 12.1.5.1. Company Overview
- 12.1.5.2. Products
- 12.1.5.3. Company Financials
- 12.1.5.4. SWOT Analysis
- 12.1.6 Yusen Logistics Co Ltd
- 12.1.6.1. Company Overview
- 12.1.6.2. Products
- 12.1.6.3. Company Financials
- 12.1.6.4. SWOT Analysis
- 12.1.7 GEODIS
- 12.1.7.1. Company Overview
- 12.1.7.2. Products
- 12.1.7.3. Company Financials
- 12.1.7.4. SWOT Analysis
- 12.1.8 Nippon Express Co Ltd
- 12.1.8.1. Company Overview
- 12.1.8.2. Products
- 12.1.8.3. Company Financials
- 12.1.8.4. SWOT Analysis
- 12.1.9 United Parcel Service Inc**List Not Exhaustive
- 12.1.9.1. Company Overview
- 12.1.9.2. Products
- 12.1.9.3. Company Financials
- 12.1.9.4. SWOT Analysis
- 12.1.10 XPO Logistics Inc
- 12.1.10.1. Company Overview
- 12.1.10.2. Products
- 12.1.10.3. Company Financials
- 12.1.10.4. SWOT Analysis
- 12.1.11 KUEHNE + NAGEL International AG
- 12.1.11.1. Company Overview
- 12.1.11.2. Products
- 12.1.11.3. Company Financials
- 12.1.11.4. SWOT Analysis
- 12.1.12 DSV
- 12.1.12.1. Company Overview
- 12.1.12.2. Products
- 12.1.12.3. Company Financials
- 12.1.12.4. SWOT Analysis
- 12.1.13 Ryder System Inc
- 12.1.13.1. Company Overview
- 12.1.13.2. Products
- 12.1.13.3. Company Financials
- 12.1.13.4. SWOT Analysis
- 12.1.1 DB Schenker
- 12.2. Market Entropy
- 12.2.1 Company's Key Areas Served
- 12.2.2 Recent Developments
- 12.3. Company Market Share Analysis 2025
- 12.3.1 Top 5 Companies Market Share Analysis
- 12.3.2 Top 3 Companies Market Share Analysis
- 12.4. List of Potential Customers
- 13. Research Methodology
List of Figures
- Figure 1: Global APAC Auto Logistics Industry Revenue Breakdown (Million, %) by Region 2025 & 2033
- Figure 2: North America APAC Auto Logistics Industry Revenue (Million), by Service 2025 & 2033
- Figure 3: North America APAC Auto Logistics Industry Revenue Share (%), by Service 2025 & 2033
- Figure 4: North America APAC Auto Logistics Industry Revenue (Million), by Type 2025 & 2033
- Figure 5: North America APAC Auto Logistics Industry Revenue Share (%), by Type 2025 & 2033
- Figure 6: North America APAC Auto Logistics Industry Revenue (Million), by Country 2025 & 2033
- Figure 7: North America APAC Auto Logistics Industry Revenue Share (%), by Country 2025 & 2033
- Figure 8: South America APAC Auto Logistics Industry Revenue (Million), by Service 2025 & 2033
- Figure 9: South America APAC Auto Logistics Industry Revenue Share (%), by Service 2025 & 2033
- Figure 10: South America APAC Auto Logistics Industry Revenue (Million), by Type 2025 & 2033
- Figure 11: South America APAC Auto Logistics Industry Revenue Share (%), by Type 2025 & 2033
- Figure 12: South America APAC Auto Logistics Industry Revenue (Million), by Country 2025 & 2033
- Figure 13: South America APAC Auto Logistics Industry Revenue Share (%), by Country 2025 & 2033
- Figure 14: Europe APAC Auto Logistics Industry Revenue (Million), by Service 2025 & 2033
- Figure 15: Europe APAC Auto Logistics Industry Revenue Share (%), by Service 2025 & 2033
- Figure 16: Europe APAC Auto Logistics Industry Revenue (Million), by Type 2025 & 2033
- Figure 17: Europe APAC Auto Logistics Industry Revenue Share (%), by Type 2025 & 2033
- Figure 18: Europe APAC Auto Logistics Industry Revenue (Million), by Country 2025 & 2033
- Figure 19: Europe APAC Auto Logistics Industry Revenue Share (%), by Country 2025 & 2033
- Figure 20: Middle East & Africa APAC Auto Logistics Industry Revenue (Million), by Service 2025 & 2033
- Figure 21: Middle East & Africa APAC Auto Logistics Industry Revenue Share (%), by Service 2025 & 2033
- Figure 22: Middle East & Africa APAC Auto Logistics Industry Revenue (Million), by Type 2025 & 2033
- Figure 23: Middle East & Africa APAC Auto Logistics Industry Revenue Share (%), by Type 2025 & 2033
- Figure 24: Middle East & Africa APAC Auto Logistics Industry Revenue (Million), by Country 2025 & 2033
- Figure 25: Middle East & Africa APAC Auto Logistics Industry Revenue Share (%), by Country 2025 & 2033
- Figure 26: Asia Pacific APAC Auto Logistics Industry Revenue (Million), by Service 2025 & 2033
- Figure 27: Asia Pacific APAC Auto Logistics Industry Revenue Share (%), by Service 2025 & 2033
- Figure 28: Asia Pacific APAC Auto Logistics Industry Revenue (Million), by Type 2025 & 2033
- Figure 29: Asia Pacific APAC Auto Logistics Industry Revenue Share (%), by Type 2025 & 2033
- Figure 30: Asia Pacific APAC Auto Logistics Industry Revenue (Million), by Country 2025 & 2033
- Figure 31: Asia Pacific APAC Auto Logistics Industry Revenue Share (%), by Country 2025 & 2033
List of Tables
- Table 1: Global APAC Auto Logistics Industry Revenue Million Forecast, by Service 2020 & 2033
- Table 2: Global APAC Auto Logistics Industry Revenue Million Forecast, by Type 2020 & 2033
- Table 3: Global APAC Auto Logistics Industry Revenue Million Forecast, by Region 2020 & 2033
- Table 4: Global APAC Auto Logistics Industry Revenue Million Forecast, by Service 2020 & 2033
- Table 5: Global APAC Auto Logistics Industry Revenue Million Forecast, by Type 2020 & 2033
- Table 6: Global APAC Auto Logistics Industry Revenue Million Forecast, by Country 2020 & 2033
- Table 7: United States APAC Auto Logistics Industry Revenue (Million) Forecast, by Application 2020 & 2033
- Table 8: Canada APAC Auto Logistics Industry Revenue (Million) Forecast, by Application 2020 & 2033
- Table 9: Mexico APAC Auto Logistics Industry Revenue (Million) Forecast, by Application 2020 & 2033
- Table 10: Global APAC Auto Logistics Industry Revenue Million Forecast, by Service 2020 & 2033
- Table 11: Global APAC Auto Logistics Industry Revenue Million Forecast, by Type 2020 & 2033
- Table 12: Global APAC Auto Logistics Industry Revenue Million Forecast, by Country 2020 & 2033
- Table 13: Brazil APAC Auto Logistics Industry Revenue (Million) Forecast, by Application 2020 & 2033
- Table 14: Argentina APAC Auto Logistics Industry Revenue (Million) Forecast, by Application 2020 & 2033
- Table 15: Rest of South America APAC Auto Logistics Industry Revenue (Million) Forecast, by Application 2020 & 2033
- Table 16: Global APAC Auto Logistics Industry Revenue Million Forecast, by Service 2020 & 2033
- Table 17: Global APAC Auto Logistics Industry Revenue Million Forecast, by Type 2020 & 2033
- Table 18: Global APAC Auto Logistics Industry Revenue Million Forecast, by Country 2020 & 2033
- Table 19: United Kingdom APAC Auto Logistics Industry Revenue (Million) Forecast, by Application 2020 & 2033
- Table 20: Germany APAC Auto Logistics Industry Revenue (Million) Forecast, by Application 2020 & 2033
- Table 21: France APAC Auto Logistics Industry Revenue (Million) Forecast, by Application 2020 & 2033
- Table 22: Italy APAC Auto Logistics Industry Revenue (Million) Forecast, by Application 2020 & 2033
- Table 23: Spain APAC Auto Logistics Industry Revenue (Million) Forecast, by Application 2020 & 2033
- Table 24: Russia APAC Auto Logistics Industry Revenue (Million) Forecast, by Application 2020 & 2033
- Table 25: Benelux APAC Auto Logistics Industry Revenue (Million) Forecast, by Application 2020 & 2033
- Table 26: Nordics APAC Auto Logistics Industry Revenue (Million) Forecast, by Application 2020 & 2033
- Table 27: Rest of Europe APAC Auto Logistics Industry Revenue (Million) Forecast, by Application 2020 & 2033
- Table 28: Global APAC Auto Logistics Industry Revenue Million Forecast, by Service 2020 & 2033
- Table 29: Global APAC Auto Logistics Industry Revenue Million Forecast, by Type 2020 & 2033
- Table 30: Global APAC Auto Logistics Industry Revenue Million Forecast, by Country 2020 & 2033
- Table 31: Turkey APAC Auto Logistics Industry Revenue (Million) Forecast, by Application 2020 & 2033
- Table 32: Israel APAC Auto Logistics Industry Revenue (Million) Forecast, by Application 2020 & 2033
- Table 33: GCC APAC Auto Logistics Industry Revenue (Million) Forecast, by Application 2020 & 2033
- Table 34: North Africa APAC Auto Logistics Industry Revenue (Million) Forecast, by Application 2020 & 2033
- Table 35: South Africa APAC Auto Logistics Industry Revenue (Million) Forecast, by Application 2020 & 2033
- Table 36: Rest of Middle East & Africa APAC Auto Logistics Industry Revenue (Million) Forecast, by Application 2020 & 2033
- Table 37: Global APAC Auto Logistics Industry Revenue Million Forecast, by Service 2020 & 2033
- Table 38: Global APAC Auto Logistics Industry Revenue Million Forecast, by Type 2020 & 2033
- Table 39: Global APAC Auto Logistics Industry Revenue Million Forecast, by Country 2020 & 2033
- Table 40: China APAC Auto Logistics Industry Revenue (Million) Forecast, by Application 2020 & 2033
- Table 41: India APAC Auto Logistics Industry Revenue (Million) Forecast, by Application 2020 & 2033
- Table 42: Japan APAC Auto Logistics Industry Revenue (Million) Forecast, by Application 2020 & 2033
- Table 43: South Korea APAC Auto Logistics Industry Revenue (Million) Forecast, by Application 2020 & 2033
- Table 44: ASEAN APAC Auto Logistics Industry Revenue (Million) Forecast, by Application 2020 & 2033
- Table 45: Oceania APAC Auto Logistics Industry Revenue (Million) Forecast, by Application 2020 & 2033
- Table 46: Rest of Asia Pacific APAC Auto Logistics Industry Revenue (Million) Forecast, by Application 2020 & 2033
Frequently Asked Questions
1. What is the projected Compound Annual Growth Rate (CAGR) of the APAC Auto Logistics Industry?
The projected CAGR is approximately > 6.50%.
2. Which companies are prominent players in the APAC Auto Logistics Industry?
Key companies in the market include DB Schenker, Hitachi Transport System Ltd, CEVA Logistics AG, Neovia Logistics Services LLC, DHL, Yusen Logistics Co Ltd, GEODIS, Nippon Express Co Ltd, United Parcel Service Inc**List Not Exhaustive, XPO Logistics Inc, KUEHNE + NAGEL International AG, DSV, Ryder System Inc.
3. What are the main segments of the APAC Auto Logistics Industry?
The market segments include Service, Type.
4. Can you provide details about the market size?
The market size is estimated to be USD 289.04 Million as of 2022.
5. What are some drivers contributing to market growth?
Rising Number of Partnerships among Automobile Manufacturers and Logistics Partners; Growth in international trade.
6. What are the notable trends driving market growth?
Demand for Electric Vehicles are increasing in the region.
7. Are there any restraints impacting market growth?
Nature of Supply Chain Business.
8. Can you provide examples of recent developments in the market?
March 2023: Tata Motors, One of India’s leading automobile manufacturers and the pioneer of India’s EV evolution, received an order for providing 1000 XPRES-T EVs to OHM E Logistics Pvt. Ltd. in Hyderabad for their electric cab transportation services. These cars will be delivered to OHM E Logistics in a phased manner.
9. What pricing options are available for accessing the report?
Pricing options include single-user, multi-user, and enterprise licenses priced at USD 4750, USD 4950, and USD 6800 respectively.
10. Is the market size provided in terms of value or volume?
The market size is provided in terms of value, measured in Million.
11. Are there any specific market keywords associated with the report?
Yes, the market keyword associated with the report is "APAC Auto Logistics Industry," which aids in identifying and referencing the specific market segment covered.
12. How do I determine which pricing option suits my needs best?
The pricing options vary based on user requirements and access needs. Individual users may opt for single-user licenses, while businesses requiring broader access may choose multi-user or enterprise licenses for cost-effective access to the report.
13. Are there any additional resources or data provided in the APAC Auto Logistics Industry report?
While the report offers comprehensive insights, it's advisable to review the specific contents or supplementary materials provided to ascertain if additional resources or data are available.
14. How can I stay updated on further developments or reports in the APAC Auto Logistics Industry?
To stay informed about further developments, trends, and reports in the APAC Auto Logistics Industry, consider subscribing to industry newsletters, following relevant companies and organizations, or regularly checking reputable industry news sources and publications.
Methodology
Step 1 - Identification of Relevant Samples Size from Population Database


Step 2 - Approaches for Defining Global Market Size (Value, Volume* & Price*)

Note*: In applicable scenarios
Step 3 - Data Sources
Primary Research
- Web Analytics
- Survey Reports
- Research Institute
- Latest Research Reports
- Opinion Leaders
Secondary Research
- Annual Reports
- White Paper
- Latest Press Release
- Industry Association
- Paid Database
- Investor Presentations

Step 4 - Data Triangulation
Involves using different sources of information in order to increase the validity of a study
These sources are likely to be stakeholders in a program - participants, other researchers, program staff, other community members, and so on.
Then we put all data in single framework & apply various statistical tools to find out the dynamic on the market.
During the analysis stage, feedback from the stakeholder groups would be compared to determine areas of agreement as well as areas of divergence