

Key Insights
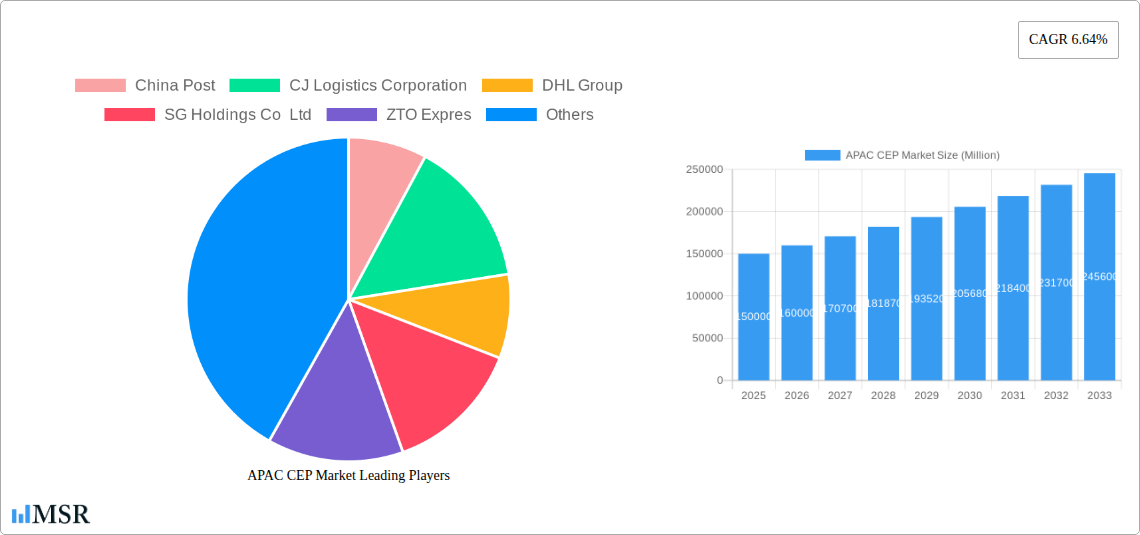
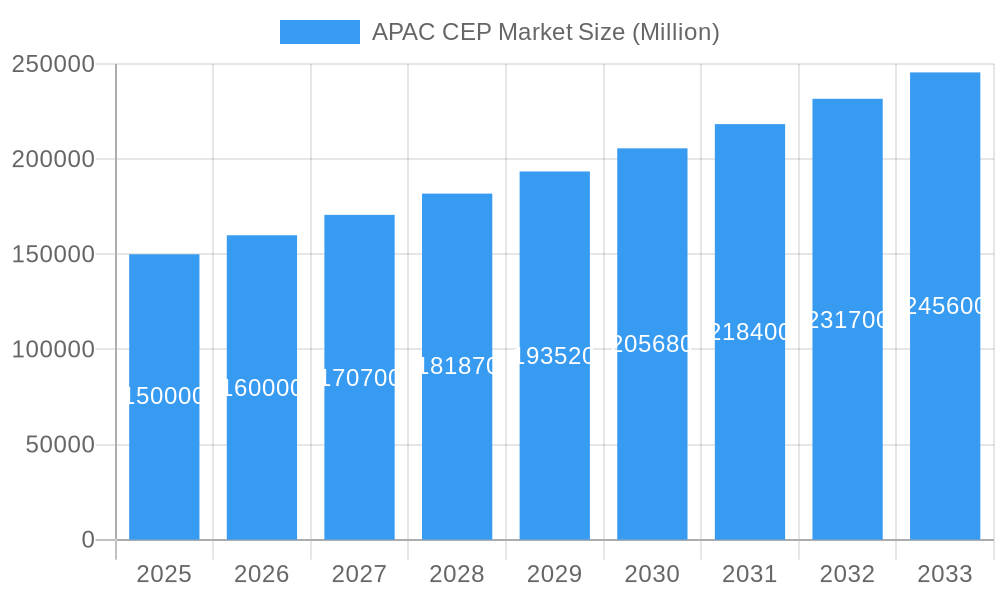
The Asia-Pacific (APAC) Courier, Express, and Parcel (CEP) market is experiencing robust growth, driven by the expansion of e-commerce, the rise of digitalization across various sectors, and increasing cross-border trade. The market's 6.64% CAGR indicates a significant upward trajectory, projecting substantial expansion from its 2025 value. Key growth drivers include the burgeoning middle class in many APAC nations fueling consumer spending, improved logistics infrastructure in certain regions, and the adoption of advanced technologies like AI and automation in delivery processes. The dominance of e-commerce, particularly in countries like China and India, significantly contributes to market expansion. While the market faces challenges such as fluctuating fuel prices, geopolitical uncertainties, and the need for consistent regulatory frameworks across diverse nations, the overall positive economic outlook and increasing demand for faster and more reliable delivery solutions underpin continued growth. Segmentation reveals a strong reliance on road transport, although air freight is crucial for express deliveries, particularly international shipments. B2C transactions dominate, highlighting the e-commerce influence, but B2B segments are also witnessing healthy growth driven by supply chain optimization needs. Major players such as DHL, FedEx, and local giants like SF Express and ZTO Express are actively competing, leading to innovations in service offerings and technology adoption to maintain market share.
APAC CEP Market Market Size (In Billion)
The future of the APAC CEP market hinges on the continued expansion of e-commerce, particularly in less developed markets within the region. Government initiatives promoting infrastructure development and digitalization will play a crucial role in enabling further growth. The increasing demand for efficient and sustainable delivery solutions will likely drive the adoption of greener technologies and optimized delivery routes. Competition among established players and the emergence of new entrants will continue to shape the market landscape, pushing for innovation and improved service offerings. The market’s segmentation by shipment weight (light, medium, heavy) underscores the varying needs of different businesses and consumers, indicating potential for specialized service development catering to specific weight categories. Furthermore, the diverse range of end-user industries reliant on CEP services highlights the broad reach and strategic importance of this market segment. Strategic partnerships and acquisitions are expected to be key competitive strategies in the coming years.
APAC CEP Market Company Market Share
APAC CEP Market Report: 2019-2033
This comprehensive report provides an in-depth analysis of the Asia-Pacific Courier, Express, and Parcel (CEP) market, offering invaluable insights for industry stakeholders. The study period covers 2019-2033, with 2025 as the base year and a forecast period of 2025-2033. The report meticulously examines market dynamics, key segments, leading players, and future growth opportunities, leveraging data from the historical period (2019-2024) to predict future trends. Expect detailed analysis of market size (in Millions), CAGR, and market share across various segments and countries.
APAC CEP Market Market Concentration & Dynamics
The APAC CEP market exhibits a complex competitive landscape, characterized by both established international players and rapidly expanding domestic companies. Market concentration is moderate, with a few dominant players holding significant market share, yet numerous smaller players contributing substantially to the overall market volume. The market share of the top 5 players in 2025 is estimated at xx%. Innovation within the ecosystem is driven by technological advancements in automation, AI, and data analytics. Regulatory frameworks vary across countries, creating both opportunities and challenges for market participants. Substitute products, such as postal services and specialized delivery networks, present a degree of competition. Evolving end-user trends, particularly the growth of e-commerce and the increasing demand for faster delivery speeds, are reshaping market dynamics. M&A activity is relatively high, with xx deals recorded in the past 5 years, indicative of both consolidation and expansion strategies.
- Market Leaders (2025 Estimated): SF Express (KEX-SF), China Post, DHL Group, FedEx, UPS (each holding approximately xx% market share).
- M&A Activity: xx deals between 2020 and 2024 primarily focused on expanding delivery networks and technological integration.
- Regulatory landscape: Varies significantly across countries influencing operational costs and service offerings.
APAC CEP Market Industry Insights & Trends
The APAC CEP market is experiencing robust growth, driven by the explosive expansion of e-commerce, the rising middle class, and improving logistics infrastructure across the region. The market size in 2025 is estimated at xxx Million, with a CAGR of xx% projected from 2025 to 2033. Technological disruptions are fundamentally altering the industry, with automation, AI-powered route optimization, and drone delivery systems gaining traction. Evolving consumer behavior demands faster, more reliable, and trackable delivery options. This is further fueled by the increasing preference for same-day and next-day delivery services. These developments necessitate substantial investments in technology and infrastructure to maintain competitiveness.
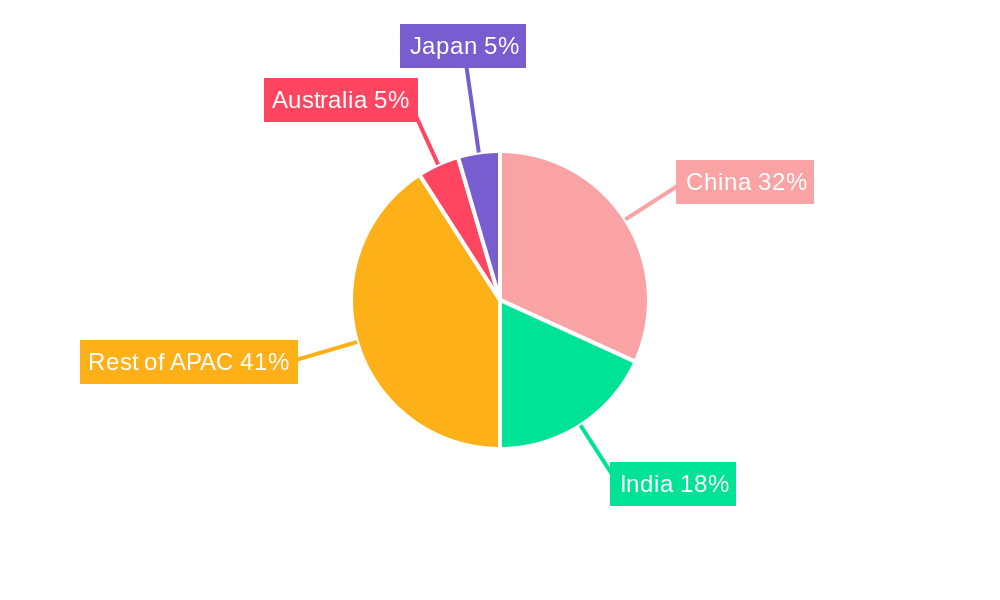
Key Markets & Segments Leading APAC CEP Market
China remains the dominant market within the APAC CEP sector, contributing approximately xx% to the total market value in 2025. India and other Southeast Asian countries are also experiencing significant growth.
Dominant Regions:
- China: Highest market volume and fastest growth due to robust e-commerce expansion.
- India: High growth potential driven by increasing internet and smartphone penetration.
- Southeast Asia (Indonesia, Thailand, Vietnam): Rapid growth fueled by rising e-commerce adoption and improving logistics infrastructure.
Dominant Segments:
- Mode of Transport: Road transport dominates due to cost-effectiveness and widespread network. However, Air transport is crucial for time-sensitive deliveries and long distances.
- End User Industry: E-commerce is the primary driver, followed by wholesale and retail trade.
- Destination: Domestic shipments constitute the largest segment, with international shipments showing strong growth potential.
- Speed of Delivery: Express delivery is gaining popularity, driving demand for advanced logistics solutions.
- Model: B2C is the largest segment due to e-commerce growth, with B2B also showing substantial demand.
- Shipment Weight: Light weight shipments dominate due to prevalence of e-commerce products.
Growth Drivers:
- Rapid expansion of e-commerce
- Rising middle class and increased disposable income
- Investment in logistics infrastructure, including improved road networks and air connectivity
- Technological advancements in automation and AI
- Government initiatives promoting e-commerce and logistics development
APAC CEP Market Product Developments
The APAC CEP market is experiencing a dynamic evolution driven by cutting-edge product developments. A significant trend is the pervasive integration of Artificial Intelligence (AI) and advanced automation across critical operational areas, including sophisticated sorting processes, intelligent routing algorithms, and highly efficient last-mile delivery solutions. The increasing adoption of robotics, autonomous drones, and self-driving vehicles is revolutionizing operational efficiency, leading to substantially reduced delivery times and enhanced service levels. Furthermore, the deployment of sophisticated, real-time tracking systems and comprehensive visibility solutions is not only bolstering customer satisfaction through unparalleled transparency but also providing invaluable insights for optimizing operations. Companies that proactively embrace these technological innovations are positioning themselves for a significant competitive advantage in this rapidly evolving landscape.
Challenges in the APAC CEP Market Market
Sustained long-term growth within the APAC CEP market is intrinsically linked to the effective resolution of existing challenges. Key strategic imperatives include addressing critical infrastructure gaps, particularly in emerging economies, and significantly improving the efficiency and streamlining of cross-border logistics to facilitate seamless regional trade. Fostering continuous innovation in last-mile delivery solutions remains paramount to meet evolving customer expectations for speed and convenience. Strategic partnerships and robust cross-industry collaborations will be instrumental in effectively navigating the intricate web of regulatory complexities. Furthermore, strategic expansion into underserved markets and the proactive adoption of sustainable, environmentally conscious practices are essential for ensuring enduring market success and building a resilient and responsible CEP ecosystem.
Forces Driving APAC CEP Market Growth
Key growth drivers include the continued rise of e-commerce, increasing disposable incomes, and government investments in infrastructure. Technological advancements such as AI, automation, and drone delivery are accelerating market expansion. Favorable regulatory environments in some regions stimulate further investment. For example, government initiatives to promote digital economy in India and China's Belt and Road initiative are facilitating trade and logistics growth, contributing significantly to market expansion.
Challenges in the APAC CEP Market Market
Sustained long-term growth within the APAC CEP market is intrinsically linked to the effective resolution of existing challenges. Key strategic imperatives include addressing critical infrastructure gaps, particularly in emerging economies, and significantly improving the efficiency and streamlining of cross-border logistics to facilitate seamless regional trade. Fostering continuous innovation in last-mile delivery solutions remains paramount to meet evolving customer expectations for speed and convenience. Strategic partnerships and robust cross-industry collaborations will be instrumental in effectively navigating the intricate web of regulatory complexities. Furthermore, strategic expansion into underserved markets and the proactive adoption of sustainable, environmentally conscious practices are essential for ensuring enduring market success and building a resilient and responsible CEP ecosystem.
Emerging Opportunities in APAP CEP Market
Significant opportunities lie in the expansion of last-mile delivery solutions using innovative technologies such as drones and autonomous vehicles. The growing demand for specialized services, like temperature-controlled delivery for healthcare products, presents a lucrative segment. Focusing on sustainable and environmentally friendly logistics practices creates a competitive advantage. The potential to leverage data analytics to optimize routes, pricing and customer service offers significant advantages.
Leading Players in the APAC CEP Market Sector
- China Post
- CJ Logistics Corporation
- DHL Group
- SG Holdings Co Ltd
- ZTO Express
- FedEx
- United Parcel Service of America Inc (UPS)
- YTO Express
- Yamato Holdings
- SF Express (KEX-SF)
- Blue Dart Express
- DTDC Express Limited
- Toll Group
- JWD Group
Key Milestones in APAC CEP Market Industry
- June 2023: China Post launches its first integrated indoor and outdoor “Robot Plus” AI delivery solution, enhancing last-mile efficiency.
- April 2023: China Post and Ping An Bank launch an intelligent archives service center, integrating auto finance and logistics.
- March 2023: Colowide MD Co. Ltd and Yamato Transport Co. Ltd agree to optimize Colowide Group's supply chain, showcasing collaborative innovation.
Strategic Outlook for APAC CEP Market Market
The APAC CEP market is brimming with immense potential for robust future growth, propelled by the relentless expansion of e-commerce, a burgeoning middle class with rising disposable incomes, and continuous technological advancements. Companies that strategically prioritize investments in innovative technologies, diligently work to expand their delivery networks to reach a wider customer base, and cultivate strong, synergistic partnerships will be exceptionally well-positioned to capitalize on the significant opportunities that this dynamic and rapidly evolving market presents. A steadfast focus on sustainability initiatives and operational efficiency will be critical differentiators for achieving long-term market leadership and ensuring the sector's enduring success.
APAC CEP Market Segmentation
-
1. Destination
- 1.1. Domestic
- 1.2. International
-
2. Speed Of Delivery
- 2.1. Express
- 2.2. Non-Express
-
3. Model
- 3.1. Business-to-Business (B2B)
- 3.2. Business-to-Consumer (B2C)
- 3.3. Consumer-to-Consumer (C2C)
-
4. Shipment Weight
- 4.1. Heavy Weight Shipments
- 4.2. Light Weight Shipments
- 4.3. Medium Weight Shipments
-
5. Mode Of Transport
- 5.1. Air
- 5.2. Road
- 5.3. Others
-
6. End User Industry
- 6.1. E-Commerce
- 6.2. Financial Services (BFSI)
- 6.3. Healthcare
- 6.4. Manufacturing
- 6.5. Primary Industry
- 6.6. Wholesale and Retail Trade (Offline)
- 6.7. Others
APAC CEP Market Segmentation By Geography
-
1. North America
- 1.1. United States
- 1.2. Canada
- 1.3. Mexico
-
2. South America
- 2.1. Brazil
- 2.2. Argentina
- 2.3. Rest of South America
-
3. Europe
- 3.1. United Kingdom
- 3.2. Germany
- 3.3. France
- 3.4. Italy
- 3.5. Spain
- 3.6. Russia
- 3.7. Benelux
- 3.8. Nordics
- 3.9. Rest of Europe
-
4. Middle East & Africa
- 4.1. Turkey
- 4.2. Israel
- 4.3. GCC
- 4.4. North Africa
- 4.5. South Africa
- 4.6. Rest of Middle East & Africa
-
5. Asia Pacific
- 5.1. China
- 5.2. India
- 5.3. Japan
- 5.4. South Korea
- 5.5. ASEAN
- 5.6. Oceania
- 5.7. Rest of Asia Pacific
APAC CEP Market Regional Market Share
Geographic Coverage of APAC CEP Market
APAC CEP Market REPORT HIGHLIGHTS
| Aspects | Details |
|---|---|
| Study Period | 2020-2034 |
| Base Year | 2025 |
| Estimated Year | 2026 |
| Forecast Period | 2026-2034 |
| Historical Period | 2020-2025 |
| Growth Rate | CAGR of 6.64% from 2020-2034 |
| Segmentation |
|
Table of Contents
- 1. Introduction
- 1.1. Research Scope
- 1.2. Market Segmentation
- 1.3. Research Objective
- 1.4. Definitions and Assumptions
- 2. Executive Summary
- 2.1. Market Snapshot
- 3. Market Dynamics
- 3.1. Market Drivers
- 3.2. Market Restrains
- 3.3. Market Trends
- 3.4. Market Opportunities
- 4. Market Factor Analysis
- 4.1. Porters Five Forces
- 4.1.1. Bargaining Power of Suppliers
- 4.1.2. Bargaining Power of Buyers
- 4.1.3. Threat of New Entrants
- 4.1.4. Threat of Substitutes
- 4.1.5. Competitive Rivalry
- 4.2. PESTEL analysis
- 4.3. BCG Analysis
- 4.3.1. Stars (High Growth, High Market Share)
- 4.3.2. Cash Cows (Low Growth, High Market Share)
- 4.3.3. Question Mark (High Growth, Low Market Share)
- 4.3.4. Dogs (Low Growth, Low Market Share)
- 4.4. Ansoff Matrix Analysis
- 4.5. Supply Chain Analysis
- 4.6. Regulatory Landscape
- 4.7. Current Market Potential and Opportunity Assessment (TAM–SAM–SOM Framework)
- 4.8. MSR Analyst Note
- 4.1. Porters Five Forces
- 5. Market Analysis, Insights and Forecast 2021-2033
- 5.1. Market Analysis, Insights and Forecast - by Destination
- 5.1.1. Domestic
- 5.1.2. International
- 5.2. Market Analysis, Insights and Forecast - by Speed Of Delivery
- 5.2.1. Express
- 5.2.2. Non-Express
- 5.3. Market Analysis, Insights and Forecast - by Model
- 5.3.1. Business-to-Business (B2B)
- 5.3.2. Business-to-Consumer (B2C)
- 5.3.3. Consumer-to-Consumer (C2C)
- 5.4. Market Analysis, Insights and Forecast - by Shipment Weight
- 5.4.1. Heavy Weight Shipments
- 5.4.2. Light Weight Shipments
- 5.4.3. Medium Weight Shipments
- 5.5. Market Analysis, Insights and Forecast - by Mode Of Transport
- 5.5.1. Air
- 5.5.2. Road
- 5.5.3. Others
- 5.6. Market Analysis, Insights and Forecast - by End User Industry
- 5.6.1. E-Commerce
- 5.6.2. Financial Services (BFSI)
- 5.6.3. Healthcare
- 5.6.4. Manufacturing
- 5.6.5. Primary Industry
- 5.6.6. Wholesale and Retail Trade (Offline)
- 5.6.7. Others
- 5.7. Market Analysis, Insights and Forecast - by Region
- 5.7.1. North America
- 5.7.2. South America
- 5.7.3. Europe
- 5.7.4. Middle East & Africa
- 5.7.5. Asia Pacific
- 5.1. Market Analysis, Insights and Forecast - by Destination
- 6. Global APAC CEP Market Analysis, Insights and Forecast, 2021-2033
- 6.1. Market Analysis, Insights and Forecast - by Destination
- 6.1.1. Domestic
- 6.1.2. International
- 6.2. Market Analysis, Insights and Forecast - by Speed Of Delivery
- 6.2.1. Express
- 6.2.2. Non-Express
- 6.3. Market Analysis, Insights and Forecast - by Model
- 6.3.1. Business-to-Business (B2B)
- 6.3.2. Business-to-Consumer (B2C)
- 6.3.3. Consumer-to-Consumer (C2C)
- 6.4. Market Analysis, Insights and Forecast - by Shipment Weight
- 6.4.1. Heavy Weight Shipments
- 6.4.2. Light Weight Shipments
- 6.4.3. Medium Weight Shipments
- 6.5. Market Analysis, Insights and Forecast - by Mode Of Transport
- 6.5.1. Air
- 6.5.2. Road
- 6.5.3. Others
- 6.6. Market Analysis, Insights and Forecast - by End User Industry
- 6.6.1. E-Commerce
- 6.6.2. Financial Services (BFSI)
- 6.6.3. Healthcare
- 6.6.4. Manufacturing
- 6.6.5. Primary Industry
- 6.6.6. Wholesale and Retail Trade (Offline)
- 6.6.7. Others
- 6.1. Market Analysis, Insights and Forecast - by Destination
- 7. North America APAC CEP Market Analysis, Insights and Forecast, 2020-2032
- 7.1. Market Analysis, Insights and Forecast - by Destination
- 7.1.1. Domestic
- 7.1.2. International
- 7.2. Market Analysis, Insights and Forecast - by Speed Of Delivery
- 7.2.1. Express
- 7.2.2. Non-Express
- 7.3. Market Analysis, Insights and Forecast - by Model
- 7.3.1. Business-to-Business (B2B)
- 7.3.2. Business-to-Consumer (B2C)
- 7.3.3. Consumer-to-Consumer (C2C)
- 7.4. Market Analysis, Insights and Forecast - by Shipment Weight
- 7.4.1. Heavy Weight Shipments
- 7.4.2. Light Weight Shipments
- 7.4.3. Medium Weight Shipments
- 7.5. Market Analysis, Insights and Forecast - by Mode Of Transport
- 7.5.1. Air
- 7.5.2. Road
- 7.5.3. Others
- 7.6. Market Analysis, Insights and Forecast - by End User Industry
- 7.6.1. E-Commerce
- 7.6.2. Financial Services (BFSI)
- 7.6.3. Healthcare
- 7.6.4. Manufacturing
- 7.6.5. Primary Industry
- 7.6.6. Wholesale and Retail Trade (Offline)
- 7.6.7. Others
- 7.1. Market Analysis, Insights and Forecast - by Destination
- 8. South America APAC CEP Market Analysis, Insights and Forecast, 2020-2032
- 8.1. Market Analysis, Insights and Forecast - by Destination
- 8.1.1. Domestic
- 8.1.2. International
- 8.2. Market Analysis, Insights and Forecast - by Speed Of Delivery
- 8.2.1. Express
- 8.2.2. Non-Express
- 8.3. Market Analysis, Insights and Forecast - by Model
- 8.3.1. Business-to-Business (B2B)
- 8.3.2. Business-to-Consumer (B2C)
- 8.3.3. Consumer-to-Consumer (C2C)
- 8.4. Market Analysis, Insights and Forecast - by Shipment Weight
- 8.4.1. Heavy Weight Shipments
- 8.4.2. Light Weight Shipments
- 8.4.3. Medium Weight Shipments
- 8.5. Market Analysis, Insights and Forecast - by Mode Of Transport
- 8.5.1. Air
- 8.5.2. Road
- 8.5.3. Others
- 8.6. Market Analysis, Insights and Forecast - by End User Industry
- 8.6.1. E-Commerce
- 8.6.2. Financial Services (BFSI)
- 8.6.3. Healthcare
- 8.6.4. Manufacturing
- 8.6.5. Primary Industry
- 8.6.6. Wholesale and Retail Trade (Offline)
- 8.6.7. Others
- 8.1. Market Analysis, Insights and Forecast - by Destination
- 9. Europe APAC CEP Market Analysis, Insights and Forecast, 2020-2032
- 9.1. Market Analysis, Insights and Forecast - by Destination
- 9.1.1. Domestic
- 9.1.2. International
- 9.2. Market Analysis, Insights and Forecast - by Speed Of Delivery
- 9.2.1. Express
- 9.2.2. Non-Express
- 9.3. Market Analysis, Insights and Forecast - by Model
- 9.3.1. Business-to-Business (B2B)
- 9.3.2. Business-to-Consumer (B2C)
- 9.3.3. Consumer-to-Consumer (C2C)
- 9.4. Market Analysis, Insights and Forecast - by Shipment Weight
- 9.4.1. Heavy Weight Shipments
- 9.4.2. Light Weight Shipments
- 9.4.3. Medium Weight Shipments
- 9.5. Market Analysis, Insights and Forecast - by Mode Of Transport
- 9.5.1. Air
- 9.5.2. Road
- 9.5.3. Others
- 9.6. Market Analysis, Insights and Forecast - by End User Industry
- 9.6.1. E-Commerce
- 9.6.2. Financial Services (BFSI)
- 9.6.3. Healthcare
- 9.6.4. Manufacturing
- 9.6.5. Primary Industry
- 9.6.6. Wholesale and Retail Trade (Offline)
- 9.6.7. Others
- 9.1. Market Analysis, Insights and Forecast - by Destination
- 10. Middle East & Africa APAC CEP Market Analysis, Insights and Forecast, 2020-2032
- 10.1. Market Analysis, Insights and Forecast - by Destination
- 10.1.1. Domestic
- 10.1.2. International
- 10.2. Market Analysis, Insights and Forecast - by Speed Of Delivery
- 10.2.1. Express
- 10.2.2. Non-Express
- 10.3. Market Analysis, Insights and Forecast - by Model
- 10.3.1. Business-to-Business (B2B)
- 10.3.2. Business-to-Consumer (B2C)
- 10.3.3. Consumer-to-Consumer (C2C)
- 10.4. Market Analysis, Insights and Forecast - by Shipment Weight
- 10.4.1. Heavy Weight Shipments
- 10.4.2. Light Weight Shipments
- 10.4.3. Medium Weight Shipments
- 10.5. Market Analysis, Insights and Forecast - by Mode Of Transport
- 10.5.1. Air
- 10.5.2. Road
- 10.5.3. Others
- 10.6. Market Analysis, Insights and Forecast - by End User Industry
- 10.6.1. E-Commerce
- 10.6.2. Financial Services (BFSI)
- 10.6.3. Healthcare
- 10.6.4. Manufacturing
- 10.6.5. Primary Industry
- 10.6.6. Wholesale and Retail Trade (Offline)
- 10.6.7. Others
- 10.1. Market Analysis, Insights and Forecast - by Destination
- 11. Asia Pacific APAC CEP Market Analysis, Insights and Forecast, 2020-2032
- 11.1. Market Analysis, Insights and Forecast - by Destination
- 11.1.1. Domestic
- 11.1.2. International
- 11.2. Market Analysis, Insights and Forecast - by Speed Of Delivery
- 11.2.1. Express
- 11.2.2. Non-Express
- 11.3. Market Analysis, Insights and Forecast - by Model
- 11.3.1. Business-to-Business (B2B)
- 11.3.2. Business-to-Consumer (B2C)
- 11.3.3. Consumer-to-Consumer (C2C)
- 11.4. Market Analysis, Insights and Forecast - by Shipment Weight
- 11.4.1. Heavy Weight Shipments
- 11.4.2. Light Weight Shipments
- 11.4.3. Medium Weight Shipments
- 11.5. Market Analysis, Insights and Forecast - by Mode Of Transport
- 11.5.1. Air
- 11.5.2. Road
- 11.5.3. Others
- 11.6. Market Analysis, Insights and Forecast - by End User Industry
- 11.6.1. E-Commerce
- 11.6.2. Financial Services (BFSI)
- 11.6.3. Healthcare
- 11.6.4. Manufacturing
- 11.6.5. Primary Industry
- 11.6.6. Wholesale and Retail Trade (Offline)
- 11.6.7. Others
- 11.1. Market Analysis, Insights and Forecast - by Destination
- 12. Competitive Analysis
- 12.1. Company Profiles
- 12.1.1 China Post
- 12.1.1.1. Company Overview
- 12.1.1.2. Products
- 12.1.1.3. Company Financials
- 12.1.1.4. SWOT Analysis
- 12.1.2 CJ Logistics Corporation
- 12.1.2.1. Company Overview
- 12.1.2.2. Products
- 12.1.2.3. Company Financials
- 12.1.2.4. SWOT Analysis
- 12.1.3 DHL Group
- 12.1.3.1. Company Overview
- 12.1.3.2. Products
- 12.1.3.3. Company Financials
- 12.1.3.4. SWOT Analysis
- 12.1.4 SG Holdings Co Ltd
- 12.1.4.1. Company Overview
- 12.1.4.2. Products
- 12.1.4.3. Company Financials
- 12.1.4.4. SWOT Analysis
- 12.1.5 ZTO Expres
- 12.1.5.1. Company Overview
- 12.1.5.2. Products
- 12.1.5.3. Company Financials
- 12.1.5.4. SWOT Analysis
- 12.1.6 FedEx
- 12.1.6.1. Company Overview
- 12.1.6.2. Products
- 12.1.6.3. Company Financials
- 12.1.6.4. SWOT Analysis
- 12.1.7 United Parcel Service of America Inc (UPS)
- 12.1.7.1. Company Overview
- 12.1.7.2. Products
- 12.1.7.3. Company Financials
- 12.1.7.4. SWOT Analysis
- 12.1.8 YTO Express
- 12.1.8.1. Company Overview
- 12.1.8.2. Products
- 12.1.8.3. Company Financials
- 12.1.8.4. SWOT Analysis
- 12.1.9 Yamato Holdings
- 12.1.9.1. Company Overview
- 12.1.9.2. Products
- 12.1.9.3. Company Financials
- 12.1.9.4. SWOT Analysis
- 12.1.10 SF Express (KEX-SF)
- 12.1.10.1. Company Overview
- 12.1.10.2. Products
- 12.1.10.3. Company Financials
- 12.1.10.4. SWOT Analysis
- 12.1.11 Blue Dart Express
- 12.1.11.1. Company Overview
- 12.1.11.2. Products
- 12.1.11.3. Company Financials
- 12.1.11.4. SWOT Analysis
- 12.1.12 DTDC Express Limited
- 12.1.12.1. Company Overview
- 12.1.12.2. Products
- 12.1.12.3. Company Financials
- 12.1.12.4. SWOT Analysis
- 12.1.13 Toll Group
- 12.1.13.1. Company Overview
- 12.1.13.2. Products
- 12.1.13.3. Company Financials
- 12.1.13.4. SWOT Analysis
- 12.1.14 JWD Group
- 12.1.14.1. Company Overview
- 12.1.14.2. Products
- 12.1.14.3. Company Financials
- 12.1.14.4. SWOT Analysis
- 12.1.1 China Post
- 12.2. Market Entropy
- 12.2.1 Company's Key Areas Served
- 12.2.2 Recent Developments
- 12.3. Company Market Share Analysis 2025
- 12.3.1 Top 5 Companies Market Share Analysis
- 12.3.2 Top 3 Companies Market Share Analysis
- 12.4. List of Potential Customers
- 13. Research Methodology
List of Figures
- Figure 1: Global APAC CEP Market Revenue Breakdown (Million, %) by Region 2025 & 2033
- Figure 2: North America APAC CEP Market Revenue (Million), by Destination 2025 & 2033
- Figure 3: North America APAC CEP Market Revenue Share (%), by Destination 2025 & 2033
- Figure 4: North America APAC CEP Market Revenue (Million), by Speed Of Delivery 2025 & 2033
- Figure 5: North America APAC CEP Market Revenue Share (%), by Speed Of Delivery 2025 & 2033
- Figure 6: North America APAC CEP Market Revenue (Million), by Model 2025 & 2033
- Figure 7: North America APAC CEP Market Revenue Share (%), by Model 2025 & 2033
- Figure 8: North America APAC CEP Market Revenue (Million), by Shipment Weight 2025 & 2033
- Figure 9: North America APAC CEP Market Revenue Share (%), by Shipment Weight 2025 & 2033
- Figure 10: North America APAC CEP Market Revenue (Million), by Mode Of Transport 2025 & 2033
- Figure 11: North America APAC CEP Market Revenue Share (%), by Mode Of Transport 2025 & 2033
- Figure 12: North America APAC CEP Market Revenue (Million), by End User Industry 2025 & 2033
- Figure 13: North America APAC CEP Market Revenue Share (%), by End User Industry 2025 & 2033
- Figure 14: North America APAC CEP Market Revenue (Million), by Country 2025 & 2033
- Figure 15: North America APAC CEP Market Revenue Share (%), by Country 2025 & 2033
- Figure 16: South America APAC CEP Market Revenue (Million), by Destination 2025 & 2033
- Figure 17: South America APAC CEP Market Revenue Share (%), by Destination 2025 & 2033
- Figure 18: South America APAC CEP Market Revenue (Million), by Speed Of Delivery 2025 & 2033
- Figure 19: South America APAC CEP Market Revenue Share (%), by Speed Of Delivery 2025 & 2033
- Figure 20: South America APAC CEP Market Revenue (Million), by Model 2025 & 2033
- Figure 21: South America APAC CEP Market Revenue Share (%), by Model 2025 & 2033
- Figure 22: South America APAC CEP Market Revenue (Million), by Shipment Weight 2025 & 2033
- Figure 23: South America APAC CEP Market Revenue Share (%), by Shipment Weight 2025 & 2033
- Figure 24: South America APAC CEP Market Revenue (Million), by Mode Of Transport 2025 & 2033
- Figure 25: South America APAC CEP Market Revenue Share (%), by Mode Of Transport 2025 & 2033
- Figure 26: South America APAC CEP Market Revenue (Million), by End User Industry 2025 & 2033
- Figure 27: South America APAC CEP Market Revenue Share (%), by End User Industry 2025 & 2033
- Figure 28: South America APAC CEP Market Revenue (Million), by Country 2025 & 2033
- Figure 29: South America APAC CEP Market Revenue Share (%), by Country 2025 & 2033
- Figure 30: Europe APAC CEP Market Revenue (Million), by Destination 2025 & 2033
- Figure 31: Europe APAC CEP Market Revenue Share (%), by Destination 2025 & 2033
- Figure 32: Europe APAC CEP Market Revenue (Million), by Speed Of Delivery 2025 & 2033
- Figure 33: Europe APAC CEP Market Revenue Share (%), by Speed Of Delivery 2025 & 2033
- Figure 34: Europe APAC CEP Market Revenue (Million), by Model 2025 & 2033
- Figure 35: Europe APAC CEP Market Revenue Share (%), by Model 2025 & 2033
- Figure 36: Europe APAC CEP Market Revenue (Million), by Shipment Weight 2025 & 2033
- Figure 37: Europe APAC CEP Market Revenue Share (%), by Shipment Weight 2025 & 2033
- Figure 38: Europe APAC CEP Market Revenue (Million), by Mode Of Transport 2025 & 2033
- Figure 39: Europe APAC CEP Market Revenue Share (%), by Mode Of Transport 2025 & 2033
- Figure 40: Europe APAC CEP Market Revenue (Million), by End User Industry 2025 & 2033
- Figure 41: Europe APAC CEP Market Revenue Share (%), by End User Industry 2025 & 2033
- Figure 42: Europe APAC CEP Market Revenue (Million), by Country 2025 & 2033
- Figure 43: Europe APAC CEP Market Revenue Share (%), by Country 2025 & 2033
- Figure 44: Middle East & Africa APAC CEP Market Revenue (Million), by Destination 2025 & 2033
- Figure 45: Middle East & Africa APAC CEP Market Revenue Share (%), by Destination 2025 & 2033
- Figure 46: Middle East & Africa APAC CEP Market Revenue (Million), by Speed Of Delivery 2025 & 2033
- Figure 47: Middle East & Africa APAC CEP Market Revenue Share (%), by Speed Of Delivery 2025 & 2033
- Figure 48: Middle East & Africa APAC CEP Market Revenue (Million), by Model 2025 & 2033
- Figure 49: Middle East & Africa APAC CEP Market Revenue Share (%), by Model 2025 & 2033
- Figure 50: Middle East & Africa APAC CEP Market Revenue (Million), by Shipment Weight 2025 & 2033
- Figure 51: Middle East & Africa APAC CEP Market Revenue Share (%), by Shipment Weight 2025 & 2033
- Figure 52: Middle East & Africa APAC CEP Market Revenue (Million), by Mode Of Transport 2025 & 2033
- Figure 53: Middle East & Africa APAC CEP Market Revenue Share (%), by Mode Of Transport 2025 & 2033
- Figure 54: Middle East & Africa APAC CEP Market Revenue (Million), by End User Industry 2025 & 2033
- Figure 55: Middle East & Africa APAC CEP Market Revenue Share (%), by End User Industry 2025 & 2033
- Figure 56: Middle East & Africa APAC CEP Market Revenue (Million), by Country 2025 & 2033
- Figure 57: Middle East & Africa APAC CEP Market Revenue Share (%), by Country 2025 & 2033
- Figure 58: Asia Pacific APAC CEP Market Revenue (Million), by Destination 2025 & 2033
- Figure 59: Asia Pacific APAC CEP Market Revenue Share (%), by Destination 2025 & 2033
- Figure 60: Asia Pacific APAC CEP Market Revenue (Million), by Speed Of Delivery 2025 & 2033
- Figure 61: Asia Pacific APAC CEP Market Revenue Share (%), by Speed Of Delivery 2025 & 2033
- Figure 62: Asia Pacific APAC CEP Market Revenue (Million), by Model 2025 & 2033
- Figure 63: Asia Pacific APAC CEP Market Revenue Share (%), by Model 2025 & 2033
- Figure 64: Asia Pacific APAC CEP Market Revenue (Million), by Shipment Weight 2025 & 2033
- Figure 65: Asia Pacific APAC CEP Market Revenue Share (%), by Shipment Weight 2025 & 2033
- Figure 66: Asia Pacific APAC CEP Market Revenue (Million), by Mode Of Transport 2025 & 2033
- Figure 67: Asia Pacific APAC CEP Market Revenue Share (%), by Mode Of Transport 2025 & 2033
- Figure 68: Asia Pacific APAC CEP Market Revenue (Million), by End User Industry 2025 & 2033
- Figure 69: Asia Pacific APAC CEP Market Revenue Share (%), by End User Industry 2025 & 2033
- Figure 70: Asia Pacific APAC CEP Market Revenue (Million), by Country 2025 & 2033
- Figure 71: Asia Pacific APAC CEP Market Revenue Share (%), by Country 2025 & 2033
List of Tables
- Table 1: Global APAC CEP Market Revenue Million Forecast, by Destination 2020 & 2033
- Table 2: Global APAC CEP Market Revenue Million Forecast, by Speed Of Delivery 2020 & 2033
- Table 3: Global APAC CEP Market Revenue Million Forecast, by Model 2020 & 2033
- Table 4: Global APAC CEP Market Revenue Million Forecast, by Shipment Weight 2020 & 2033
- Table 5: Global APAC CEP Market Revenue Million Forecast, by Mode Of Transport 2020 & 2033
- Table 6: Global APAC CEP Market Revenue Million Forecast, by End User Industry 2020 & 2033
- Table 7: Global APAC CEP Market Revenue Million Forecast, by Region 2020 & 2033
- Table 8: Global APAC CEP Market Revenue Million Forecast, by Destination 2020 & 2033
- Table 9: Global APAC CEP Market Revenue Million Forecast, by Speed Of Delivery 2020 & 2033
- Table 10: Global APAC CEP Market Revenue Million Forecast, by Model 2020 & 2033
- Table 11: Global APAC CEP Market Revenue Million Forecast, by Shipment Weight 2020 & 2033
- Table 12: Global APAC CEP Market Revenue Million Forecast, by Mode Of Transport 2020 & 2033
- Table 13: Global APAC CEP Market Revenue Million Forecast, by End User Industry 2020 & 2033
- Table 14: Global APAC CEP Market Revenue Million Forecast, by Country 2020 & 2033
- Table 15: United States APAC CEP Market Revenue (Million) Forecast, by Application 2020 & 2033
- Table 16: Canada APAC CEP Market Revenue (Million) Forecast, by Application 2020 & 2033
- Table 17: Mexico APAC CEP Market Revenue (Million) Forecast, by Application 2020 & 2033
- Table 18: Global APAC CEP Market Revenue Million Forecast, by Destination 2020 & 2033
- Table 19: Global APAC CEP Market Revenue Million Forecast, by Speed Of Delivery 2020 & 2033
- Table 20: Global APAC CEP Market Revenue Million Forecast, by Model 2020 & 2033
- Table 21: Global APAC CEP Market Revenue Million Forecast, by Shipment Weight 2020 & 2033
- Table 22: Global APAC CEP Market Revenue Million Forecast, by Mode Of Transport 2020 & 2033
- Table 23: Global APAC CEP Market Revenue Million Forecast, by End User Industry 2020 & 2033
- Table 24: Global APAC CEP Market Revenue Million Forecast, by Country 2020 & 2033
- Table 25: Brazil APAC CEP Market Revenue (Million) Forecast, by Application 2020 & 2033
- Table 26: Argentina APAC CEP Market Revenue (Million) Forecast, by Application 2020 & 2033
- Table 27: Rest of South America APAC CEP Market Revenue (Million) Forecast, by Application 2020 & 2033
- Table 28: Global APAC CEP Market Revenue Million Forecast, by Destination 2020 & 2033
- Table 29: Global APAC CEP Market Revenue Million Forecast, by Speed Of Delivery 2020 & 2033
- Table 30: Global APAC CEP Market Revenue Million Forecast, by Model 2020 & 2033
- Table 31: Global APAC CEP Market Revenue Million Forecast, by Shipment Weight 2020 & 2033
- Table 32: Global APAC CEP Market Revenue Million Forecast, by Mode Of Transport 2020 & 2033
- Table 33: Global APAC CEP Market Revenue Million Forecast, by End User Industry 2020 & 2033
- Table 34: Global APAC CEP Market Revenue Million Forecast, by Country 2020 & 2033
- Table 35: United Kingdom APAC CEP Market Revenue (Million) Forecast, by Application 2020 & 2033
- Table 36: Germany APAC CEP Market Revenue (Million) Forecast, by Application 2020 & 2033
- Table 37: France APAC CEP Market Revenue (Million) Forecast, by Application 2020 & 2033
- Table 38: Italy APAC CEP Market Revenue (Million) Forecast, by Application 2020 & 2033
- Table 39: Spain APAC CEP Market Revenue (Million) Forecast, by Application 2020 & 2033
- Table 40: Russia APAC CEP Market Revenue (Million) Forecast, by Application 2020 & 2033
- Table 41: Benelux APAC CEP Market Revenue (Million) Forecast, by Application 2020 & 2033
- Table 42: Nordics APAC CEP Market Revenue (Million) Forecast, by Application 2020 & 2033
- Table 43: Rest of Europe APAC CEP Market Revenue (Million) Forecast, by Application 2020 & 2033
- Table 44: Global APAC CEP Market Revenue Million Forecast, by Destination 2020 & 2033
- Table 45: Global APAC CEP Market Revenue Million Forecast, by Speed Of Delivery 2020 & 2033
- Table 46: Global APAC CEP Market Revenue Million Forecast, by Model 2020 & 2033
- Table 47: Global APAC CEP Market Revenue Million Forecast, by Shipment Weight 2020 & 2033
- Table 48: Global APAC CEP Market Revenue Million Forecast, by Mode Of Transport 2020 & 2033
- Table 49: Global APAC CEP Market Revenue Million Forecast, by End User Industry 2020 & 2033
- Table 50: Global APAC CEP Market Revenue Million Forecast, by Country 2020 & 2033
- Table 51: Turkey APAC CEP Market Revenue (Million) Forecast, by Application 2020 & 2033
- Table 52: Israel APAC CEP Market Revenue (Million) Forecast, by Application 2020 & 2033
- Table 53: GCC APAC CEP Market Revenue (Million) Forecast, by Application 2020 & 2033
- Table 54: North Africa APAC CEP Market Revenue (Million) Forecast, by Application 2020 & 2033
- Table 55: South Africa APAC CEP Market Revenue (Million) Forecast, by Application 2020 & 2033
- Table 56: Rest of Middle East & Africa APAC CEP Market Revenue (Million) Forecast, by Application 2020 & 2033
- Table 57: Global APAC CEP Market Revenue Million Forecast, by Destination 2020 & 2033
- Table 58: Global APAC CEP Market Revenue Million Forecast, by Speed Of Delivery 2020 & 2033
- Table 59: Global APAC CEP Market Revenue Million Forecast, by Model 2020 & 2033
- Table 60: Global APAC CEP Market Revenue Million Forecast, by Shipment Weight 2020 & 2033
- Table 61: Global APAC CEP Market Revenue Million Forecast, by Mode Of Transport 2020 & 2033
- Table 62: Global APAC CEP Market Revenue Million Forecast, by End User Industry 2020 & 2033
- Table 63: Global APAC CEP Market Revenue Million Forecast, by Country 2020 & 2033
- Table 64: China APAC CEP Market Revenue (Million) Forecast, by Application 2020 & 2033
- Table 65: India APAC CEP Market Revenue (Million) Forecast, by Application 2020 & 2033
- Table 66: Japan APAC CEP Market Revenue (Million) Forecast, by Application 2020 & 2033
- Table 67: South Korea APAC CEP Market Revenue (Million) Forecast, by Application 2020 & 2033
- Table 68: ASEAN APAC CEP Market Revenue (Million) Forecast, by Application 2020 & 2033
- Table 69: Oceania APAC CEP Market Revenue (Million) Forecast, by Application 2020 & 2033
- Table 70: Rest of Asia Pacific APAC CEP Market Revenue (Million) Forecast, by Application 2020 & 2033
Frequently Asked Questions
1. What is the projected Compound Annual Growth Rate (CAGR) of the APAC CEP Market?
The projected CAGR is approximately 6.64%.
2. Which companies are prominent players in the APAC CEP Market?
Key companies in the market include China Post, CJ Logistics Corporation, DHL Group, SG Holdings Co Ltd, ZTO Expres, FedEx, United Parcel Service of America Inc (UPS), YTO Express, Yamato Holdings, SF Express (KEX-SF), Blue Dart Express, DTDC Express Limited, Toll Group, JWD Group.
3. What are the main segments of the APAC CEP Market?
The market segments include Destination, Speed Of Delivery, Model, Shipment Weight, Mode Of Transport, End User Industry.
4. Can you provide details about the market size?
The market size is estimated to be USD XX Million as of 2022.
5. What are some drivers contributing to market growth?
E-commerce Fueling the Growth of 3PL Market.
6. What are the notable trends driving market growth?
OTHER KEY INDUSTRY TRENDS COVERED IN THE REPORT.
7. Are there any restraints impacting market growth?
Slow Infrastructure Development.
8. Can you provide examples of recent developments in the market?
June 2023: China Post launched its first integrated indoor and outdoor “Robot Plus” AI delivery solution in China. The intelligent delivery solution relies on a combination of unmanned vehicles outdoors and robots indoors, constructing an integrated indoor and outdoor unmanned distribution mode and developing a last-mile logistics network with AI transport capacity sharing.April 2023: China Post and the Automobile Consumption Financial Center of Ping An Bank Co. Ltd launched an intelligent archives service center in Guangdong to promote the service integration of auto finance and express and logistics businesses.March 2023: Colowide MD Co. Ltd, which oversees merchandising for the Colowide Group, and Yamato Transport Co. Ltd entered an agreement. The two companies will promote the visualization and optimization of the entire supply chain of Colowide Group, which operates multiple brands such as Gyu-Kaku, Kappa Sushi, and OOTOYA.
9. What pricing options are available for accessing the report?
Pricing options include single-user, multi-user, and enterprise licenses priced at USD 3800, USD 4500, and USD 5800 respectively.
10. Is the market size provided in terms of value or volume?
The market size is provided in terms of value, measured in Million.
11. Are there any specific market keywords associated with the report?
Yes, the market keyword associated with the report is "APAC CEP Market," which aids in identifying and referencing the specific market segment covered.
12. How do I determine which pricing option suits my needs best?
The pricing options vary based on user requirements and access needs. Individual users may opt for single-user licenses, while businesses requiring broader access may choose multi-user or enterprise licenses for cost-effective access to the report.
13. Are there any additional resources or data provided in the APAC CEP Market report?
While the report offers comprehensive insights, it's advisable to review the specific contents or supplementary materials provided to ascertain if additional resources or data are available.
14. How can I stay updated on further developments or reports in the APAC CEP Market?
To stay informed about further developments, trends, and reports in the APAC CEP Market, consider subscribing to industry newsletters, following relevant companies and organizations, or regularly checking reputable industry news sources and publications.
Methodology
Step 1 - Identification of Relevant Samples Size from Population Database


Step 2 - Approaches for Defining Global Market Size (Value, Volume* & Price*)

Note*: In applicable scenarios
Step 3 - Data Sources
Primary Research
- Web Analytics
- Survey Reports
- Research Institute
- Latest Research Reports
- Opinion Leaders
Secondary Research
- Annual Reports
- White Paper
- Latest Press Release
- Industry Association
- Paid Database
- Investor Presentations

Step 4 - Data Triangulation
Involves using different sources of information in order to increase the validity of a study
These sources are likely to be stakeholders in a program - participants, other researchers, program staff, other community members, and so on.
Then we put all data in single framework & apply various statistical tools to find out the dynamic on the market.
During the analysis stage, feedback from the stakeholder groups would be compared to determine areas of agreement as well as areas of divergence