

Key Insights
The Asia-Pacific (APAC) wireless charging market is experiencing significant expansion, driven by the robust growth of the electric vehicle (EV) sector and increasing consumer preference for convenient charging solutions. The market is projected to reach $24.4 billion by 2025, with a Compound Annual Growth Rate (CAGR) of 36.2% from 2025 to 2033. Key growth catalysts include the escalating adoption of EVs in major APAC economies such as China, Japan, India, and South Korea, supported by government initiatives promoting clean energy and reduced emissions. Technological advancements, including enhanced charging efficiency and the development of wireless charging systems compatible with a wider range of EV models, are also contributing to market expansion. While initial infrastructure investment and the comparative cost of wireless charging systems present challenges, the inherent convenience and improved user experience are increasingly mitigating these factors. The integration of wireless charging into public spaces and the expansion of charging networks are anticipated to further accelerate market growth.
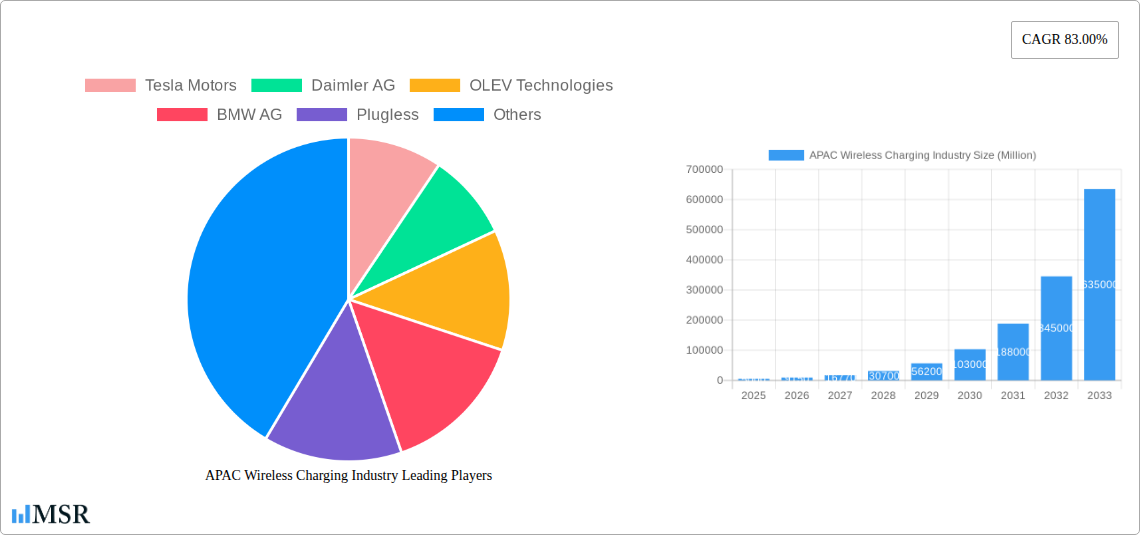
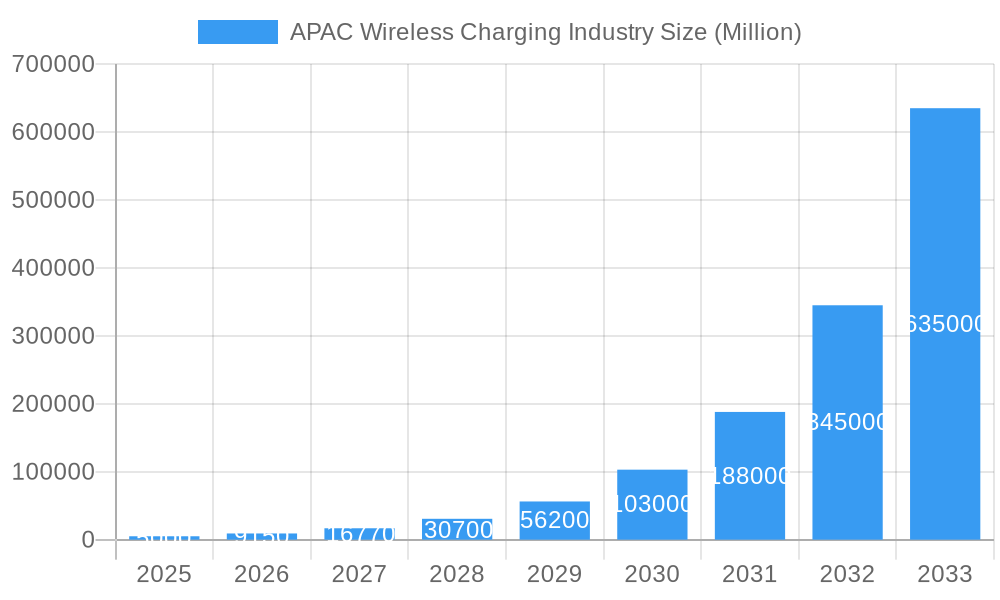
APAC Wireless Charging Industry Market Size (In Billion)
Segmental analysis indicates that Battery Electric Vehicles (BEVs) currently represent a substantial market share due to their higher energy requirements and design compatibility with wireless charging. Regional growth is led by China, owing to its extensive EV market and supportive government policies. However, India and other developing economies offer considerable future growth potential as EV adoption accelerates and charging infrastructure matures. The competitive landscape features prominent players like Tesla, Daimler AG, and Toyota Motor Corporation, fostering continuous innovation and driving improvements in accessibility and affordability. The forecast period (2025-2033) is expected to witness sustained growth, fueled by the convergence of technological progress, favorable regulatory environments, and the expanding EV market across the APAC region.
APAC Wireless Charging Industry Company Market Share
APAC Wireless Charging Industry: A Comprehensive Market Report (2019-2033)
This in-depth report provides a comprehensive analysis of the Asia-Pacific (APAC) wireless charging industry, offering invaluable insights for stakeholders across the value chain. Covering the period 2019-2033, with a focus on 2025, this report meticulously examines market dynamics, key players, technological advancements, and future growth prospects. The report reveals the market size reached xx Million in 2025 and projects a CAGR of xx% from 2025 to 2033, highlighting lucrative opportunities for investors and industry leaders.
APAC Wireless Charging Industry Market Concentration & Dynamics
The APAC wireless charging market exhibits a moderately concentrated landscape, with several major players vying for market share. Tesla Motors, Daimler AG, BMW AG, and Toyota Motor Corporation represent significant players, while smaller companies like OLEV Technologies, Plugless, and HEVO Power contribute to innovation and market competition. The market is characterized by a dynamic interplay of factors including:
- Market Share: While precise figures remain proprietary, Tesla and Daimler are estimated to hold the largest shares, followed by other OEMs and specialized charging solution providers.
- Innovation Ecosystems: The APAC region boasts a vibrant ecosystem of research institutions, startups, and established players, fostering continuous technological advancements in wireless charging technologies, particularly in areas like high-power charging and efficient energy transfer.
- Regulatory Frameworks: Governments across the APAC region are actively shaping policies to promote the adoption of electric vehicles (EVs) and related technologies, including wireless charging. Malaysia's recent initiatives (May 2023) exemplify this trend, emphasizing certification and support for wireless charging infrastructure.
- Substitute Products: While wired charging remains prevalent, wireless charging offers convenience and improved aesthetics, gradually attracting consumers. However, challenges like charging speed and range limitations are providing opportunities for continued innovation.
- End-User Trends: The increasing adoption of EVs, driven by environmental concerns and government incentives, is a primary driver of wireless charging adoption. Consumer demand for seamless and user-friendly charging experiences is shaping product development and market dynamics.
- M&A Activities: The number of mergers and acquisitions in the APAC wireless charging industry has been moderate (xx deals in the last 5 years) but is expected to increase as companies seek strategic partnerships and expand their market reach.
APAC Wireless Charging Industry Industry Insights & Trends
The APAC wireless charging market is experiencing robust growth, propelled by several key factors. The rising adoption of EVs, particularly in China, Japan, and other rapidly developing economies, fuels the demand for convenient and efficient charging solutions. Technological advancements, including improvements in charging efficiency and power output, are further driving market expansion. Consumer preference for seamless and user-friendly experiences is also significantly impacting market dynamics. The market value is expected to reach xx Million by 2033, driven by the increasing sales of EVs and PHEVs. This growth is further supported by advancements in wireless charging technology which improve charging speed and efficiency. The growing focus on reducing carbon emissions and improving air quality is encouraging the government to incentivize EV adoption and the deployment of related infrastructure, which is also fueling the market’s growth.
Key Markets & Segments Leading APAP Wireless Charging Industry
China dominates the APAC wireless charging market, owing to its large EV market and supportive government policies. Japan and India follow closely, showing significant growth potential.
By Vehicle Type:
- Battery Electric Vehicles (BEVs): The BEV segment is the largest and fastest-growing segment, driven by the increasing adoption of fully electric vehicles.
- Plug-in Hybrid Vehicles (PHEVs): The PHEV segment is also exhibiting substantial growth, contributing significantly to the overall market value.
By Country:
- China: China's massive EV market, government incentives, and strong domestic manufacturing base make it the leading market. Drivers include: rapid economic growth, extensive EV infrastructure development, and strong government support for the EV industry.
- Japan: Japan's technological advancements, high EV adoption rates, and focus on energy efficiency make it a key market for wireless charging.
- India: India's growing middle class, increasing urbanization, and government initiatives to promote EVs are driving growth, although infrastructural development lags behind other regions.
- Australia: Australia's focus on sustainable transportation and government incentives for EV adoption are supporting market growth.
- Rest of Asia-Pacific: This region shows considerable potential, with several countries experiencing increasing EV adoption and developing supportive policies.
APAC Wireless Charging Industry Product Developments
Recent innovations focus on enhancing charging speed, efficiency, and compatibility across various EV models. Companies are investing in higher-power charging solutions and developing more robust and reliable systems. The introduction of solutions like ST Microelectronics' 100W Wireless Charging Solution showcases advancements in this area, providing competitive advantages through increased efficiency and faster charging times.
Challenges in the APAP Wireless Charging Industry Market
The APAC wireless charging market faces challenges such as:
- High Initial Investment Costs: Setting up wireless charging infrastructure requires substantial upfront investment.
- Interoperability Issues: Lack of standardization can limit compatibility across different EV models and charging systems.
- Range Limitations: Current wireless charging technologies often have limited effective range, restricting their applicability in certain settings.
- Safety Concerns: Ensuring the safe operation of wireless charging systems is crucial, necessitating robust safety measures.
Forces Driving APAC Wireless Charging Industry Growth
Several factors propel the growth of the APAC wireless charging market:
- Government Incentives: Governments across the region are offering subsidies and tax breaks to promote EV adoption and the development of charging infrastructure.
- Technological Advancements: Ongoing R&D efforts are leading to improved charging speeds, efficiency, and range.
- Rising Environmental Concerns: Growing awareness about climate change is driving the demand for sustainable transportation solutions.
Long-Term Growth Catalysts in the APAC Wireless Charging Industry Market
Long-term growth will be fueled by continuous technological advancements, strategic collaborations between automakers and charging solution providers, and expansion into new markets across the APAC region. The development of more efficient and powerful wireless charging technologies, coupled with supportive government policies, will further accelerate market growth.
Emerging Opportunities in APAC Wireless Charging Industry
Significant opportunities exist in developing standardized wireless charging solutions, expanding into new geographic markets within APAC, and creating integrated smart charging solutions that combine wireless charging with other smart technologies. Focusing on user-friendly interfaces and improving charging speed will also create competitive advantages.
Leading Players in the APAC Wireless Charging Industry Sector
- Tesla Motors
- Daimler AG
- OLEV Technologies
- BMW AG
- Plugless
- Bombardier
- Toyota Motor Corporation
- Nissan
- Hella Aglaia
- HEVO Power
- WiTricity
- Qualcomm
Key Milestones in APAC Wireless Charging Industry Industry
- June 2023: ST Microelectronics unveils 100W Wireless Charging Solution, highlighting advancements in charging technology.
- June 2023: SAIC-GM launches Buick Electra E5 with integrated wireless charging, showcasing industry adoption.
- May 2023: Malaysian government announces significant investment in EV-related infrastructure, including wireless charging systems, demonstrating government support.
Strategic Outlook for APAC Wireless Charging Industry Market
The APAC wireless charging market holds immense potential, driven by increasing EV adoption, technological innovations, and supportive government policies. Strategic partnerships, investments in R&D, and expansion into new markets will be crucial for capturing significant market share and achieving long-term success. The market is poised for substantial growth, offering lucrative opportunities for companies that can effectively address the existing challenges and capitalize on emerging trends.
APAC Wireless Charging Industry Segmentation
-
1. Vehicle Type
- 1.1. Battery Electric Vehicle
- 1.2. Plug-in Hybrid Vehicle
APAC Wireless Charging Industry Segmentation By Geography
-
1. North America
- 1.1. United States
- 1.2. Canada
- 1.3. Mexico
-
2. South America
- 2.1. Brazil
- 2.2. Argentina
- 2.3. Rest of South America
-
3. Europe
- 3.1. United Kingdom
- 3.2. Germany
- 3.3. France
- 3.4. Italy
- 3.5. Spain
- 3.6. Russia
- 3.7. Benelux
- 3.8. Nordics
- 3.9. Rest of Europe
-
4. Middle East & Africa
- 4.1. Turkey
- 4.2. Israel
- 4.3. GCC
- 4.4. North Africa
- 4.5. South Africa
- 4.6. Rest of Middle East & Africa
-
5. Asia Pacific
- 5.1. China
- 5.2. India
- 5.3. Japan
- 5.4. South Korea
- 5.5. ASEAN
- 5.6. Oceania
- 5.7. Rest of Asia Pacific
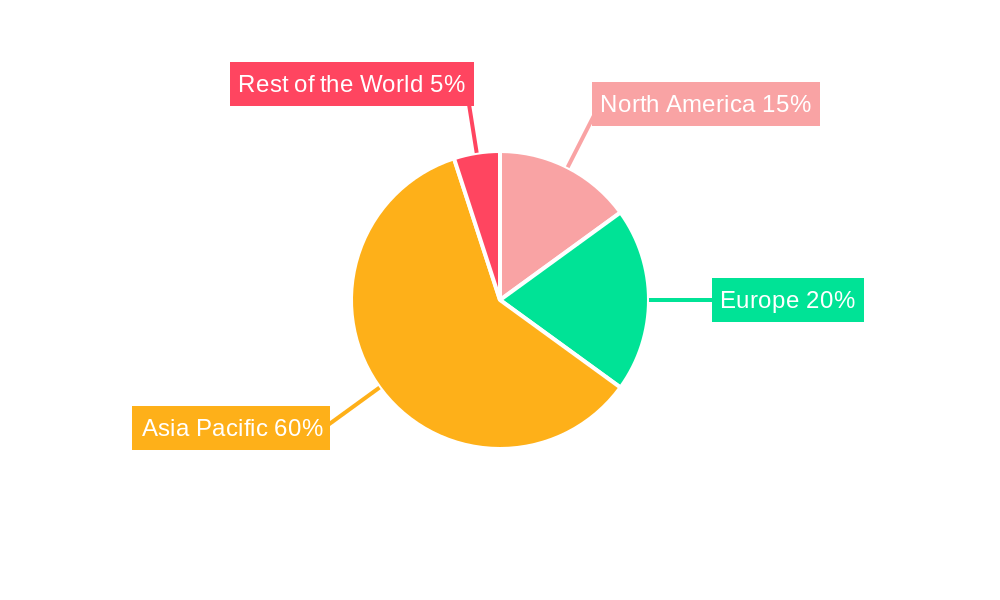
APAC Wireless Charging Industry Regional Market Share
Geographic Coverage of APAC Wireless Charging Industry
APAC Wireless Charging Industry REPORT HIGHLIGHTS
| Aspects | Details |
|---|---|
| Study Period | 2020-2034 |
| Base Year | 2025 |
| Estimated Year | 2026 |
| Forecast Period | 2026-2034 |
| Historical Period | 2020-2025 |
| Growth Rate | CAGR of 36.2% from 2020-2034 |
| Segmentation |
|
Table of Contents
- 1. Introduction
- 1.1. Research Scope
- 1.2. Market Segmentation
- 1.3. Research Objective
- 1.4. Definitions and Assumptions
- 2. Executive Summary
- 2.1. Market Snapshot
- 3. Market Dynamics
- 3.1. Market Drivers
- 3.2. Market Restrains
- 3.3. Market Trends
- 3.4. Market Opportunities
- 4. Market Factor Analysis
- 4.1. Porters Five Forces
- 4.1.1. Bargaining Power of Suppliers
- 4.1.2. Bargaining Power of Buyers
- 4.1.3. Threat of New Entrants
- 4.1.4. Threat of Substitutes
- 4.1.5. Competitive Rivalry
- 4.2. PESTEL analysis
- 4.3. BCG Analysis
- 4.3.1. Stars (High Growth, High Market Share)
- 4.3.2. Cash Cows (Low Growth, High Market Share)
- 4.3.3. Question Mark (High Growth, Low Market Share)
- 4.3.4. Dogs (Low Growth, Low Market Share)
- 4.4. Ansoff Matrix Analysis
- 4.5. Supply Chain Analysis
- 4.6. Regulatory Landscape
- 4.7. Current Market Potential and Opportunity Assessment (TAM–SAM–SOM Framework)
- 4.8. MSR Analyst Note
- 4.1. Porters Five Forces
- 5. Market Analysis, Insights and Forecast 2021-2033
- 5.1. Market Analysis, Insights and Forecast - by Vehicle Type
- 5.1.1. Battery Electric Vehicle
- 5.1.2. Plug-in Hybrid Vehicle
- 5.2. Market Analysis, Insights and Forecast - by Region
- 5.2.1. North America
- 5.2.2. South America
- 5.2.3. Europe
- 5.2.4. Middle East & Africa
- 5.2.5. Asia Pacific
- 5.1. Market Analysis, Insights and Forecast - by Vehicle Type
- 6. Global APAC Wireless Charging Industry Analysis, Insights and Forecast, 2021-2033
- 6.1. Market Analysis, Insights and Forecast - by Vehicle Type
- 6.1.1. Battery Electric Vehicle
- 6.1.2. Plug-in Hybrid Vehicle
- 6.1. Market Analysis, Insights and Forecast - by Vehicle Type
- 7. North America APAC Wireless Charging Industry Analysis, Insights and Forecast, 2020-2032
- 7.1. Market Analysis, Insights and Forecast - by Vehicle Type
- 7.1.1. Battery Electric Vehicle
- 7.1.2. Plug-in Hybrid Vehicle
- 7.1. Market Analysis, Insights and Forecast - by Vehicle Type
- 8. South America APAC Wireless Charging Industry Analysis, Insights and Forecast, 2020-2032
- 8.1. Market Analysis, Insights and Forecast - by Vehicle Type
- 8.1.1. Battery Electric Vehicle
- 8.1.2. Plug-in Hybrid Vehicle
- 8.1. Market Analysis, Insights and Forecast - by Vehicle Type
- 9. Europe APAC Wireless Charging Industry Analysis, Insights and Forecast, 2020-2032
- 9.1. Market Analysis, Insights and Forecast - by Vehicle Type
- 9.1.1. Battery Electric Vehicle
- 9.1.2. Plug-in Hybrid Vehicle
- 9.1. Market Analysis, Insights and Forecast - by Vehicle Type
- 10. Middle East & Africa APAC Wireless Charging Industry Analysis, Insights and Forecast, 2020-2032
- 10.1. Market Analysis, Insights and Forecast - by Vehicle Type
- 10.1.1. Battery Electric Vehicle
- 10.1.2. Plug-in Hybrid Vehicle
- 10.1. Market Analysis, Insights and Forecast - by Vehicle Type
- 11. Asia Pacific APAC Wireless Charging Industry Analysis, Insights and Forecast, 2020-2032
- 11.1. Market Analysis, Insights and Forecast - by Vehicle Type
- 11.1.1. Battery Electric Vehicle
- 11.1.2. Plug-in Hybrid Vehicle
- 11.1. Market Analysis, Insights and Forecast - by Vehicle Type
- 12. Competitive Analysis
- 12.1. Company Profiles
- 12.1.1 Tesla Motors
- 12.1.1.1. Company Overview
- 12.1.1.2. Products
- 12.1.1.3. Company Financials
- 12.1.1.4. SWOT Analysis
- 12.1.2 Daimler AG
- 12.1.2.1. Company Overview
- 12.1.2.2. Products
- 12.1.2.3. Company Financials
- 12.1.2.4. SWOT Analysis
- 12.1.3 OLEV Technologies
- 12.1.3.1. Company Overview
- 12.1.3.2. Products
- 12.1.3.3. Company Financials
- 12.1.3.4. SWOT Analysis
- 12.1.4 BMW AG
- 12.1.4.1. Company Overview
- 12.1.4.2. Products
- 12.1.4.3. Company Financials
- 12.1.4.4. SWOT Analysis
- 12.1.5 Plugless
- 12.1.5.1. Company Overview
- 12.1.5.2. Products
- 12.1.5.3. Company Financials
- 12.1.5.4. SWOT Analysis
- 12.1.6 Bombardier
- 12.1.6.1. Company Overview
- 12.1.6.2. Products
- 12.1.6.3. Company Financials
- 12.1.6.4. SWOT Analysis
- 12.1.7 Toyota Motor Corporation
- 12.1.7.1. Company Overview
- 12.1.7.2. Products
- 12.1.7.3. Company Financials
- 12.1.7.4. SWOT Analysis
- 12.1.8 Nissan
- 12.1.8.1. Company Overview
- 12.1.8.2. Products
- 12.1.8.3. Company Financials
- 12.1.8.4. SWOT Analysis
- 12.1.9 Hella Aglaia
- 12.1.9.1. Company Overview
- 12.1.9.2. Products
- 12.1.9.3. Company Financials
- 12.1.9.4. SWOT Analysis
- 12.1.10 HEVO Powe
- 12.1.10.1. Company Overview
- 12.1.10.2. Products
- 12.1.10.3. Company Financials
- 12.1.10.4. SWOT Analysis
- 12.1.11 WiTricity
- 12.1.11.1. Company Overview
- 12.1.11.2. Products
- 12.1.11.3. Company Financials
- 12.1.11.4. SWOT Analysis
- 12.1.12 Qualcomm
- 12.1.12.1. Company Overview
- 12.1.12.2. Products
- 12.1.12.3. Company Financials
- 12.1.12.4. SWOT Analysis
- 12.1.1 Tesla Motors
- 12.2. Market Entropy
- 12.2.1 Company's Key Areas Served
- 12.2.2 Recent Developments
- 12.3. Company Market Share Analysis 2025
- 12.3.1 Top 5 Companies Market Share Analysis
- 12.3.2 Top 3 Companies Market Share Analysis
- 12.4. List of Potential Customers
- 13. Research Methodology
List of Figures
- Figure 1: Global APAC Wireless Charging Industry Revenue Breakdown (billion, %) by Region 2025 & 2033
- Figure 2: North America APAC Wireless Charging Industry Revenue (billion), by Vehicle Type 2025 & 2033
- Figure 3: North America APAC Wireless Charging Industry Revenue Share (%), by Vehicle Type 2025 & 2033
- Figure 4: North America APAC Wireless Charging Industry Revenue (billion), by Country 2025 & 2033
- Figure 5: North America APAC Wireless Charging Industry Revenue Share (%), by Country 2025 & 2033
- Figure 6: South America APAC Wireless Charging Industry Revenue (billion), by Vehicle Type 2025 & 2033
- Figure 7: South America APAC Wireless Charging Industry Revenue Share (%), by Vehicle Type 2025 & 2033
- Figure 8: South America APAC Wireless Charging Industry Revenue (billion), by Country 2025 & 2033
- Figure 9: South America APAC Wireless Charging Industry Revenue Share (%), by Country 2025 & 2033
- Figure 10: Europe APAC Wireless Charging Industry Revenue (billion), by Vehicle Type 2025 & 2033
- Figure 11: Europe APAC Wireless Charging Industry Revenue Share (%), by Vehicle Type 2025 & 2033
- Figure 12: Europe APAC Wireless Charging Industry Revenue (billion), by Country 2025 & 2033
- Figure 13: Europe APAC Wireless Charging Industry Revenue Share (%), by Country 2025 & 2033
- Figure 14: Middle East & Africa APAC Wireless Charging Industry Revenue (billion), by Vehicle Type 2025 & 2033
- Figure 15: Middle East & Africa APAC Wireless Charging Industry Revenue Share (%), by Vehicle Type 2025 & 2033
- Figure 16: Middle East & Africa APAC Wireless Charging Industry Revenue (billion), by Country 2025 & 2033
- Figure 17: Middle East & Africa APAC Wireless Charging Industry Revenue Share (%), by Country 2025 & 2033
- Figure 18: Asia Pacific APAC Wireless Charging Industry Revenue (billion), by Vehicle Type 2025 & 2033
- Figure 19: Asia Pacific APAC Wireless Charging Industry Revenue Share (%), by Vehicle Type 2025 & 2033
- Figure 20: Asia Pacific APAC Wireless Charging Industry Revenue (billion), by Country 2025 & 2033
- Figure 21: Asia Pacific APAC Wireless Charging Industry Revenue Share (%), by Country 2025 & 2033
List of Tables
- Table 1: Global APAC Wireless Charging Industry Revenue billion Forecast, by Vehicle Type 2020 & 2033
- Table 2: Global APAC Wireless Charging Industry Revenue billion Forecast, by Region 2020 & 2033
- Table 3: Global APAC Wireless Charging Industry Revenue billion Forecast, by Vehicle Type 2020 & 2033
- Table 4: Global APAC Wireless Charging Industry Revenue billion Forecast, by Country 2020 & 2033
- Table 5: United States APAC Wireless Charging Industry Revenue (billion) Forecast, by Application 2020 & 2033
- Table 6: Canada APAC Wireless Charging Industry Revenue (billion) Forecast, by Application 2020 & 2033
- Table 7: Mexico APAC Wireless Charging Industry Revenue (billion) Forecast, by Application 2020 & 2033
- Table 8: Global APAC Wireless Charging Industry Revenue billion Forecast, by Vehicle Type 2020 & 2033
- Table 9: Global APAC Wireless Charging Industry Revenue billion Forecast, by Country 2020 & 2033
- Table 10: Brazil APAC Wireless Charging Industry Revenue (billion) Forecast, by Application 2020 & 2033
- Table 11: Argentina APAC Wireless Charging Industry Revenue (billion) Forecast, by Application 2020 & 2033
- Table 12: Rest of South America APAC Wireless Charging Industry Revenue (billion) Forecast, by Application 2020 & 2033
- Table 13: Global APAC Wireless Charging Industry Revenue billion Forecast, by Vehicle Type 2020 & 2033
- Table 14: Global APAC Wireless Charging Industry Revenue billion Forecast, by Country 2020 & 2033
- Table 15: United Kingdom APAC Wireless Charging Industry Revenue (billion) Forecast, by Application 2020 & 2033
- Table 16: Germany APAC Wireless Charging Industry Revenue (billion) Forecast, by Application 2020 & 2033
- Table 17: France APAC Wireless Charging Industry Revenue (billion) Forecast, by Application 2020 & 2033
- Table 18: Italy APAC Wireless Charging Industry Revenue (billion) Forecast, by Application 2020 & 2033
- Table 19: Spain APAC Wireless Charging Industry Revenue (billion) Forecast, by Application 2020 & 2033
- Table 20: Russia APAC Wireless Charging Industry Revenue (billion) Forecast, by Application 2020 & 2033
- Table 21: Benelux APAC Wireless Charging Industry Revenue (billion) Forecast, by Application 2020 & 2033
- Table 22: Nordics APAC Wireless Charging Industry Revenue (billion) Forecast, by Application 2020 & 2033
- Table 23: Rest of Europe APAC Wireless Charging Industry Revenue (billion) Forecast, by Application 2020 & 2033
- Table 24: Global APAC Wireless Charging Industry Revenue billion Forecast, by Vehicle Type 2020 & 2033
- Table 25: Global APAC Wireless Charging Industry Revenue billion Forecast, by Country 2020 & 2033
- Table 26: Turkey APAC Wireless Charging Industry Revenue (billion) Forecast, by Application 2020 & 2033
- Table 27: Israel APAC Wireless Charging Industry Revenue (billion) Forecast, by Application 2020 & 2033
- Table 28: GCC APAC Wireless Charging Industry Revenue (billion) Forecast, by Application 2020 & 2033
- Table 29: North Africa APAC Wireless Charging Industry Revenue (billion) Forecast, by Application 2020 & 2033
- Table 30: South Africa APAC Wireless Charging Industry Revenue (billion) Forecast, by Application 2020 & 2033
- Table 31: Rest of Middle East & Africa APAC Wireless Charging Industry Revenue (billion) Forecast, by Application 2020 & 2033
- Table 32: Global APAC Wireless Charging Industry Revenue billion Forecast, by Vehicle Type 2020 & 2033
- Table 33: Global APAC Wireless Charging Industry Revenue billion Forecast, by Country 2020 & 2033
- Table 34: China APAC Wireless Charging Industry Revenue (billion) Forecast, by Application 2020 & 2033
- Table 35: India APAC Wireless Charging Industry Revenue (billion) Forecast, by Application 2020 & 2033
- Table 36: Japan APAC Wireless Charging Industry Revenue (billion) Forecast, by Application 2020 & 2033
- Table 37: South Korea APAC Wireless Charging Industry Revenue (billion) Forecast, by Application 2020 & 2033
- Table 38: ASEAN APAC Wireless Charging Industry Revenue (billion) Forecast, by Application 2020 & 2033
- Table 39: Oceania APAC Wireless Charging Industry Revenue (billion) Forecast, by Application 2020 & 2033
- Table 40: Rest of Asia Pacific APAC Wireless Charging Industry Revenue (billion) Forecast, by Application 2020 & 2033
Frequently Asked Questions
1. What is the projected Compound Annual Growth Rate (CAGR) of the APAC Wireless Charging Industry?
The projected CAGR is approximately 36.2%.
2. Which companies are prominent players in the APAC Wireless Charging Industry?
Key companies in the market include Tesla Motors, Daimler AG, OLEV Technologies, BMW AG, Plugless, Bombardier, Toyota Motor Corporation, Nissan, Hella Aglaia, HEVO Powe, WiTricity, Qualcomm.
3. What are the main segments of the APAC Wireless Charging Industry?
The market segments include Vehicle Type.
4. Can you provide details about the market size?
The market size is estimated to be USD 24.4 billion as of 2022.
5. What are some drivers contributing to market growth?
Growing Sales of Electric Vehicles Aiding Market Growth.
6. What are the notable trends driving market growth?
Increasing Sales of Electric Vehicles Driving the Wireless Charging Demand.
7. Are there any restraints impacting market growth?
High Cost of Installing Wireless Chargers.
8. Can you provide examples of recent developments in the market?
June 2023: ST Microelectronics NV unveiled an array of cutting-edge products and solutions for the smart mobility sector during the MWC Shanghai event. Among the highlights was the debut of the ST P-BOX Solution, a groundbreaking technology set to revolutionize autonomous driving. Additionally, the company showcased its 100W Wireless Charging Solution, built upon the STWBC2-HP and STWLC99 platforms.
9. What pricing options are available for accessing the report?
Pricing options include single-user, multi-user, and enterprise licenses priced at USD 4750, USD 4950, and USD 6800 respectively.
10. Is the market size provided in terms of value or volume?
The market size is provided in terms of value, measured in billion.
11. Are there any specific market keywords associated with the report?
Yes, the market keyword associated with the report is "APAC Wireless Charging Industry," which aids in identifying and referencing the specific market segment covered.
12. How do I determine which pricing option suits my needs best?
The pricing options vary based on user requirements and access needs. Individual users may opt for single-user licenses, while businesses requiring broader access may choose multi-user or enterprise licenses for cost-effective access to the report.
13. Are there any additional resources or data provided in the APAC Wireless Charging Industry report?
While the report offers comprehensive insights, it's advisable to review the specific contents or supplementary materials provided to ascertain if additional resources or data are available.
14. How can I stay updated on further developments or reports in the APAC Wireless Charging Industry?
To stay informed about further developments, trends, and reports in the APAC Wireless Charging Industry, consider subscribing to industry newsletters, following relevant companies and organizations, or regularly checking reputable industry news sources and publications.
Methodology
Step 1 - Identification of Relevant Samples Size from Population Database


Step 2 - Approaches for Defining Global Market Size (Value, Volume* & Price*)

Note*: In applicable scenarios
Step 3 - Data Sources
Primary Research
- Web Analytics
- Survey Reports
- Research Institute
- Latest Research Reports
- Opinion Leaders
Secondary Research
- Annual Reports
- White Paper
- Latest Press Release
- Industry Association
- Paid Database
- Investor Presentations

Step 4 - Data Triangulation
Involves using different sources of information in order to increase the validity of a study
These sources are likely to be stakeholders in a program - participants, other researchers, program staff, other community members, and so on.
Then we put all data in single framework & apply various statistical tools to find out the dynamic on the market.
During the analysis stage, feedback from the stakeholder groups would be compared to determine areas of agreement as well as areas of divergence