

Key Insights
The ASEAN chemical logistics market is poised for substantial expansion, fueled by a dynamic chemical industry and a rapidly growing manufacturing sector. Projections indicate a robust 9.53% CAGR, positioning the market at an estimated 47.53 billion by the base year 2025. Key growth catalysts include escalating demand for specialty chemicals, pharmaceuticals, and cosmetics, alongside increasing intra-ASEAN and international trade volumes. The market is segmented by service type (transportation, warehousing, distribution, inventory management, consulting, customs, green logistics), mode of transportation (road, rail, air, water, pipeline), and end-user industry (pharmaceuticals, specialty chemicals, oil & gas, cosmetics). While road transport remains dominant, a growing emphasis on sustainability is expected to drive the adoption of rail and waterway solutions for longer hauls. E-commerce expansion and the imperative for efficient supply chain management are creating significant opportunities for third-party logistics providers (3PLs) and technology-driven solutions. Despite challenges posed by regulatory frameworks and infrastructure variations across ASEAN nations, the market outlook is overwhelmingly positive, with considerable growth anticipated through 2033. Leading players such as DHL, A&R Logistics, and JWD InfoLogistics are strategically positioned to leverage this growth, while specialized entities are carving out distinct market niches.
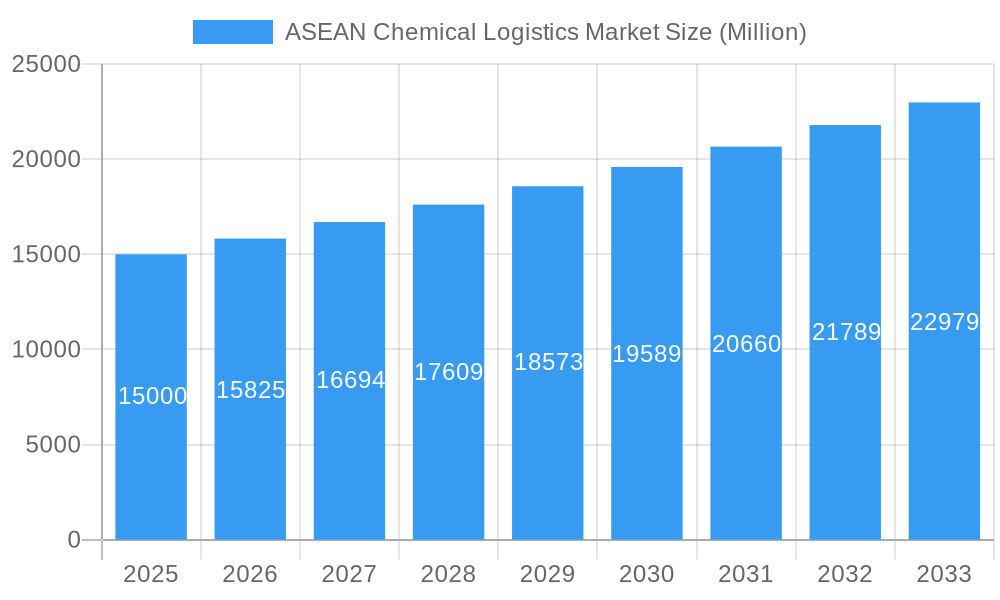
ASEAN Chemical Logistics Market Market Size (In Billion)
The projected market size of 47.53 billion for 2025 serves as a foundational benchmark for future growth trajectories. The identified growth drivers, coupled with the projected 9.53% CAGR, suggest consistent market expansion. Insights from market segmentation highlight specific areas of opportunity, particularly within the pharmaceutical and specialty chemical sectors, which will necessitate specialized logistics, including temperature-controlled transport and secure warehousing. The proliferation of e-commerce across ASEAN will further necessitate enhanced agility and technological sophistication from chemical logistics providers, presenting both challenges and opportunities for innovation and strategic collaborations.
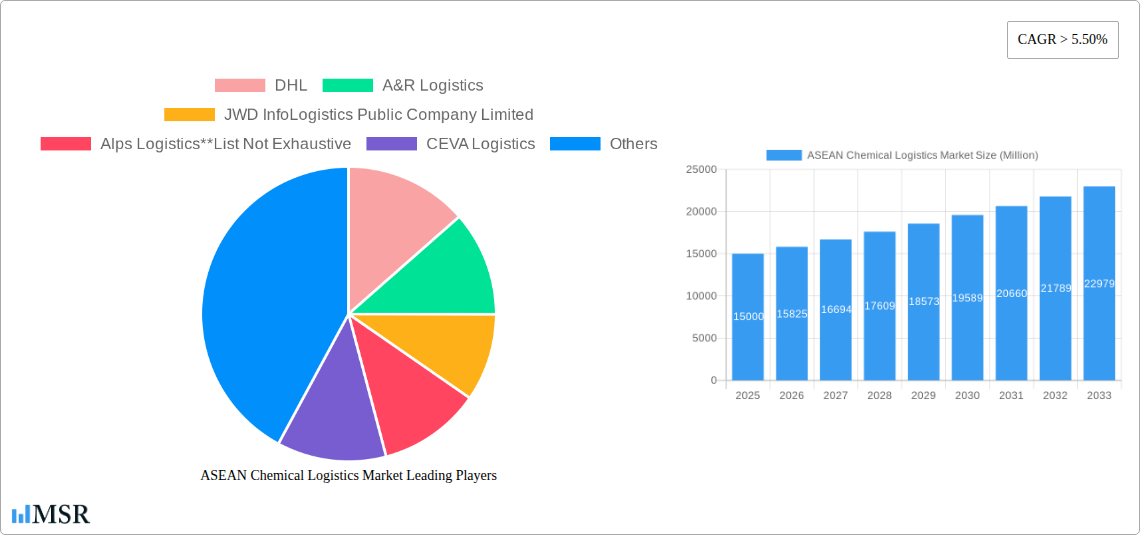
ASEAN Chemical Logistics Market Company Market Share
ASEAN Chemical Logistics Market: A Comprehensive Report (2019-2033)
This in-depth report provides a comprehensive analysis of the ASEAN chemical logistics market, offering invaluable insights for industry stakeholders, investors, and strategic decision-makers. Covering the period from 2019 to 2033, with a focus on 2025, this report unveils the market's dynamics, key segments, leading players, and future growth potential. The study incorporates detailed data and analysis on market size, CAGR, and key industry developments, providing actionable intelligence for navigating this dynamic sector. The report is SEO optimized with high-ranking keywords, ensuring maximum visibility and reach within the target audience.
ASEAN Chemical Logistics Market Market Concentration & Dynamics
The ASEAN chemical logistics market exhibits a moderately concentrated landscape, with several multinational and regional players dominating. Market share distribution is dynamic, influenced by strategic acquisitions and partnerships. The market is characterized by a complex interplay of factors, including evolving regulatory frameworks, innovation in transportation and warehousing technologies, and the increasing demand for specialized services such as green logistics and chemical handling. Substitute products, like alternative transportation modes, pose a level of competitive pressure, though the specialized nature of chemical logistics often limits their impact. End-user trends, driven by burgeoning industries like pharmaceuticals and specialty chemicals, are creating new growth opportunities.
Key Market Dynamics:
- Market Concentration: The top 5 players hold approximately xx% market share in 2025 (estimated).
- Innovation Ecosystems: Significant investments in technology, particularly in warehouse automation and digital logistics platforms.
- Regulatory Frameworks: Stringent regulations regarding the transportation and handling of hazardous materials impact operational costs and strategies.
- M&A Activities: The past five years have witnessed approximately xx M&A deals, indicating consolidation within the sector. This activity is largely driven by the pursuit of economies of scale and geographic expansion.
- End-User Trends: The growing pharmaceutical and specialty chemical industries are major drivers of market growth.
ASEAN Chemical Logistics Market Industry Insights & Trends
The ASEAN chemical logistics market is experiencing robust growth, fueled by the region's expanding manufacturing base, rising industrial production, and increasing cross-border trade. The market size was valued at xx Million in 2025 (estimated) and is projected to reach xx Million by 2033, exhibiting a CAGR of xx% during the forecast period (2025-2033). This growth is further driven by technological advancements such as the adoption of automation, blockchain technology, and data analytics for enhanced efficiency and supply chain visibility. Evolving consumer behaviors, emphasizing sustainability and ethical sourcing, are influencing the demand for green logistics solutions.
Key Markets & Segments Leading ASEAN Chemical Logistics Market
The report identifies several key markets and segments within the ASEAN chemical logistics market. While specific market share data for each segment requires detailed investigation, the following provides an overview.
Dominant Regions/Countries: Singapore, Malaysia, and Thailand are expected to dominate the market due to their well-developed infrastructure and strategic geographic locations.
Dominant Segments:
- By Service: Transportation holds the largest market share, followed by warehousing and distribution. The demand for consulting and management services is also on the rise.
- By Mode of Transportation: Roadways remain the dominant mode due to their extensive network and flexibility, although there's increasing adoption of railways for long-distance transportation of less time-sensitive goods.
- By End User: The pharmaceutical and specialty chemical industries are the largest end-users, driving significant demand.
Growth Drivers:
- Economic Growth: The continued economic expansion of ASEAN countries fuels industrial activity and trade.
- Infrastructure Development: Investments in transportation networks, ports, and logistics hubs enhance efficiency and capacity.
- Government Initiatives: Supportive policies and regulations are encouraging investment in the logistics sector.
ASEAN Chemical Logistics Market Product Developments
Significant advancements in chemical logistics involve the implementation of technologies such as real-time tracking systems, advanced warehouse management systems (WMS), and specialized equipment for handling hazardous materials. These developments aim to improve safety, efficiency, and transparency throughout the supply chain. The integration of IoT sensors and data analytics provide real-time visibility of goods, optimize routes, and minimize delays. This allows logistics providers to offer tailored and efficient services that enhance their competitive advantage.
Challenges in the ASEAN Chemical Logistics Market Market
The ASEAN chemical logistics market faces challenges including regulatory complexities in handling hazardous materials, infrastructure limitations in certain regions, and skilled labor shortages. Supply chain disruptions, particularly those resulting from geopolitical instability, can significantly impact costs and delivery times. Intense competition from established players and emerging startups also presents a challenge. These factors collectively affect the market's profitability and efficiency.
Forces Driving ASEAN Chemical Logistics Market Growth
Key drivers of growth include the increasing adoption of automation and digitalization, boosting efficiency and reducing costs. Furthermore, rising e-commerce and increased cross-border trade are fueling demand for robust and reliable logistics services. Government initiatives promoting infrastructure development and streamlining regulations further support market expansion.
Challenges in the ASEAN Chemical Logistics Market Market
Long-term growth hinges on overcoming challenges such as infrastructure gaps, regulatory harmonization across ASEAN nations, and addressing skills gaps in the workforce. Strategic investments in sustainable practices and technology adoption will be crucial for long-term success. The development of integrated supply chain solutions and partnerships across the region will be essential.
Emerging Opportunities in ASEAN Chemical Logistics Market
Emerging opportunities include the expansion of e-commerce logistics, the growing adoption of green logistics solutions driven by sustainability concerns, and the increasing demand for specialized services such as cold chain logistics for pharmaceuticals. The development of specialized infrastructure for handling hazardous materials, coupled with advancements in data analytics, presents significant opportunities for market players.
Leading Players in the ASEAN Chemical Logistics Market Sector
- DHL
- A&R Logistics
- JWD InfoLogistics Public Company Limited
- Alps Logistics
- CEVA Logistics
- Agility Logistics
- CT Logistics
- Tiong Nam Logistics Holdings BhD
- Eagles Air & Sea
- BDP International
- Rinchem
- Rhenus Logistics
Key Milestones in ASEAN Chemical Logistics Market Industry
- October 2022: Rinchem nears completion of a new chemical warehouse in Malaysia (45,000 sq. ft., 3100 pallet positions).
- February 2022: Leschaco opens a new chemical and dangerous goods warehouse in Port Klang, Malaysia (120,000 sq. ft., 13,000 pallet positions).
- October 2021: Ratanakorn Asset and FLS form a joint venture (FLS Supply Chain Centers) to develop specialized warehouse complexes in Thailand, starting with a 10,000 sq. meter hazardous chemical warehouse in Maptaphut, Rayong.
Strategic Outlook for ASEAN Chemical Logistics Market Market
The ASEAN chemical logistics market presents significant long-term growth potential, driven by regional economic expansion, technological advancements, and increasing demand for specialized services. Companies that embrace innovation, invest in infrastructure, and develop strategic partnerships will be well-positioned to capitalize on the emerging opportunities and navigate the challenges within this dynamic market. A focus on sustainability and regulatory compliance will be increasingly crucial for long-term success.
ASEAN Chemical Logistics Market Segmentation
-
1. Service
- 1.1. Transportation
- 1.2. Warehous
- 1.3. Consulting & Management Services
- 1.4. Customs & Security
- 1.5. Green Logistics
- 1.6. Others
-
2. Mode of Transportation
- 2.1. Roadways
- 2.2. Railways
- 2.3. Airways
- 2.4. Waterways
- 2.5. Pipelines
-
3. End User
- 3.1. Pharmaceutical Industry
- 3.2. Specialty Chemical Industry
- 3.3. Oil and Gas Industry
- 3.4. Cosmetic Industry
- 3.5. Others
-
4. Geography
- 4.1. Singapore
- 4.2. Thailand
- 4.3. Malaysia
- 4.4. Vietnam
- 4.5. Indonesia
- 4.6. Philippines
- 4.7. Rest of ASEAN
ASEAN Chemical Logistics Market Segmentation By Geography
- 1. Singapore
- 2. Thailand
- 3. Malaysia
- 4. Vietnam
- 5. Indonesia
- 6. Philippines
- 7. Rest of ASEAN
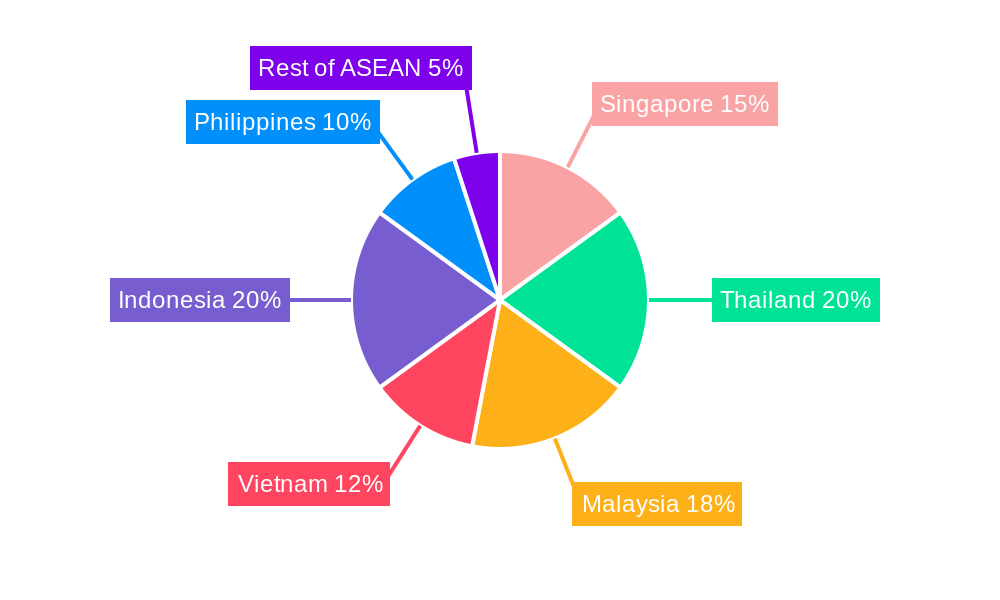
ASEAN Chemical Logistics Market Regional Market Share
Geographic Coverage of ASEAN Chemical Logistics Market
ASEAN Chemical Logistics Market REPORT HIGHLIGHTS
| Aspects | Details |
|---|---|
| Study Period | 2020-2034 |
| Base Year | 2025 |
| Estimated Year | 2026 |
| Forecast Period | 2026-2034 |
| Historical Period | 2020-2025 |
| Growth Rate | CAGR of 9.53% from 2020-2034 |
| Segmentation |
|
Table of Contents
- 1. Introduction
- 1.1. Research Scope
- 1.2. Market Segmentation
- 1.3. Research Objective
- 1.4. Definitions and Assumptions
- 2. Executive Summary
- 2.1. Market Snapshot
- 3. Market Dynamics
- 3.1. Market Drivers
- 3.2. Market Restrains
- 3.3. Market Trends
- 3.4. Market Opportunities
- 4. Market Factor Analysis
- 4.1. Porters Five Forces
- 4.1.1. Bargaining Power of Suppliers
- 4.1.2. Bargaining Power of Buyers
- 4.1.3. Threat of New Entrants
- 4.1.4. Threat of Substitutes
- 4.1.5. Competitive Rivalry
- 4.2. PESTEL analysis
- 4.3. BCG Analysis
- 4.3.1. Stars (High Growth, High Market Share)
- 4.3.2. Cash Cows (Low Growth, High Market Share)
- 4.3.3. Question Mark (High Growth, Low Market Share)
- 4.3.4. Dogs (Low Growth, Low Market Share)
- 4.4. Ansoff Matrix Analysis
- 4.5. Supply Chain Analysis
- 4.6. Regulatory Landscape
- 4.7. Current Market Potential and Opportunity Assessment (TAM–SAM–SOM Framework)
- 4.8. MSR Analyst Note
- 4.1. Porters Five Forces
- 5. Market Analysis, Insights and Forecast 2021-2033
- 5.1. Market Analysis, Insights and Forecast - by Service
- 5.1.1. Transportation
- 5.1.2. Warehous
- 5.1.3. Consulting & Management Services
- 5.1.4. Customs & Security
- 5.1.5. Green Logistics
- 5.1.6. Others
- 5.2. Market Analysis, Insights and Forecast - by Mode of Transportation
- 5.2.1. Roadways
- 5.2.2. Railways
- 5.2.3. Airways
- 5.2.4. Waterways
- 5.2.5. Pipelines
- 5.3. Market Analysis, Insights and Forecast - by End User
- 5.3.1. Pharmaceutical Industry
- 5.3.2. Specialty Chemical Industry
- 5.3.3. Oil and Gas Industry
- 5.3.4. Cosmetic Industry
- 5.3.5. Others
- 5.4. Market Analysis, Insights and Forecast - by Geography
- 5.4.1. Singapore
- 5.4.2. Thailand
- 5.4.3. Malaysia
- 5.4.4. Vietnam
- 5.4.5. Indonesia
- 5.4.6. Philippines
- 5.4.7. Rest of ASEAN
- 5.5. Market Analysis, Insights and Forecast - by Region
- 5.5.1. Singapore
- 5.5.2. Thailand
- 5.5.3. Malaysia
- 5.5.4. Vietnam
- 5.5.5. Indonesia
- 5.5.6. Philippines
- 5.5.7. Rest of ASEAN
- 5.1. Market Analysis, Insights and Forecast - by Service
- 6. Global ASEAN Chemical Logistics Market Analysis, Insights and Forecast, 2021-2033
- 6.1. Market Analysis, Insights and Forecast - by Service
- 6.1.1. Transportation
- 6.1.2. Warehous
- 6.1.3. Consulting & Management Services
- 6.1.4. Customs & Security
- 6.1.5. Green Logistics
- 6.1.6. Others
- 6.2. Market Analysis, Insights and Forecast - by Mode of Transportation
- 6.2.1. Roadways
- 6.2.2. Railways
- 6.2.3. Airways
- 6.2.4. Waterways
- 6.2.5. Pipelines
- 6.3. Market Analysis, Insights and Forecast - by End User
- 6.3.1. Pharmaceutical Industry
- 6.3.2. Specialty Chemical Industry
- 6.3.3. Oil and Gas Industry
- 6.3.4. Cosmetic Industry
- 6.3.5. Others
- 6.4. Market Analysis, Insights and Forecast - by Geography
- 6.4.1. Singapore
- 6.4.2. Thailand
- 6.4.3. Malaysia
- 6.4.4. Vietnam
- 6.4.5. Indonesia
- 6.4.6. Philippines
- 6.4.7. Rest of ASEAN
- 6.1. Market Analysis, Insights and Forecast - by Service
- 7. Singapore ASEAN Chemical Logistics Market Analysis, Insights and Forecast, 2020-2032
- 7.1. Market Analysis, Insights and Forecast - by Service
- 7.1.1. Transportation
- 7.1.2. Warehous
- 7.1.3. Consulting & Management Services
- 7.1.4. Customs & Security
- 7.1.5. Green Logistics
- 7.1.6. Others
- 7.2. Market Analysis, Insights and Forecast - by Mode of Transportation
- 7.2.1. Roadways
- 7.2.2. Railways
- 7.2.3. Airways
- 7.2.4. Waterways
- 7.2.5. Pipelines
- 7.3. Market Analysis, Insights and Forecast - by End User
- 7.3.1. Pharmaceutical Industry
- 7.3.2. Specialty Chemical Industry
- 7.3.3. Oil and Gas Industry
- 7.3.4. Cosmetic Industry
- 7.3.5. Others
- 7.4. Market Analysis, Insights and Forecast - by Geography
- 7.4.1. Singapore
- 7.4.2. Thailand
- 7.4.3. Malaysia
- 7.4.4. Vietnam
- 7.4.5. Indonesia
- 7.4.6. Philippines
- 7.4.7. Rest of ASEAN
- 7.1. Market Analysis, Insights and Forecast - by Service
- 8. Thailand ASEAN Chemical Logistics Market Analysis, Insights and Forecast, 2020-2032
- 8.1. Market Analysis, Insights and Forecast - by Service
- 8.1.1. Transportation
- 8.1.2. Warehous
- 8.1.3. Consulting & Management Services
- 8.1.4. Customs & Security
- 8.1.5. Green Logistics
- 8.1.6. Others
- 8.2. Market Analysis, Insights and Forecast - by Mode of Transportation
- 8.2.1. Roadways
- 8.2.2. Railways
- 8.2.3. Airways
- 8.2.4. Waterways
- 8.2.5. Pipelines
- 8.3. Market Analysis, Insights and Forecast - by End User
- 8.3.1. Pharmaceutical Industry
- 8.3.2. Specialty Chemical Industry
- 8.3.3. Oil and Gas Industry
- 8.3.4. Cosmetic Industry
- 8.3.5. Others
- 8.4. Market Analysis, Insights and Forecast - by Geography
- 8.4.1. Singapore
- 8.4.2. Thailand
- 8.4.3. Malaysia
- 8.4.4. Vietnam
- 8.4.5. Indonesia
- 8.4.6. Philippines
- 8.4.7. Rest of ASEAN
- 8.1. Market Analysis, Insights and Forecast - by Service
- 9. Malaysia ASEAN Chemical Logistics Market Analysis, Insights and Forecast, 2020-2032
- 9.1. Market Analysis, Insights and Forecast - by Service
- 9.1.1. Transportation
- 9.1.2. Warehous
- 9.1.3. Consulting & Management Services
- 9.1.4. Customs & Security
- 9.1.5. Green Logistics
- 9.1.6. Others
- 9.2. Market Analysis, Insights and Forecast - by Mode of Transportation
- 9.2.1. Roadways
- 9.2.2. Railways
- 9.2.3. Airways
- 9.2.4. Waterways
- 9.2.5. Pipelines
- 9.3. Market Analysis, Insights and Forecast - by End User
- 9.3.1. Pharmaceutical Industry
- 9.3.2. Specialty Chemical Industry
- 9.3.3. Oil and Gas Industry
- 9.3.4. Cosmetic Industry
- 9.3.5. Others
- 9.4. Market Analysis, Insights and Forecast - by Geography
- 9.4.1. Singapore
- 9.4.2. Thailand
- 9.4.3. Malaysia
- 9.4.4. Vietnam
- 9.4.5. Indonesia
- 9.4.6. Philippines
- 9.4.7. Rest of ASEAN
- 9.1. Market Analysis, Insights and Forecast - by Service
- 10. Vietnam ASEAN Chemical Logistics Market Analysis, Insights and Forecast, 2020-2032
- 10.1. Market Analysis, Insights and Forecast - by Service
- 10.1.1. Transportation
- 10.1.2. Warehous
- 10.1.3. Consulting & Management Services
- 10.1.4. Customs & Security
- 10.1.5. Green Logistics
- 10.1.6. Others
- 10.2. Market Analysis, Insights and Forecast - by Mode of Transportation
- 10.2.1. Roadways
- 10.2.2. Railways
- 10.2.3. Airways
- 10.2.4. Waterways
- 10.2.5. Pipelines
- 10.3. Market Analysis, Insights and Forecast - by End User
- 10.3.1. Pharmaceutical Industry
- 10.3.2. Specialty Chemical Industry
- 10.3.3. Oil and Gas Industry
- 10.3.4. Cosmetic Industry
- 10.3.5. Others
- 10.4. Market Analysis, Insights and Forecast - by Geography
- 10.4.1. Singapore
- 10.4.2. Thailand
- 10.4.3. Malaysia
- 10.4.4. Vietnam
- 10.4.5. Indonesia
- 10.4.6. Philippines
- 10.4.7. Rest of ASEAN
- 10.1. Market Analysis, Insights and Forecast - by Service
- 11. Indonesia ASEAN Chemical Logistics Market Analysis, Insights and Forecast, 2020-2032
- 11.1. Market Analysis, Insights and Forecast - by Service
- 11.1.1. Transportation
- 11.1.2. Warehous
- 11.1.3. Consulting & Management Services
- 11.1.4. Customs & Security
- 11.1.5. Green Logistics
- 11.1.6. Others
- 11.2. Market Analysis, Insights and Forecast - by Mode of Transportation
- 11.2.1. Roadways
- 11.2.2. Railways
- 11.2.3. Airways
- 11.2.4. Waterways
- 11.2.5. Pipelines
- 11.3. Market Analysis, Insights and Forecast - by End User
- 11.3.1. Pharmaceutical Industry
- 11.3.2. Specialty Chemical Industry
- 11.3.3. Oil and Gas Industry
- 11.3.4. Cosmetic Industry
- 11.3.5. Others
- 11.4. Market Analysis, Insights and Forecast - by Geography
- 11.4.1. Singapore
- 11.4.2. Thailand
- 11.4.3. Malaysia
- 11.4.4. Vietnam
- 11.4.5. Indonesia
- 11.4.6. Philippines
- 11.4.7. Rest of ASEAN
- 11.1. Market Analysis, Insights and Forecast - by Service
- 12. Philippines ASEAN Chemical Logistics Market Analysis, Insights and Forecast, 2020-2032
- 12.1. Market Analysis, Insights and Forecast - by Service
- 12.1.1. Transportation
- 12.1.2. Warehous
- 12.1.3. Consulting & Management Services
- 12.1.4. Customs & Security
- 12.1.5. Green Logistics
- 12.1.6. Others
- 12.2. Market Analysis, Insights and Forecast - by Mode of Transportation
- 12.2.1. Roadways
- 12.2.2. Railways
- 12.2.3. Airways
- 12.2.4. Waterways
- 12.2.5. Pipelines
- 12.3. Market Analysis, Insights and Forecast - by End User
- 12.3.1. Pharmaceutical Industry
- 12.3.2. Specialty Chemical Industry
- 12.3.3. Oil and Gas Industry
- 12.3.4. Cosmetic Industry
- 12.3.5. Others
- 12.4. Market Analysis, Insights and Forecast - by Geography
- 12.4.1. Singapore
- 12.4.2. Thailand
- 12.4.3. Malaysia
- 12.4.4. Vietnam
- 12.4.5. Indonesia
- 12.4.6. Philippines
- 12.4.7. Rest of ASEAN
- 12.1. Market Analysis, Insights and Forecast - by Service
- 13. Rest of ASEAN ASEAN Chemical Logistics Market Analysis, Insights and Forecast, 2020-2032
- 13.1. Market Analysis, Insights and Forecast - by Service
- 13.1.1. Transportation
- 13.1.2. Warehous
- 13.1.3. Consulting & Management Services
- 13.1.4. Customs & Security
- 13.1.5. Green Logistics
- 13.1.6. Others
- 13.2. Market Analysis, Insights and Forecast - by Mode of Transportation
- 13.2.1. Roadways
- 13.2.2. Railways
- 13.2.3. Airways
- 13.2.4. Waterways
- 13.2.5. Pipelines
- 13.3. Market Analysis, Insights and Forecast - by End User
- 13.3.1. Pharmaceutical Industry
- 13.3.2. Specialty Chemical Industry
- 13.3.3. Oil and Gas Industry
- 13.3.4. Cosmetic Industry
- 13.3.5. Others
- 13.4. Market Analysis, Insights and Forecast - by Geography
- 13.4.1. Singapore
- 13.4.2. Thailand
- 13.4.3. Malaysia
- 13.4.4. Vietnam
- 13.4.5. Indonesia
- 13.4.6. Philippines
- 13.4.7. Rest of ASEAN
- 13.1. Market Analysis, Insights and Forecast - by Service
- 14. Competitive Analysis
- 14.1. Company Profiles
- 14.1.1 DHL
- 14.1.1.1. Company Overview
- 14.1.1.2. Products
- 14.1.1.3. Company Financials
- 14.1.1.4. SWOT Analysis
- 14.1.2 A&R Logistics
- 14.1.2.1. Company Overview
- 14.1.2.2. Products
- 14.1.2.3. Company Financials
- 14.1.2.4. SWOT Analysis
- 14.1.3 JWD InfoLogistics Public Company Limited
- 14.1.3.1. Company Overview
- 14.1.3.2. Products
- 14.1.3.3. Company Financials
- 14.1.3.4. SWOT Analysis
- 14.1.4 Alps Logistics**List Not Exhaustive
- 14.1.4.1. Company Overview
- 14.1.4.2. Products
- 14.1.4.3. Company Financials
- 14.1.4.4. SWOT Analysis
- 14.1.5 CEVA Logistics
- 14.1.5.1. Company Overview
- 14.1.5.2. Products
- 14.1.5.3. Company Financials
- 14.1.5.4. SWOT Analysis
- 14.1.6 Agility Logistics
- 14.1.6.1. Company Overview
- 14.1.6.2. Products
- 14.1.6.3. Company Financials
- 14.1.6.4. SWOT Analysis
- 14.1.7 CT Logistics
- 14.1.7.1. Company Overview
- 14.1.7.2. Products
- 14.1.7.3. Company Financials
- 14.1.7.4. SWOT Analysis
- 14.1.8 Tiong Nam Logistics Holdings BhD
- 14.1.8.1. Company Overview
- 14.1.8.2. Products
- 14.1.8.3. Company Financials
- 14.1.8.4. SWOT Analysis
- 14.1.9 Eagles Air & Sea
- 14.1.9.1. Company Overview
- 14.1.9.2. Products
- 14.1.9.3. Company Financials
- 14.1.9.4. SWOT Analysis
- 14.1.10 BDP International
- 14.1.10.1. Company Overview
- 14.1.10.2. Products
- 14.1.10.3. Company Financials
- 14.1.10.4. SWOT Analysis
- 14.1.11 Rinchem
- 14.1.11.1. Company Overview
- 14.1.11.2. Products
- 14.1.11.3. Company Financials
- 14.1.11.4. SWOT Analysis
- 14.1.12 Rhenus Logistics
- 14.1.12.1. Company Overview
- 14.1.12.2. Products
- 14.1.12.3. Company Financials
- 14.1.12.4. SWOT Analysis
- 14.1.1 DHL
- 14.2. Market Entropy
- 14.2.1 Company's Key Areas Served
- 14.2.2 Recent Developments
- 14.3. Company Market Share Analysis 2025
- 14.3.1 Top 5 Companies Market Share Analysis
- 14.3.2 Top 3 Companies Market Share Analysis
- 14.4. List of Potential Customers
- 15. Research Methodology
List of Figures
- Figure 1: Global ASEAN Chemical Logistics Market Revenue Breakdown (billion, %) by Region 2025 & 2033
- Figure 2: Singapore ASEAN Chemical Logistics Market Revenue (billion), by Service 2025 & 2033
- Figure 3: Singapore ASEAN Chemical Logistics Market Revenue Share (%), by Service 2025 & 2033
- Figure 4: Singapore ASEAN Chemical Logistics Market Revenue (billion), by Mode of Transportation 2025 & 2033
- Figure 5: Singapore ASEAN Chemical Logistics Market Revenue Share (%), by Mode of Transportation 2025 & 2033
- Figure 6: Singapore ASEAN Chemical Logistics Market Revenue (billion), by End User 2025 & 2033
- Figure 7: Singapore ASEAN Chemical Logistics Market Revenue Share (%), by End User 2025 & 2033
- Figure 8: Singapore ASEAN Chemical Logistics Market Revenue (billion), by Geography 2025 & 2033
- Figure 9: Singapore ASEAN Chemical Logistics Market Revenue Share (%), by Geography 2025 & 2033
- Figure 10: Singapore ASEAN Chemical Logistics Market Revenue (billion), by Country 2025 & 2033
- Figure 11: Singapore ASEAN Chemical Logistics Market Revenue Share (%), by Country 2025 & 2033
- Figure 12: Thailand ASEAN Chemical Logistics Market Revenue (billion), by Service 2025 & 2033
- Figure 13: Thailand ASEAN Chemical Logistics Market Revenue Share (%), by Service 2025 & 2033
- Figure 14: Thailand ASEAN Chemical Logistics Market Revenue (billion), by Mode of Transportation 2025 & 2033
- Figure 15: Thailand ASEAN Chemical Logistics Market Revenue Share (%), by Mode of Transportation 2025 & 2033
- Figure 16: Thailand ASEAN Chemical Logistics Market Revenue (billion), by End User 2025 & 2033
- Figure 17: Thailand ASEAN Chemical Logistics Market Revenue Share (%), by End User 2025 & 2033
- Figure 18: Thailand ASEAN Chemical Logistics Market Revenue (billion), by Geography 2025 & 2033
- Figure 19: Thailand ASEAN Chemical Logistics Market Revenue Share (%), by Geography 2025 & 2033
- Figure 20: Thailand ASEAN Chemical Logistics Market Revenue (billion), by Country 2025 & 2033
- Figure 21: Thailand ASEAN Chemical Logistics Market Revenue Share (%), by Country 2025 & 2033
- Figure 22: Malaysia ASEAN Chemical Logistics Market Revenue (billion), by Service 2025 & 2033
- Figure 23: Malaysia ASEAN Chemical Logistics Market Revenue Share (%), by Service 2025 & 2033
- Figure 24: Malaysia ASEAN Chemical Logistics Market Revenue (billion), by Mode of Transportation 2025 & 2033
- Figure 25: Malaysia ASEAN Chemical Logistics Market Revenue Share (%), by Mode of Transportation 2025 & 2033
- Figure 26: Malaysia ASEAN Chemical Logistics Market Revenue (billion), by End User 2025 & 2033
- Figure 27: Malaysia ASEAN Chemical Logistics Market Revenue Share (%), by End User 2025 & 2033
- Figure 28: Malaysia ASEAN Chemical Logistics Market Revenue (billion), by Geography 2025 & 2033
- Figure 29: Malaysia ASEAN Chemical Logistics Market Revenue Share (%), by Geography 2025 & 2033
- Figure 30: Malaysia ASEAN Chemical Logistics Market Revenue (billion), by Country 2025 & 2033
- Figure 31: Malaysia ASEAN Chemical Logistics Market Revenue Share (%), by Country 2025 & 2033
- Figure 32: Vietnam ASEAN Chemical Logistics Market Revenue (billion), by Service 2025 & 2033
- Figure 33: Vietnam ASEAN Chemical Logistics Market Revenue Share (%), by Service 2025 & 2033
- Figure 34: Vietnam ASEAN Chemical Logistics Market Revenue (billion), by Mode of Transportation 2025 & 2033
- Figure 35: Vietnam ASEAN Chemical Logistics Market Revenue Share (%), by Mode of Transportation 2025 & 2033
- Figure 36: Vietnam ASEAN Chemical Logistics Market Revenue (billion), by End User 2025 & 2033
- Figure 37: Vietnam ASEAN Chemical Logistics Market Revenue Share (%), by End User 2025 & 2033
- Figure 38: Vietnam ASEAN Chemical Logistics Market Revenue (billion), by Geography 2025 & 2033
- Figure 39: Vietnam ASEAN Chemical Logistics Market Revenue Share (%), by Geography 2025 & 2033
- Figure 40: Vietnam ASEAN Chemical Logistics Market Revenue (billion), by Country 2025 & 2033
- Figure 41: Vietnam ASEAN Chemical Logistics Market Revenue Share (%), by Country 2025 & 2033
- Figure 42: Indonesia ASEAN Chemical Logistics Market Revenue (billion), by Service 2025 & 2033
- Figure 43: Indonesia ASEAN Chemical Logistics Market Revenue Share (%), by Service 2025 & 2033
- Figure 44: Indonesia ASEAN Chemical Logistics Market Revenue (billion), by Mode of Transportation 2025 & 2033
- Figure 45: Indonesia ASEAN Chemical Logistics Market Revenue Share (%), by Mode of Transportation 2025 & 2033
- Figure 46: Indonesia ASEAN Chemical Logistics Market Revenue (billion), by End User 2025 & 2033
- Figure 47: Indonesia ASEAN Chemical Logistics Market Revenue Share (%), by End User 2025 & 2033
- Figure 48: Indonesia ASEAN Chemical Logistics Market Revenue (billion), by Geography 2025 & 2033
- Figure 49: Indonesia ASEAN Chemical Logistics Market Revenue Share (%), by Geography 2025 & 2033
- Figure 50: Indonesia ASEAN Chemical Logistics Market Revenue (billion), by Country 2025 & 2033
- Figure 51: Indonesia ASEAN Chemical Logistics Market Revenue Share (%), by Country 2025 & 2033
- Figure 52: Philippines ASEAN Chemical Logistics Market Revenue (billion), by Service 2025 & 2033
- Figure 53: Philippines ASEAN Chemical Logistics Market Revenue Share (%), by Service 2025 & 2033
- Figure 54: Philippines ASEAN Chemical Logistics Market Revenue (billion), by Mode of Transportation 2025 & 2033
- Figure 55: Philippines ASEAN Chemical Logistics Market Revenue Share (%), by Mode of Transportation 2025 & 2033
- Figure 56: Philippines ASEAN Chemical Logistics Market Revenue (billion), by End User 2025 & 2033
- Figure 57: Philippines ASEAN Chemical Logistics Market Revenue Share (%), by End User 2025 & 2033
- Figure 58: Philippines ASEAN Chemical Logistics Market Revenue (billion), by Geography 2025 & 2033
- Figure 59: Philippines ASEAN Chemical Logistics Market Revenue Share (%), by Geography 2025 & 2033
- Figure 60: Philippines ASEAN Chemical Logistics Market Revenue (billion), by Country 2025 & 2033
- Figure 61: Philippines ASEAN Chemical Logistics Market Revenue Share (%), by Country 2025 & 2033
- Figure 62: Rest of ASEAN ASEAN Chemical Logistics Market Revenue (billion), by Service 2025 & 2033
- Figure 63: Rest of ASEAN ASEAN Chemical Logistics Market Revenue Share (%), by Service 2025 & 2033
- Figure 64: Rest of ASEAN ASEAN Chemical Logistics Market Revenue (billion), by Mode of Transportation 2025 & 2033
- Figure 65: Rest of ASEAN ASEAN Chemical Logistics Market Revenue Share (%), by Mode of Transportation 2025 & 2033
- Figure 66: Rest of ASEAN ASEAN Chemical Logistics Market Revenue (billion), by End User 2025 & 2033
- Figure 67: Rest of ASEAN ASEAN Chemical Logistics Market Revenue Share (%), by End User 2025 & 2033
- Figure 68: Rest of ASEAN ASEAN Chemical Logistics Market Revenue (billion), by Geography 2025 & 2033
- Figure 69: Rest of ASEAN ASEAN Chemical Logistics Market Revenue Share (%), by Geography 2025 & 2033
- Figure 70: Rest of ASEAN ASEAN Chemical Logistics Market Revenue (billion), by Country 2025 & 2033
- Figure 71: Rest of ASEAN ASEAN Chemical Logistics Market Revenue Share (%), by Country 2025 & 2033
List of Tables
- Table 1: Global ASEAN Chemical Logistics Market Revenue billion Forecast, by Service 2020 & 2033
- Table 2: Global ASEAN Chemical Logistics Market Revenue billion Forecast, by Mode of Transportation 2020 & 2033
- Table 3: Global ASEAN Chemical Logistics Market Revenue billion Forecast, by End User 2020 & 2033
- Table 4: Global ASEAN Chemical Logistics Market Revenue billion Forecast, by Geography 2020 & 2033
- Table 5: Global ASEAN Chemical Logistics Market Revenue billion Forecast, by Region 2020 & 2033
- Table 6: Global ASEAN Chemical Logistics Market Revenue billion Forecast, by Service 2020 & 2033
- Table 7: Global ASEAN Chemical Logistics Market Revenue billion Forecast, by Mode of Transportation 2020 & 2033
- Table 8: Global ASEAN Chemical Logistics Market Revenue billion Forecast, by End User 2020 & 2033
- Table 9: Global ASEAN Chemical Logistics Market Revenue billion Forecast, by Geography 2020 & 2033
- Table 10: Global ASEAN Chemical Logistics Market Revenue billion Forecast, by Country 2020 & 2033
- Table 11: Global ASEAN Chemical Logistics Market Revenue billion Forecast, by Service 2020 & 2033
- Table 12: Global ASEAN Chemical Logistics Market Revenue billion Forecast, by Mode of Transportation 2020 & 2033
- Table 13: Global ASEAN Chemical Logistics Market Revenue billion Forecast, by End User 2020 & 2033
- Table 14: Global ASEAN Chemical Logistics Market Revenue billion Forecast, by Geography 2020 & 2033
- Table 15: Global ASEAN Chemical Logistics Market Revenue billion Forecast, by Country 2020 & 2033
- Table 16: Global ASEAN Chemical Logistics Market Revenue billion Forecast, by Service 2020 & 2033
- Table 17: Global ASEAN Chemical Logistics Market Revenue billion Forecast, by Mode of Transportation 2020 & 2033
- Table 18: Global ASEAN Chemical Logistics Market Revenue billion Forecast, by End User 2020 & 2033
- Table 19: Global ASEAN Chemical Logistics Market Revenue billion Forecast, by Geography 2020 & 2033
- Table 20: Global ASEAN Chemical Logistics Market Revenue billion Forecast, by Country 2020 & 2033
- Table 21: Global ASEAN Chemical Logistics Market Revenue billion Forecast, by Service 2020 & 2033
- Table 22: Global ASEAN Chemical Logistics Market Revenue billion Forecast, by Mode of Transportation 2020 & 2033
- Table 23: Global ASEAN Chemical Logistics Market Revenue billion Forecast, by End User 2020 & 2033
- Table 24: Global ASEAN Chemical Logistics Market Revenue billion Forecast, by Geography 2020 & 2033
- Table 25: Global ASEAN Chemical Logistics Market Revenue billion Forecast, by Country 2020 & 2033
- Table 26: Global ASEAN Chemical Logistics Market Revenue billion Forecast, by Service 2020 & 2033
- Table 27: Global ASEAN Chemical Logistics Market Revenue billion Forecast, by Mode of Transportation 2020 & 2033
- Table 28: Global ASEAN Chemical Logistics Market Revenue billion Forecast, by End User 2020 & 2033
- Table 29: Global ASEAN Chemical Logistics Market Revenue billion Forecast, by Geography 2020 & 2033
- Table 30: Global ASEAN Chemical Logistics Market Revenue billion Forecast, by Country 2020 & 2033
- Table 31: Global ASEAN Chemical Logistics Market Revenue billion Forecast, by Service 2020 & 2033
- Table 32: Global ASEAN Chemical Logistics Market Revenue billion Forecast, by Mode of Transportation 2020 & 2033
- Table 33: Global ASEAN Chemical Logistics Market Revenue billion Forecast, by End User 2020 & 2033
- Table 34: Global ASEAN Chemical Logistics Market Revenue billion Forecast, by Geography 2020 & 2033
- Table 35: Global ASEAN Chemical Logistics Market Revenue billion Forecast, by Country 2020 & 2033
- Table 36: Global ASEAN Chemical Logistics Market Revenue billion Forecast, by Service 2020 & 2033
- Table 37: Global ASEAN Chemical Logistics Market Revenue billion Forecast, by Mode of Transportation 2020 & 2033
- Table 38: Global ASEAN Chemical Logistics Market Revenue billion Forecast, by End User 2020 & 2033
- Table 39: Global ASEAN Chemical Logistics Market Revenue billion Forecast, by Geography 2020 & 2033
- Table 40: Global ASEAN Chemical Logistics Market Revenue billion Forecast, by Country 2020 & 2033
Frequently Asked Questions
1. What is the projected Compound Annual Growth Rate (CAGR) of the ASEAN Chemical Logistics Market?
The projected CAGR is approximately 9.53%.
2. Which companies are prominent players in the ASEAN Chemical Logistics Market?
Key companies in the market include DHL, A&R Logistics, JWD InfoLogistics Public Company Limited, Alps Logistics**List Not Exhaustive, CEVA Logistics, Agility Logistics, CT Logistics, Tiong Nam Logistics Holdings BhD, Eagles Air & Sea, BDP International, Rinchem, Rhenus Logistics.
3. What are the main segments of the ASEAN Chemical Logistics Market?
The market segments include Service, Mode of Transportation, End User, Geography.
4. Can you provide details about the market size?
The market size is estimated to be USD 47.53 billion as of 2022.
5. What are some drivers contributing to market growth?
The Rise in Demand for Specialty Chemicals in ASEAN Countries Increasing Trade Logistics Activity; Partnerships and Collaborations Between Major Players in the Chemical Logistics Market are Being Formed for the Creation of Innovative Goods and Technologically Enhanced Services.
6. What are the notable trends driving market growth?
The Rise in Chemical Production is Expected to Propel the Growth of the Chemical Logistics Market.
7. Are there any restraints impacting market growth?
Complexities Related to Chemical Logistics; High Cost Involved in the Transportation of Chemicals.
8. Can you provide examples of recent developments in the market?
October 2022: Rinchem is nearing the completion of a brand-new chemical warehouse based in Malaysia slated to be ready in Q2 of 2023. While the company currently has two other warehouses in the Asia Pacific (Taiwan & South Korea), this will be Rinchem's first warehouse located in Malaysia. The 45,000 sq. ft. dangerous goods warehouse will have the capacity to store 3100 pallet positions. Rinchem's warehouses are custom-built to support the proper segregation of various hazard classes and to offer multiple temperature zones.
9. What pricing options are available for accessing the report?
Pricing options include single-user, multi-user, and enterprise licenses priced at USD 4750, USD 5250, and USD 8750 respectively.
10. Is the market size provided in terms of value or volume?
The market size is provided in terms of value, measured in billion.
11. Are there any specific market keywords associated with the report?
Yes, the market keyword associated with the report is "ASEAN Chemical Logistics Market," which aids in identifying and referencing the specific market segment covered.
12. How do I determine which pricing option suits my needs best?
The pricing options vary based on user requirements and access needs. Individual users may opt for single-user licenses, while businesses requiring broader access may choose multi-user or enterprise licenses for cost-effective access to the report.
13. Are there any additional resources or data provided in the ASEAN Chemical Logistics Market report?
While the report offers comprehensive insights, it's advisable to review the specific contents or supplementary materials provided to ascertain if additional resources or data are available.
14. How can I stay updated on further developments or reports in the ASEAN Chemical Logistics Market?
To stay informed about further developments, trends, and reports in the ASEAN Chemical Logistics Market, consider subscribing to industry newsletters, following relevant companies and organizations, or regularly checking reputable industry news sources and publications.
Methodology
Step 1 - Identification of Relevant Samples Size from Population Database


Step 2 - Approaches for Defining Global Market Size (Value, Volume* & Price*)

Note*: In applicable scenarios
Step 3 - Data Sources
Primary Research
- Web Analytics
- Survey Reports
- Research Institute
- Latest Research Reports
- Opinion Leaders
Secondary Research
- Annual Reports
- White Paper
- Latest Press Release
- Industry Association
- Paid Database
- Investor Presentations

Step 4 - Data Triangulation
Involves using different sources of information in order to increase the validity of a study
These sources are likely to be stakeholders in a program - participants, other researchers, program staff, other community members, and so on.
Then we put all data in single framework & apply various statistical tools to find out the dynamic on the market.
During the analysis stage, feedback from the stakeholder groups would be compared to determine areas of agreement as well as areas of divergence