

Key Insights
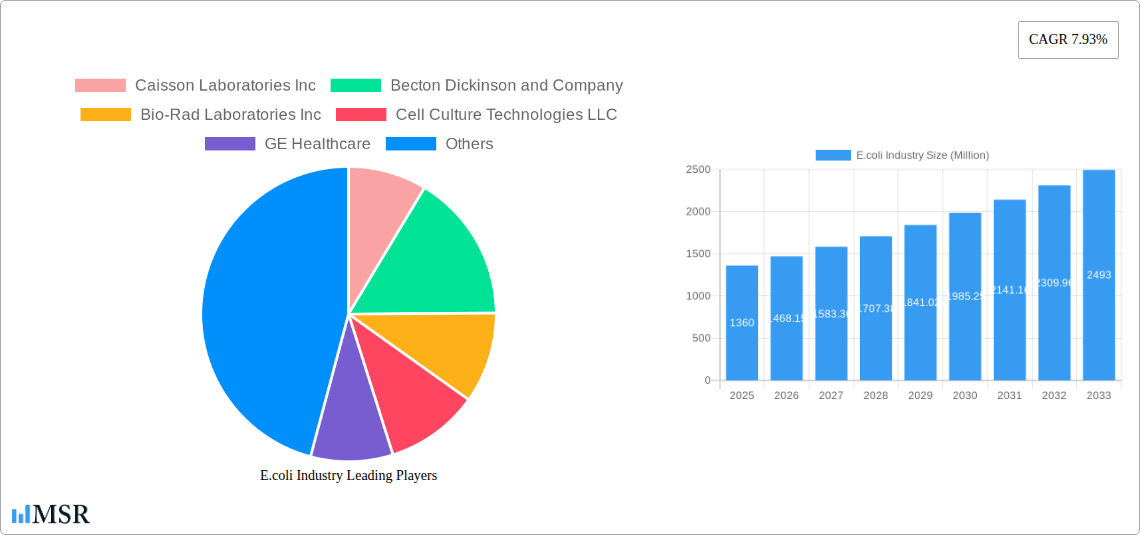
The E. coli testing market, valued at $1.36 billion in 2025, is projected to experience robust growth, driven by a Compound Annual Growth Rate (CAGR) of 7.93% from 2025 to 2033. This expansion is fueled by several key factors. The increasing prevalence of foodborne illnesses linked to E. coli contamination necessitates stringent testing protocols across the food processing and agricultural sectors. Furthermore, the rising demand for safe and high-quality food products globally is driving regulatory pressure on manufacturers to implement rigorous quality control measures, significantly increasing the demand for E. coli testing services. Advancements in testing technologies, such as rapid diagnostic assays and automated systems, are improving accuracy, speed, and efficiency, further contributing to market growth. The growth is also supported by increasing government initiatives to strengthen food safety regulations and surveillance programs, and the rising prevalence of E. coli infections in healthcare settings, necessitating prompt and accurate diagnosis for effective treatment. The market segmentation reflects the diverse applications of E. coli testing, with clinical testing and environmental testing representing major segments. The clinical testing segment benefits from the increasing incidences of E. coli infections, while environmental monitoring is crucial for ensuring food and water safety. Key players like Becton Dickinson, Bio-Rad Laboratories, and Merck & Co. are driving innovation and expansion within the market through new product development and strategic partnerships. The geographic distribution of the market shows a strong presence across North America and Europe, with Asia-Pacific poised for significant growth in the coming years.
The market's trajectory is expected to remain positive due to continuous technological enhancements, stringent regulatory frameworks, and heightened consumer awareness about food safety. However, factors such as the high cost associated with advanced testing technologies and a lack of awareness in certain regions might present minor challenges. Nevertheless, the ongoing demand for reliable and accurate E. coli testing, coupled with the sustained investment in research and development within the industry, signifies a promising outlook for the market's future expansion. The competitive landscape, while already dense with established players, offers opportunities for smaller companies to focus on niche segments and leverage specialized testing methods to gain a foothold in the market.
E.coli Industry Market Report: 2019-2033
This comprehensive report provides a detailed analysis of the E.coli industry, covering market dynamics, key players, technological advancements, and future growth prospects. The study period spans from 2019 to 2033, with 2025 serving as the base and estimated year. The report is invaluable for industry stakeholders, investors, and researchers seeking to understand and capitalize on opportunities within this dynamic market, projected to reach xx Million by 2033.
E.coli Industry Market Concentration & Dynamics
The E.coli industry exhibits a moderately concentrated market structure, with several major players holding significant market share. The industry is characterized by a dynamic interplay of innovation, regulatory oversight, and competitive pressures. Key aspects driving market dynamics include:
Market Share: While precise market share figures for individual companies are proprietary, leading players like Becton Dickinson and Company, Bio-Rad Laboratories Inc, and GE Healthcare are estimated to collectively hold over xx% of the market. Smaller players such as Caisson Laboratories Inc, Cell Culture Technologies LLC, Lonza Group Ltd, HiMedia Laboratories Pvt Ltd, Merck & Co Inc, Corning Incorporated, and Fujifilm Holdings Corporation contribute significantly to market fragmentation. The List is Not Exhaustive.
Innovation Ecosystem: Continuous advancements in diagnostic technologies, such as the development of highly sensitive E.coli detection kits (as seen with IIT Kanpur’s June 2022 development), fuel market growth. Research institutions like Michigan State University actively contribute to the fundamental understanding of E.coli behavior, shaping industry practices.
Regulatory Frameworks: Stringent regulatory standards governing diagnostic testing and environmental monitoring significantly influence industry practices and necessitate continuous compliance efforts.
Substitute Products: While few direct substitutes exist for E.coli detection and analysis, competitive pressures arise from alternative methods in certain applications.
End-User Trends: Growing awareness of foodborne illnesses and water contamination drives demand for accurate and rapid E.coli detection, fueling industry expansion.
M&A Activities: The number of mergers and acquisitions (M&A) within the industry during the historical period (2019-2024) is estimated at xx deals. Consolidation is anticipated to continue, driving market concentration.
E.coli Industry Insights & Trends
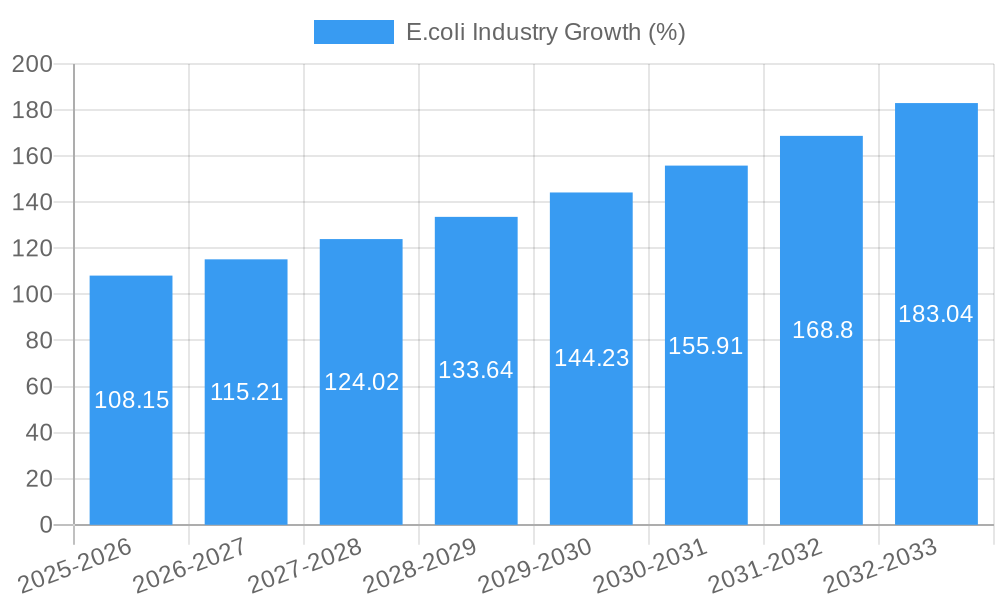
The E.coli industry experienced significant growth during the historical period (2019-2024), with a Compound Annual Growth Rate (CAGR) of approximately xx%. This growth is projected to continue throughout the forecast period (2025-2033), reaching an estimated market size of xx Million by 2033.
Several factors contribute to this positive outlook: increased government funding for research and development in the field of microbiology, coupled with rising investments in advanced diagnostic technologies. The demand for rapid and accurate E.coli detection methods across various sectors, including clinical diagnostics, environmental monitoring, and food safety, is driving market expansion. Technological disruptions, such as the development of portable and user-friendly testing kits, are further accelerating market growth. The evolving consumer behavior toward increased health awareness and demand for safer food and water is also a key driver. However, fluctuations in government funding and economic conditions could impact growth trajectories in subsequent years.
Key Markets & Segments Leading E.coli Industry
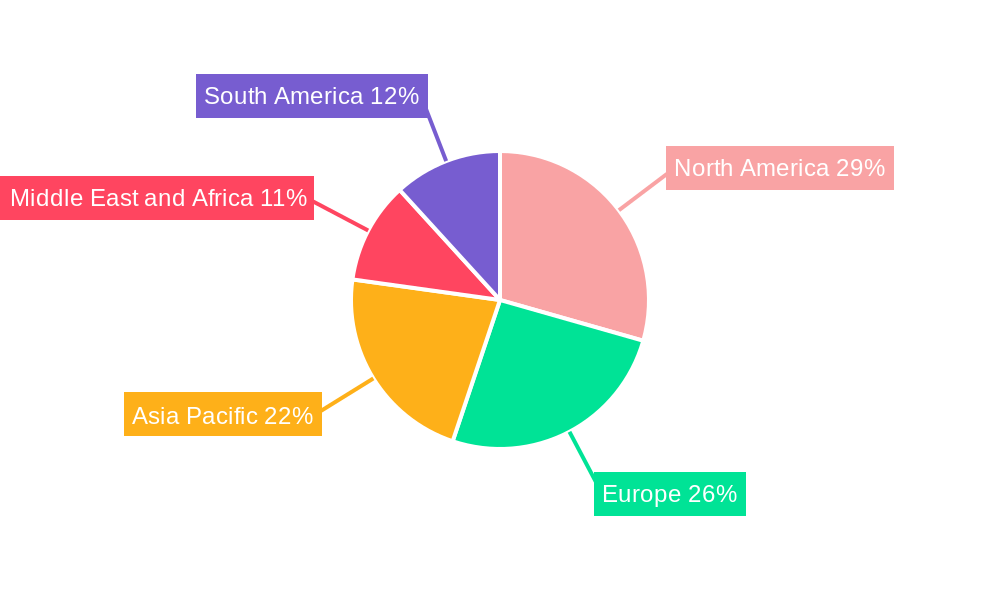
The global E.coli industry is witnessing robust expansion across various segments and geographical regions. While data on precise regional dominance requires further specification, it is anticipated that North America and Europe will maintain a leading position due to established healthcare infrastructure and high adoption rates of advanced testing technologies.
By Test:
Clinical Testing: This segment is expected to dominate due to the increasing prevalence of E.coli infections and the growing demand for accurate and rapid diagnostic tests.
Enzyme Immunoassays: This segment presents significant opportunities, with environmental testing expected to witness a substantial rise driven by stricter environmental regulations and increased awareness of waterborne diseases.
Drivers for Market Dominance:
Economic Growth: Strong economic growth in developed and developing nations enhances healthcare spending and environmental protection investments, supporting market expansion.
Infrastructure Development: Investments in water infrastructure and sanitation systems, especially in developing nations, positively influence the demand for E.coli detection technologies.
Government Regulations: Stringent government regulations and standards regarding food safety and environmental monitoring drive the adoption of E.coli testing services.
E.coli Industry Product Developments
Significant advancements in E.coli detection technologies are reshaping the industry landscape. The development of portable, point-of-care testing devices, coupled with the integration of advanced analytical techniques, is improving the speed, accuracy, and accessibility of E.coli testing. These innovations offer significant competitive advantages, particularly in resource-constrained settings. The market is also witnessing the introduction of automated testing systems and sophisticated data analysis tools.
Challenges in the E.coli Industry Market
The E.coli industry faces several challenges, including stringent regulatory hurdles requiring significant investments in compliance and potentially slowing product launches. Supply chain disruptions can impact the availability of critical reagents and testing kits, leading to cost increases and market volatility. Furthermore, intense competition among established players and emerging companies necessitates continuous innovation and strategic differentiation. These challenges collectively impact market growth but are offset by the high demand and continual advancements in the technology. The projected negative impact on overall growth is approximately xx%.
Forces Driving E.coli Industry Growth
Several factors contribute to the long-term growth of the E.coli industry. Technological advancements, such as the development of highly sensitive and rapid diagnostic tools, are pivotal. Increasing government funding for research and development enhances innovation and product development. Strengthening global regulatory frameworks regarding food safety and environmental protection further propel market expansion. The rising prevalence of E.coli infections and associated health concerns drive consistent demand for efficient testing solutions.
Long-Term Growth Catalysts in the E.coli Industry
The E.coli industry’s long-term growth is fueled by strategic partnerships between research institutions, diagnostic companies, and healthcare providers. These collaborations foster innovation and improve access to advanced testing technologies. Continued investment in research and development results in the development of more accurate and efficient detection methods. Expansion into emerging markets with growing awareness of public health and environmental issues creates new opportunities for market penetration.
Emerging Opportunities in E.coli Industry
The E.coli industry presents several emerging opportunities. The development of personalized medicine approaches for E.coli infections promises targeted therapies. The integration of artificial intelligence and machine learning into E.coli detection systems improves accuracy and efficiency. Increased demand for rapid, on-site testing solutions in remote areas or during outbreaks necessitates the development of portable testing devices.
Leading Players in the E.coli Industry Sector
- Caisson Laboratories Inc
- Becton Dickinson and Company
- Bio-Rad Laboratories Inc
- Cell Culture Technologies LLC
- GE Healthcare
- Lonza Group Ltd
- HiMedia Laboratories Pvt Ltd
- Merck & Co Inc
- Corning Incorporated
- Fujifilm Holdings Corporation
Key Milestones in E.coli Industry Industry
June 2022: Researchers from IIT Kanpur developed a highly sensitive E.coli water testing kit, significantly improving detection capabilities. This milestone has impacted the market by creating a demand for more advanced testing technologies.
June 2022: Researchers at Michigan State University conducted an experiment on E.coli evolution, providing valuable insights into bacterial adaptation and informing future research and development efforts within the industry. This contributed to a better understanding of the bacteria itself impacting long-term strategies for control and detection.
Strategic Outlook for E.coli Industry Market
The E.coli industry is poised for substantial growth driven by continuous technological advancements, increased awareness of public health concerns, and robust government support for research and development. Strategic partnerships and market expansion into developing economies further enhance future market potential. The industry's strategic focus on innovation, coupled with a commitment to regulatory compliance, creates numerous opportunities for players to capitalize on the escalating demand for accurate and efficient E.coli detection and analysis solutions.
E.coli Industry Segmentation
-
1. Test
-
1.1. Clinical Testing
- 1.1.1. Polymerase Chain Reaction
- 1.1.2. Enzyme Immunoassays
-
1.2. Environmental Testing
- 1.2.1. Membrane Filtration
- 1.2.2. Multiple Tube Fermentation
- 1.2.3. Enzyme Substrate Method
-
1.1. Clinical Testing
E.coli Industry Segmentation By Geography
-
1. North America
- 1.1. United States
- 1.2. Canada
- 1.3. Mexico
-
2. Europe
- 2.1. Germany
- 2.2. United Kingdom
- 2.3. France
- 2.4. Italy
- 2.5. Spain
- 2.6. Rest of Europe
-
3. Asia Pacific
- 3.1. China
- 3.2. Japan
- 3.3. India
- 3.4. Australia
- 3.5. South Korea
- 3.6. Rest of Asia Pacific
-
4. Middle East and Africa
- 4.1. GCC
- 4.2. South Africa
- 4.3. Rest of Middle East and Africa
-
5. South America
- 5.1. Brazil
- 5.2. Argentina
- 5.3. Rest of South America
E.coli Industry REPORT HIGHLIGHTS
| Aspects | Details |
|---|---|
| Study Period | 2019-2033 |
| Base Year | 2024 |
| Estimated Year | 2025 |
| Forecast Period | 2025-2033 |
| Historical Period | 2019-2024 |
| Growth Rate | CAGR of 7.93% from 2019-2033 |
| Segmentation |
|
Table of Contents
- 1. Introduction
- 1.1. Research Scope
- 1.2. Market Segmentation
- 1.3. Research Methodology
- 1.4. Definitions and Assumptions
- 2. Executive Summary
- 2.1. Introduction
- 3. Market Dynamics
- 3.1. Introduction
- 3.2. Market Drivers
- 3.2.1. Increasing Prevalence of Diarrhoea; New Technological Advancements
- 3.3. Market Restrains
- 3.3.1. High Cost of E. coli Treatment
- 3.4. Market Trends
- 3.4.1. Polymerase Chain Reaction Segment is Expected to be Major Segment in the Escherichia coli Testing Market
- 4. Market Factor Analysis
- 4.1. Porters Five Forces
- 4.2. Supply/Value Chain
- 4.3. PESTEL analysis
- 4.4. Market Entropy
- 4.5. Patent/Trademark Analysis
- 5. Global E.coli Industry Analysis, Insights and Forecast, 2019-2031
- 5.1. Market Analysis, Insights and Forecast - by Test
- 5.1.1. Clinical Testing
- 5.1.1.1. Polymerase Chain Reaction
- 5.1.1.2. Enzyme Immunoassays
- 5.1.2. Environmental Testing
- 5.1.2.1. Membrane Filtration
- 5.1.2.2. Multiple Tube Fermentation
- 5.1.2.3. Enzyme Substrate Method
- 5.1.1. Clinical Testing
- 5.2. Market Analysis, Insights and Forecast - by Region
- 5.2.1. North America
- 5.2.2. Europe
- 5.2.3. Asia Pacific
- 5.2.4. Middle East and Africa
- 5.2.5. South America
- 5.1. Market Analysis, Insights and Forecast - by Test
- 6. North America E.coli Industry Analysis, Insights and Forecast, 2019-2031
- 6.1. Market Analysis, Insights and Forecast - by Test
- 6.1.1. Clinical Testing
- 6.1.1.1. Polymerase Chain Reaction
- 6.1.1.2. Enzyme Immunoassays
- 6.1.2. Environmental Testing
- 6.1.2.1. Membrane Filtration
- 6.1.2.2. Multiple Tube Fermentation
- 6.1.2.3. Enzyme Substrate Method
- 6.1.1. Clinical Testing
- 6.1. Market Analysis, Insights and Forecast - by Test
- 7. Europe E.coli Industry Analysis, Insights and Forecast, 2019-2031
- 7.1. Market Analysis, Insights and Forecast - by Test
- 7.1.1. Clinical Testing
- 7.1.1.1. Polymerase Chain Reaction
- 7.1.1.2. Enzyme Immunoassays
- 7.1.2. Environmental Testing
- 7.1.2.1. Membrane Filtration
- 7.1.2.2. Multiple Tube Fermentation
- 7.1.2.3. Enzyme Substrate Method
- 7.1.1. Clinical Testing
- 7.1. Market Analysis, Insights and Forecast - by Test
- 8. Asia Pacific E.coli Industry Analysis, Insights and Forecast, 2019-2031
- 8.1. Market Analysis, Insights and Forecast - by Test
- 8.1.1. Clinical Testing
- 8.1.1.1. Polymerase Chain Reaction
- 8.1.1.2. Enzyme Immunoassays
- 8.1.2. Environmental Testing
- 8.1.2.1. Membrane Filtration
- 8.1.2.2. Multiple Tube Fermentation
- 8.1.2.3. Enzyme Substrate Method
- 8.1.1. Clinical Testing
- 8.1. Market Analysis, Insights and Forecast - by Test
- 9. Middle East and Africa E.coli Industry Analysis, Insights and Forecast, 2019-2031
- 9.1. Market Analysis, Insights and Forecast - by Test
- 9.1.1. Clinical Testing
- 9.1.1.1. Polymerase Chain Reaction
- 9.1.1.2. Enzyme Immunoassays
- 9.1.2. Environmental Testing
- 9.1.2.1. Membrane Filtration
- 9.1.2.2. Multiple Tube Fermentation
- 9.1.2.3. Enzyme Substrate Method
- 9.1.1. Clinical Testing
- 9.1. Market Analysis, Insights and Forecast - by Test
- 10. South America E.coli Industry Analysis, Insights and Forecast, 2019-2031
- 10.1. Market Analysis, Insights and Forecast - by Test
- 10.1.1. Clinical Testing
- 10.1.1.1. Polymerase Chain Reaction
- 10.1.1.2. Enzyme Immunoassays
- 10.1.2. Environmental Testing
- 10.1.2.1. Membrane Filtration
- 10.1.2.2. Multiple Tube Fermentation
- 10.1.2.3. Enzyme Substrate Method
- 10.1.1. Clinical Testing
- 10.1. Market Analysis, Insights and Forecast - by Test
- 11. North America E.coli Industry Analysis, Insights and Forecast, 2019-2031
- 11.1. Market Analysis, Insights and Forecast - By Country/Sub-region
- 11.1.1 United States
- 11.1.2 Canada
- 11.1.3 Mexico
- 12. Europe E.coli Industry Analysis, Insights and Forecast, 2019-2031
- 12.1. Market Analysis, Insights and Forecast - By Country/Sub-region
- 12.1.1 Germany
- 12.1.2 United Kingdom
- 12.1.3 France
- 12.1.4 Italy
- 12.1.5 Spain
- 12.1.6 Rest of Europe
- 13. Asia Pacific E.coli Industry Analysis, Insights and Forecast, 2019-2031
- 13.1. Market Analysis, Insights and Forecast - By Country/Sub-region
- 13.1.1 China
- 13.1.2 Japan
- 13.1.3 India
- 13.1.4 Australia
- 13.1.5 South Korea
- 13.1.6 Rest of Asia Pacific
- 14. Middle East and Africa E.coli Industry Analysis, Insights and Forecast, 2019-2031
- 14.1. Market Analysis, Insights and Forecast - By Country/Sub-region
- 14.1.1 GCC
- 14.1.2 South Africa
- 14.1.3 Rest of Middle East and Africa
- 15. South America E.coli Industry Analysis, Insights and Forecast, 2019-2031
- 15.1. Market Analysis, Insights and Forecast - By Country/Sub-region
- 15.1.1 Brazil
- 15.1.2 Argentina
- 15.1.3 Rest of South America
- 16. Competitive Analysis
- 16.1. Global Market Share Analysis 2024
- 16.2. Company Profiles
- 16.2.1 Caisson Laboratories Inc
- 16.2.1.1. Overview
- 16.2.1.2. Products
- 16.2.1.3. SWOT Analysis
- 16.2.1.4. Recent Developments
- 16.2.1.5. Financials (Based on Availability)
- 16.2.2 Becton Dickinson and Company
- 16.2.2.1. Overview
- 16.2.2.2. Products
- 16.2.2.3. SWOT Analysis
- 16.2.2.4. Recent Developments
- 16.2.2.5. Financials (Based on Availability)
- 16.2.3 Bio-Rad Laboratories Inc
- 16.2.3.1. Overview
- 16.2.3.2. Products
- 16.2.3.3. SWOT Analysis
- 16.2.3.4. Recent Developments
- 16.2.3.5. Financials (Based on Availability)
- 16.2.4 Cell Culture Technologies LLC
- 16.2.4.1. Overview
- 16.2.4.2. Products
- 16.2.4.3. SWOT Analysis
- 16.2.4.4. Recent Developments
- 16.2.4.5. Financials (Based on Availability)
- 16.2.5 GE Healthcare
- 16.2.5.1. Overview
- 16.2.5.2. Products
- 16.2.5.3. SWOT Analysis
- 16.2.5.4. Recent Developments
- 16.2.5.5. Financials (Based on Availability)
- 16.2.6 Lonza Group Ltd
- 16.2.6.1. Overview
- 16.2.6.2. Products
- 16.2.6.3. SWOT Analysis
- 16.2.6.4. Recent Developments
- 16.2.6.5. Financials (Based on Availability)
- 16.2.7 HiMedia Laboratories Pvt Ltd
- 16.2.7.1. Overview
- 16.2.7.2. Products
- 16.2.7.3. SWOT Analysis
- 16.2.7.4. Recent Developments
- 16.2.7.5. Financials (Based on Availability)
- 16.2.8 Merck & Co Inc*List Not Exhaustive
- 16.2.8.1. Overview
- 16.2.8.2. Products
- 16.2.8.3. SWOT Analysis
- 16.2.8.4. Recent Developments
- 16.2.8.5. Financials (Based on Availability)
- 16.2.9 Corning Incorporated
- 16.2.9.1. Overview
- 16.2.9.2. Products
- 16.2.9.3. SWOT Analysis
- 16.2.9.4. Recent Developments
- 16.2.9.5. Financials (Based on Availability)
- 16.2.10 Fujifilm Holdings Corporation
- 16.2.10.1. Overview
- 16.2.10.2. Products
- 16.2.10.3. SWOT Analysis
- 16.2.10.4. Recent Developments
- 16.2.10.5. Financials (Based on Availability)
- 16.2.1 Caisson Laboratories Inc
List of Figures
- Figure 1: Global E.coli Industry Revenue Breakdown (Million, %) by Region 2024 & 2032
- Figure 2: North America E.coli Industry Revenue (Million), by Country 2024 & 2032
- Figure 3: North America E.coli Industry Revenue Share (%), by Country 2024 & 2032
- Figure 4: Europe E.coli Industry Revenue (Million), by Country 2024 & 2032
- Figure 5: Europe E.coli Industry Revenue Share (%), by Country 2024 & 2032
- Figure 6: Asia Pacific E.coli Industry Revenue (Million), by Country 2024 & 2032
- Figure 7: Asia Pacific E.coli Industry Revenue Share (%), by Country 2024 & 2032
- Figure 8: Middle East and Africa E.coli Industry Revenue (Million), by Country 2024 & 2032
- Figure 9: Middle East and Africa E.coli Industry Revenue Share (%), by Country 2024 & 2032
- Figure 10: South America E.coli Industry Revenue (Million), by Country 2024 & 2032
- Figure 11: South America E.coli Industry Revenue Share (%), by Country 2024 & 2032
- Figure 12: North America E.coli Industry Revenue (Million), by Test 2024 & 2032
- Figure 13: North America E.coli Industry Revenue Share (%), by Test 2024 & 2032
- Figure 14: North America E.coli Industry Revenue (Million), by Country 2024 & 2032
- Figure 15: North America E.coli Industry Revenue Share (%), by Country 2024 & 2032
- Figure 16: Europe E.coli Industry Revenue (Million), by Test 2024 & 2032
- Figure 17: Europe E.coli Industry Revenue Share (%), by Test 2024 & 2032
- Figure 18: Europe E.coli Industry Revenue (Million), by Country 2024 & 2032
- Figure 19: Europe E.coli Industry Revenue Share (%), by Country 2024 & 2032
- Figure 20: Asia Pacific E.coli Industry Revenue (Million), by Test 2024 & 2032
- Figure 21: Asia Pacific E.coli Industry Revenue Share (%), by Test 2024 & 2032
- Figure 22: Asia Pacific E.coli Industry Revenue (Million), by Country 2024 & 2032
- Figure 23: Asia Pacific E.coli Industry Revenue Share (%), by Country 2024 & 2032
- Figure 24: Middle East and Africa E.coli Industry Revenue (Million), by Test 2024 & 2032
- Figure 25: Middle East and Africa E.coli Industry Revenue Share (%), by Test 2024 & 2032
- Figure 26: Middle East and Africa E.coli Industry Revenue (Million), by Country 2024 & 2032
- Figure 27: Middle East and Africa E.coli Industry Revenue Share (%), by Country 2024 & 2032
- Figure 28: South America E.coli Industry Revenue (Million), by Test 2024 & 2032
- Figure 29: South America E.coli Industry Revenue Share (%), by Test 2024 & 2032
- Figure 30: South America E.coli Industry Revenue (Million), by Country 2024 & 2032
- Figure 31: South America E.coli Industry Revenue Share (%), by Country 2024 & 2032
List of Tables
- Table 1: Global E.coli Industry Revenue Million Forecast, by Region 2019 & 2032
- Table 2: Global E.coli Industry Revenue Million Forecast, by Test 2019 & 2032
- Table 3: Global E.coli Industry Revenue Million Forecast, by Region 2019 & 2032
- Table 4: Global E.coli Industry Revenue Million Forecast, by Country 2019 & 2032
- Table 5: United States E.coli Industry Revenue (Million) Forecast, by Application 2019 & 2032
- Table 6: Canada E.coli Industry Revenue (Million) Forecast, by Application 2019 & 2032
- Table 7: Mexico E.coli Industry Revenue (Million) Forecast, by Application 2019 & 2032
- Table 8: Global E.coli Industry Revenue Million Forecast, by Country 2019 & 2032
- Table 9: Germany E.coli Industry Revenue (Million) Forecast, by Application 2019 & 2032
- Table 10: United Kingdom E.coli Industry Revenue (Million) Forecast, by Application 2019 & 2032
- Table 11: France E.coli Industry Revenue (Million) Forecast, by Application 2019 & 2032
- Table 12: Italy E.coli Industry Revenue (Million) Forecast, by Application 2019 & 2032
- Table 13: Spain E.coli Industry Revenue (Million) Forecast, by Application 2019 & 2032
- Table 14: Rest of Europe E.coli Industry Revenue (Million) Forecast, by Application 2019 & 2032
- Table 15: Global E.coli Industry Revenue Million Forecast, by Country 2019 & 2032
- Table 16: China E.coli Industry Revenue (Million) Forecast, by Application 2019 & 2032
- Table 17: Japan E.coli Industry Revenue (Million) Forecast, by Application 2019 & 2032
- Table 18: India E.coli Industry Revenue (Million) Forecast, by Application 2019 & 2032
- Table 19: Australia E.coli Industry Revenue (Million) Forecast, by Application 2019 & 2032
- Table 20: South Korea E.coli Industry Revenue (Million) Forecast, by Application 2019 & 2032
- Table 21: Rest of Asia Pacific E.coli Industry Revenue (Million) Forecast, by Application 2019 & 2032
- Table 22: Global E.coli Industry Revenue Million Forecast, by Country 2019 & 2032
- Table 23: GCC E.coli Industry Revenue (Million) Forecast, by Application 2019 & 2032
- Table 24: South Africa E.coli Industry Revenue (Million) Forecast, by Application 2019 & 2032
- Table 25: Rest of Middle East and Africa E.coli Industry Revenue (Million) Forecast, by Application 2019 & 2032
- Table 26: Global E.coli Industry Revenue Million Forecast, by Country 2019 & 2032
- Table 27: Brazil E.coli Industry Revenue (Million) Forecast, by Application 2019 & 2032
- Table 28: Argentina E.coli Industry Revenue (Million) Forecast, by Application 2019 & 2032
- Table 29: Rest of South America E.coli Industry Revenue (Million) Forecast, by Application 2019 & 2032
- Table 30: Global E.coli Industry Revenue Million Forecast, by Test 2019 & 2032
- Table 31: Global E.coli Industry Revenue Million Forecast, by Country 2019 & 2032
- Table 32: United States E.coli Industry Revenue (Million) Forecast, by Application 2019 & 2032
- Table 33: Canada E.coli Industry Revenue (Million) Forecast, by Application 2019 & 2032
- Table 34: Mexico E.coli Industry Revenue (Million) Forecast, by Application 2019 & 2032
- Table 35: Global E.coli Industry Revenue Million Forecast, by Test 2019 & 2032
- Table 36: Global E.coli Industry Revenue Million Forecast, by Country 2019 & 2032
- Table 37: Germany E.coli Industry Revenue (Million) Forecast, by Application 2019 & 2032
- Table 38: United Kingdom E.coli Industry Revenue (Million) Forecast, by Application 2019 & 2032
- Table 39: France E.coli Industry Revenue (Million) Forecast, by Application 2019 & 2032
- Table 40: Italy E.coli Industry Revenue (Million) Forecast, by Application 2019 & 2032
- Table 41: Spain E.coli Industry Revenue (Million) Forecast, by Application 2019 & 2032
- Table 42: Rest of Europe E.coli Industry Revenue (Million) Forecast, by Application 2019 & 2032
- Table 43: Global E.coli Industry Revenue Million Forecast, by Test 2019 & 2032
- Table 44: Global E.coli Industry Revenue Million Forecast, by Country 2019 & 2032
- Table 45: China E.coli Industry Revenue (Million) Forecast, by Application 2019 & 2032
- Table 46: Japan E.coli Industry Revenue (Million) Forecast, by Application 2019 & 2032
- Table 47: India E.coli Industry Revenue (Million) Forecast, by Application 2019 & 2032
- Table 48: Australia E.coli Industry Revenue (Million) Forecast, by Application 2019 & 2032
- Table 49: South Korea E.coli Industry Revenue (Million) Forecast, by Application 2019 & 2032
- Table 50: Rest of Asia Pacific E.coli Industry Revenue (Million) Forecast, by Application 2019 & 2032
- Table 51: Global E.coli Industry Revenue Million Forecast, by Test 2019 & 2032
- Table 52: Global E.coli Industry Revenue Million Forecast, by Country 2019 & 2032
- Table 53: GCC E.coli Industry Revenue (Million) Forecast, by Application 2019 & 2032
- Table 54: South Africa E.coli Industry Revenue (Million) Forecast, by Application 2019 & 2032
- Table 55: Rest of Middle East and Africa E.coli Industry Revenue (Million) Forecast, by Application 2019 & 2032
- Table 56: Global E.coli Industry Revenue Million Forecast, by Test 2019 & 2032
- Table 57: Global E.coli Industry Revenue Million Forecast, by Country 2019 & 2032
- Table 58: Brazil E.coli Industry Revenue (Million) Forecast, by Application 2019 & 2032
- Table 59: Argentina E.coli Industry Revenue (Million) Forecast, by Application 2019 & 2032
- Table 60: Rest of South America E.coli Industry Revenue (Million) Forecast, by Application 2019 & 2032
Frequently Asked Questions
1. What is the projected Compound Annual Growth Rate (CAGR) of the E.coli Industry?
The projected CAGR is approximately 7.93%.
2. Which companies are prominent players in the E.coli Industry?
Key companies in the market include Caisson Laboratories Inc, Becton Dickinson and Company, Bio-Rad Laboratories Inc, Cell Culture Technologies LLC, GE Healthcare, Lonza Group Ltd, HiMedia Laboratories Pvt Ltd, Merck & Co Inc*List Not Exhaustive, Corning Incorporated, Fujifilm Holdings Corporation.
3. What are the main segments of the E.coli Industry?
The market segments include Test.
4. Can you provide details about the market size?
The market size is estimated to be USD 1.36 Million as of 2022.
5. What are some drivers contributing to market growth?
Increasing Prevalence of Diarrhoea; New Technological Advancements.
6. What are the notable trends driving market growth?
Polymerase Chain Reaction Segment is Expected to be Major Segment in the Escherichia coli Testing Market.
7. Are there any restraints impacting market growth?
High Cost of E. coli Treatment.
8. Can you provide examples of recent developments in the market?
In June 2022, Researchers from the Indian Institute of Technology (IIT) Kanpur developed an enzyme-substrate medium-based E.coli. water testing kit that is highly sensitive and can detect the presence or absence of a single E.coli. in drinking water.
9. What pricing options are available for accessing the report?
Pricing options include single-user, multi-user, and enterprise licenses priced at USD 4750, USD 5250, and USD 8750 respectively.
10. Is the market size provided in terms of value or volume?
The market size is provided in terms of value, measured in Million.
11. Are there any specific market keywords associated with the report?
Yes, the market keyword associated with the report is "E.coli Industry," which aids in identifying and referencing the specific market segment covered.
12. How do I determine which pricing option suits my needs best?
The pricing options vary based on user requirements and access needs. Individual users may opt for single-user licenses, while businesses requiring broader access may choose multi-user or enterprise licenses for cost-effective access to the report.
13. Are there any additional resources or data provided in the E.coli Industry report?
While the report offers comprehensive insights, it's advisable to review the specific contents or supplementary materials provided to ascertain if additional resources or data are available.
14. How can I stay updated on further developments or reports in the E.coli Industry?
To stay informed about further developments, trends, and reports in the E.coli Industry, consider subscribing to industry newsletters, following relevant companies and organizations, or regularly checking reputable industry news sources and publications.
Methodology
Step 1 - Identification of Relevant Samples Size from Population Database


Step 2 - Approaches for Defining Global Market Size (Value, Volume* & Price*)

Note*: In applicable scenarios
Step 3 - Data Sources
Primary Research
- Web Analytics
- Survey Reports
- Research Institute
- Latest Research Reports
- Opinion Leaders
Secondary Research
- Annual Reports
- White Paper
- Latest Press Release
- Industry Association
- Paid Database
- Investor Presentations

Step 4 - Data Triangulation
Involves using different sources of information in order to increase the validity of a study
These sources are likely to be stakeholders in a program - participants, other researchers, program staff, other community members, and so on.
Then we put all data in single framework & apply various statistical tools to find out the dynamic on the market.
During the analysis stage, feedback from the stakeholder groups would be compared to determine areas of agreement as well as areas of divergence
