

Key Insights
The US ophthalmic devices market is set for significant expansion, forecasted to reach $20.5 billion by 2025, with a projected Compound Annual Growth Rate (CAGR) of 8.6% through 2033. This growth is propelled by the rising incidence of age-related eye diseases, including cataracts and glaucoma, and the increasing demand for minimally invasive surgical techniques. Innovations in diagnostic imaging, such as Optical Coherence Tomography (OCT) scanners and advanced diagnostic and monitoring devices, are crucial for enhancing early detection and treatment effectiveness. The vision correction segment, comprising spectacles and contact lenses, also significantly contributes to market value, driven by evolving lifestyles and a greater emphasis on visual comfort and aesthetics. Furthermore, the growing adoption of refractive surgery and continuous advancements in intraocular lenses and glaucoma drainage devices are key market accelerators.
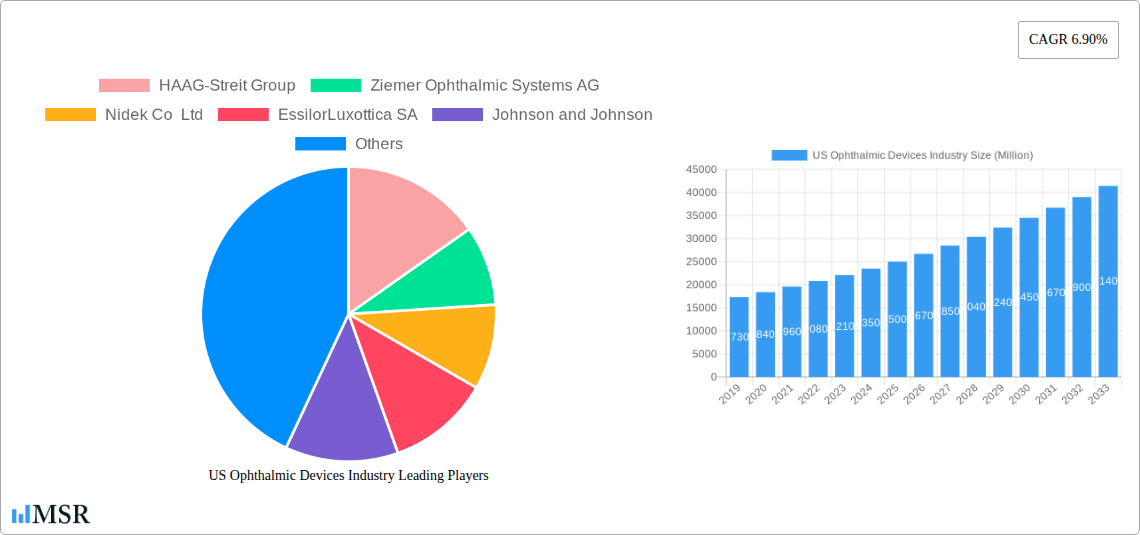
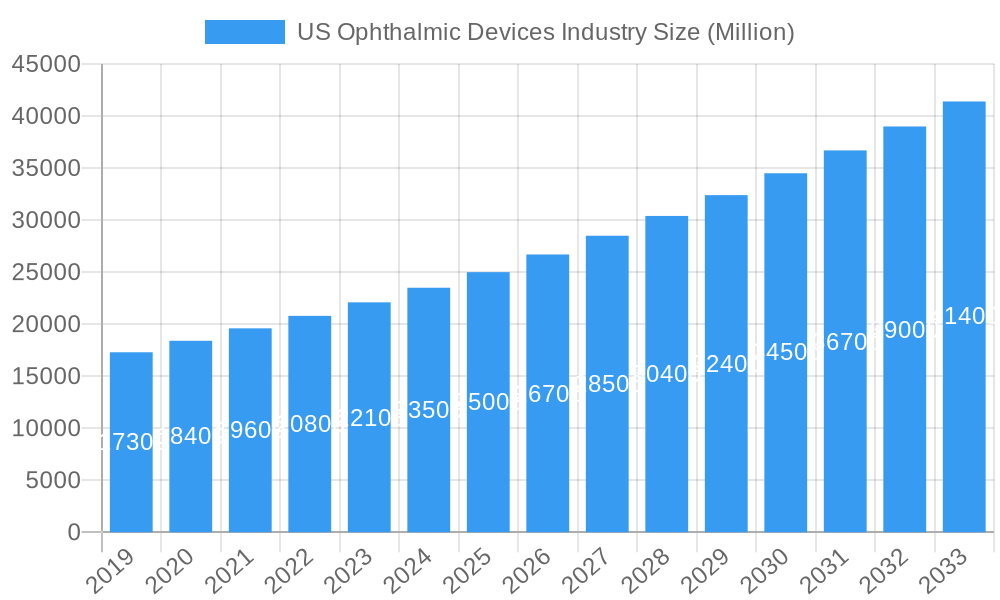
US Ophthalmic Devices Industry Market Size (In Billion)
Emerging trends, such as the integration of artificial intelligence (AI) in diagnostic tools for improved disease prediction and personalized treatment strategies, are shaping the market's trajectory. The development of sophisticated surgical robotics and advanced laser technologies is also transforming ophthalmic procedures, leading to better patient outcomes and reduced recovery periods. While the market presents strong growth prospects, challenges may arise from high research and development expenses for novel devices and stringent regulatory approval processes. However, strategic investments in R&D and acquisitions by leading companies like Johnson & Johnson, Alcon Inc., and EssilorLuxottica SA are anticipated to mitigate these challenges, fostering continued innovation and market penetration across surgical, diagnostic, and vision correction device segments.
US Ophthalmic Devices Industry Company Market Share
This comprehensive report offers a detailed analysis of the US ophthalmic devices industry, providing critical insights into market dynamics, growth drivers, competitive intelligence, and future opportunities. Covering the historical period of 2019-2024 and projecting through 2033, with a base year of 2025, this research is indispensable for ophthalmic device manufacturers, medical technology investors, ophthalmologists, distributors, and regulatory bodies aiming to navigate the intricate and rapidly evolving US eye care market. Explore key trends in surgical devices, diagnostic and monitoring devices, and vision correction devices to understand essential strategies for success in this vital sector.
US Ophthalmic Devices Industry Market Concentration & Dynamics
The US Ophthalmic Devices Industry exhibits a moderate to high level of market concentration, with a few key players dominating significant market shares, particularly in segments like intraocular lenses and advanced surgical equipment. The innovation ecosystem is robust, fueled by continuous R&D investments by industry giants and emerging startups alike. Regulatory frameworks, primarily governed by the FDA, play a crucial role in market entry and product approval, influencing the pace of innovation and competition. The availability of substitute products, such as advanced pharmaceuticals and less invasive surgical techniques, presents a dynamic competitive landscape. End-user trends are shifting towards minimally invasive procedures, personalized treatments, and enhanced patient outcomes, driving demand for sophisticated ophthalmic technologies. Merger and acquisition (M&A) activities, while not consistently high, are strategic and often target innovative technologies or market access. For instance, the number of significant M&A deals in the past five years has been approximately 5-10 annually, indicating consolidation and strategic growth. Market share data reveals that leading companies hold an aggregate of over 60% of the total market value, with significant variations across specific device categories.
US Ophthalmic Devices Industry Industry Insights & Trends
The US Ophthalmic Devices Industry is poised for significant growth, projected to reach an estimated market size of $15,000 Million by 2025, with a projected compound annual growth rate (CAGR) of 6.5% during the forecast period of 2025-2033. This expansion is driven by a confluence of factors, including the increasing prevalence of age-related eye diseases such as cataracts, glaucoma, and age-related macular degeneration, directly linked to the aging demographic of the US population. Technological disruptions are at the forefront, with advancements in AI-powered diagnostics, robotic surgery, and the development of novel implantable devices revolutionizing patient care. For example, the integration of artificial intelligence in optical coherence tomography (OCT) scanners is enhancing diagnostic accuracy and speed, a trend expected to capture an additional 15% of the diagnostic market share within the next five years. Evolving consumer behaviors are also shaping the market; patients are increasingly seeking preventative eye care, less invasive procedures with shorter recovery times, and improved visual outcomes, fueling demand for premium ophthalmic solutions. The market size in 2024 was estimated at $13,500 Million.
Key Markets & Segments Leading US Ophthalmic Devices Industry
The US Ophthalmic Devices Industry is characterized by the dominance of specific segments and product categories, driven by robust demand and technological advancements. Within Surgical Devices, Intraocular Lenses (IOLs) represent a significant and high-value segment, driven by the high volume of cataract surgeries. The market for IOLs is estimated to be worth $3,000 Million in 2025. Glaucoma Drainage Devices and Glaucoma Stents and Implants are experiencing rapid growth, with a projected CAGR of 7.8% due to increasing diagnoses of glaucoma and the demand for effective IOP-lowering solutions. The market for these devices is expected to reach $900 Million by 2025. Lasers used in ophthalmic surgery, such as femtosecond lasers for cataract surgery and excimer lasers for refractive procedures, are also crucial, with an estimated market value of $700 Million in 2025.
In Diagnostic and Monitoring Devices, Optical Coherence Tomography (OCT) Scanners are a leading segment, valued at $1,200 Million in 2025, owing to their indispensable role in diagnosing and monitoring a wide range of retinal conditions. Autorefractors and Keratometers remain essential for routine eye exams, holding a market share of $400 Million in 2025. Corneal Topography Systems are also gaining traction for their detailed corneal mapping capabilities, crucial for refractive surgery planning and diagnosing corneal diseases.
The Vision Correction Devices segment is dominated by Spectacles, which continue to hold the largest market share in terms of unit volume, valued at $4,500 Million in 2025. However, Contact Lenses, including multifocal and specialty lenses, are experiencing strong growth driven by aesthetic preferences and the desire for convenience, with a projected market value of $2,500 Million in 2025.
- Drivers for Surgical Devices Dominance:
- Aging population leading to increased incidence of cataracts.
- Advancements in minimally invasive surgical techniques.
- Development of premium IOLs offering improved visual outcomes.
- Growing demand for glaucoma treatment solutions.
- Drivers for Diagnostic and Monitoring Devices Dominance:
- Rising prevalence of chronic eye diseases requiring continuous monitoring.
- Technological innovation in imaging and diagnostic accuracy.
- Increased adoption of advanced diagnostic tools in clinical settings.
- Drivers for Vision Correction Devices Dominance:
- High prevalence of refractive errors globally.
- Increasing disposable incomes enabling access to corrective eyewear.
- Growing awareness of eye health and the importance of proper vision correction.
US Ophthalmic Devices Industry Product Developments
The US Ophthalmic Devices Industry is characterized by a rapid pace of product innovation, focusing on enhanced efficacy, patient comfort, and improved surgical outcomes. Recent developments include the introduction of advanced multifocal intraocular lenses that provide spectacle independence for patients, alongside next-generation glaucoma stents designed for standalone procedures to effectively manage intraocular pressure. For instance, advancements in femtosecond laser technology are enabling more precise and personalized corneal flap creation for LASIK procedures. Furthermore, smart contact lenses with integrated sensors for continuous glucose monitoring are emerging, indicating a convergence of ophthalmic technology with broader health monitoring solutions. These innovations are driven by a quest for superior visual quality, faster recovery times, and minimally invasive interventions, giving manufacturers a significant competitive edge.
Challenges in the US Ophthalmic Devices Industry Market
The US Ophthalmic Devices Industry faces several critical challenges that impact its growth trajectory. Stringent and evolving regulatory hurdles from the FDA can lead to lengthy and costly approval processes, delaying market entry for novel devices. Supply chain disruptions, as witnessed in recent years, can impact manufacturing and distribution, leading to material shortages and increased operational costs, estimated to add 5-10% to production expenses. Intense competitive pressures from established players and emerging innovators necessitate continuous investment in R&D and marketing, while pricing pressures from payers and healthcare systems can affect profitability. The high cost of advanced technologies can also be a barrier to widespread adoption in certain healthcare settings.
Forces Driving US Ophthalmic Devices Industry Growth
Several powerful forces are propelling the US Ophthalmic Devices Industry forward. The primary driver is the demographic shift towards an aging population, which significantly increases the incidence of age-related eye conditions like cataracts and glaucoma. Technological advancements, including the development of AI-powered diagnostic tools and robotic surgical systems, are enhancing precision, reducing invasiveness, and improving patient outcomes, thereby stimulating demand for cutting-edge ophthalmic solutions. Increased patient awareness regarding eye health and the availability of advanced treatment options also contributes to market growth. Favorable reimbursement policies for many ophthalmic procedures and devices, coupled with growing healthcare expenditure, further bolster the industry's expansion.
Challenges in the US Ophthalmic Devices Industry Market
Long-term growth catalysts for the US Ophthalmic Devices Industry are deeply rooted in ongoing innovation and strategic market expansion. The relentless pursuit of technological breakthroughs, such as the development of bio-integrated ophthalmic implants and advanced retinal imaging techniques, promises to unlock new therapeutic avenues and market segments. Strategic partnerships and collaborations between device manufacturers, research institutions, and healthcare providers are crucial for accelerating the translation of novel research into commercially viable products. Furthermore, expanding access to ophthalmic care in underserved regions and through telehealth initiatives presents significant market expansion opportunities, ensuring that a broader patient population can benefit from the industry's advancements.
Emerging Opportunities in US Ophthalmic Devices Industry
Emerging trends and opportunities within the US Ophthalmic Devices Industry are creating new avenues for growth and innovation. The increasing demand for personalized medicine is driving the development of tailor-made ophthalmic solutions, including custom-designed intraocular lenses and patient-specific surgical plans. The convergence of artificial intelligence and ophthalmology is revolutionizing diagnostics and treatment planning, with AI algorithms proving adept at early detection of eye diseases and predicting treatment responses. Teleophthalmology presents a significant opportunity to expand access to eye care, particularly in remote areas, and to facilitate remote patient monitoring. Furthermore, the growing interest in preventative eye care and the development of wearable devices for continuous eye health monitoring are opening up new consumer-driven markets.
Leading Players in the US Ophthalmic Devices Industry Sector
- HAAG-Streit Group
- Ziemer Ophthalmic Systems AG
- Nidek Co Ltd
- EssilorLuxottica SA
- Johnson and Johnson
- Carl Zeiss AG
- Topcon Corporation
- Alcon Inc
- Bausch Health Companies Inc
- Hoya Corporation
Key Milestones in US Ophthalmic Devices Industry Industry
- November 2022: Sight Sciences reported a publication of clinical data demonstrating the standalone effectiveness of the OMNI Surgical System in pseudophakic glaucoma patients with uncontrolled pressure following a previous combination cataract stent procedure. This milestone underscores the growing trend towards standalone MIGS procedures for glaucoma management.
- August 2022: Glaukos Corporation received 510(k) clearance from the U.S. Food and Drug Administration (FDA) for the iStent infinite Trabecular Micro-Bypass System, indicated for use in a standalone procedure to reduce elevated intraocular pressure (IOP) in patients with primary open-angle glaucoma uncontrolled by prior medical and surgical therapy. This approval signifies a significant advancement in glaucoma treatment, promoting less invasive and standalone surgical options.
Strategic Outlook for US Ophthalmic Devices Industry Market
The strategic outlook for the US Ophthalmic Devices Industry is exceptionally promising, driven by sustained demographic trends and an unyielding commitment to innovation. Future market potential lies in the continued development of premium and technologically advanced devices that offer enhanced patient outcomes and procedural efficiencies. Strategic opportunities abound in the expansion of minimally invasive surgical techniques, particularly for glaucoma and retinal diseases, where novel implants and devices are gaining traction. The integration of digital health solutions, including AI-driven diagnostics and telehealth platforms, will be crucial for improving patient access and streamlining care delivery. Companies that focus on developing personalized treatment strategies and investing in robust R&D pipelines will be best positioned to capitalize on the evolving demands of this dynamic market.
US Ophthalmic Devices Industry Segmentation
-
1. Devices
-
1.1. Surgical Devices
- 1.1.1. Glaucoma Drainage Devices
- 1.1.2. Glaucoma Stents and Implants
- 1.1.3. Intraocular Lenses
- 1.1.4. Lasers
- 1.1.5. Other Surgical Devices
-
1.2. Diagnostic and Monitoring Devices
- 1.2.1. Autorefractors and Keratometers
- 1.2.2. Corneal Topography Systems
- 1.2.3. Ophthalmic Ultrasound Imaging Systems
- 1.2.4. Ophthalmoscopes
- 1.2.5. Optical Coherence Tomography Scanners
- 1.2.6. Other Diagnostic and Monitoring Devices
-
1.3. Vision Correction Devices
- 1.3.1. Spectacles
- 1.3.2. Contact Lenses
-
1.1. Surgical Devices
US Ophthalmic Devices Industry Segmentation By Geography
-
1. North America
- 1.1. United States
- 1.2. Canada
- 1.3. Mexico
-
2. South America
- 2.1. Brazil
- 2.2. Argentina
- 2.3. Rest of South America
-
3. Europe
- 3.1. United Kingdom
- 3.2. Germany
- 3.3. France
- 3.4. Italy
- 3.5. Spain
- 3.6. Russia
- 3.7. Benelux
- 3.8. Nordics
- 3.9. Rest of Europe
-
4. Middle East & Africa
- 4.1. Turkey
- 4.2. Israel
- 4.3. GCC
- 4.4. North Africa
- 4.5. South Africa
- 4.6. Rest of Middle East & Africa
-
5. Asia Pacific
- 5.1. China
- 5.2. India
- 5.3. Japan
- 5.4. South Korea
- 5.5. ASEAN
- 5.6. Oceania
- 5.7. Rest of Asia Pacific
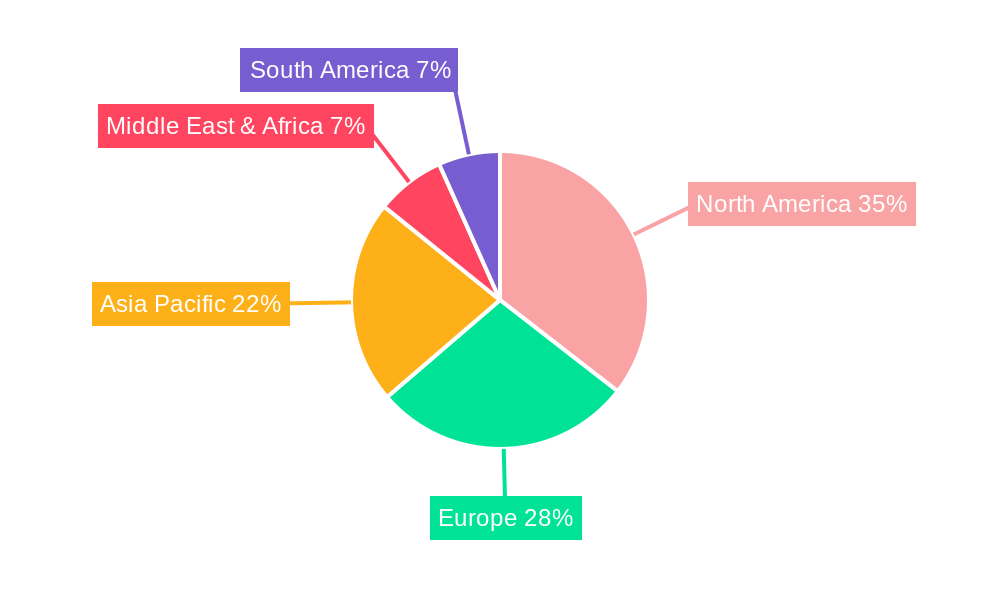
US Ophthalmic Devices Industry Regional Market Share
Geographic Coverage of US Ophthalmic Devices Industry
US Ophthalmic Devices Industry REPORT HIGHLIGHTS
| Aspects | Details |
|---|---|
| Study Period | 2020-2034 |
| Base Year | 2025 |
| Estimated Year | 2026 |
| Forecast Period | 2026-2034 |
| Historical Period | 2020-2025 |
| Growth Rate | CAGR of 8.6% from 2020-2034 |
| Segmentation |
|
Table of Contents
- 1. Introduction
- 1.1. Research Scope
- 1.2. Market Segmentation
- 1.3. Research Objective
- 1.4. Definitions and Assumptions
- 2. Executive Summary
- 2.1. Market Snapshot
- 3. Market Dynamics
- 3.1. Market Drivers
- 3.2. Market Restrains
- 3.3. Market Trends
- 3.4. Market Opportunities
- 4. Market Factor Analysis
- 4.1. Porters Five Forces
- 4.1.1. Bargaining Power of Suppliers
- 4.1.2. Bargaining Power of Buyers
- 4.1.3. Threat of New Entrants
- 4.1.4. Threat of Substitutes
- 4.1.5. Competitive Rivalry
- 4.2. PESTEL analysis
- 4.3. BCG Analysis
- 4.3.1. Stars (High Growth, High Market Share)
- 4.3.2. Cash Cows (Low Growth, High Market Share)
- 4.3.3. Question Mark (High Growth, Low Market Share)
- 4.3.4. Dogs (Low Growth, Low Market Share)
- 4.4. Ansoff Matrix Analysis
- 4.5. Supply Chain Analysis
- 4.6. Regulatory Landscape
- 4.7. Current Market Potential and Opportunity Assessment (TAM–SAM–SOM Framework)
- 4.8. MSR Analyst Note
- 4.1. Porters Five Forces
- 5. Market Analysis, Insights and Forecast 2021-2033
- 5.1. Market Analysis, Insights and Forecast - by Devices
- 5.1.1. Surgical Devices
- 5.1.1.1. Glaucoma Drainage Devices
- 5.1.1.2. Glaucoma Stents and Implants
- 5.1.1.3. Intraocular Lenses
- 5.1.1.4. Lasers
- 5.1.1.5. Other Surgical Devices
- 5.1.2. Diagnostic and Monitoring Devices
- 5.1.2.1. Autorefractors and Keratometers
- 5.1.2.2. Corneal Topography Systems
- 5.1.2.3. Ophthalmic Ultrasound Imaging Systems
- 5.1.2.4. Ophthalmoscopes
- 5.1.2.5. Optical Coherence Tomography Scanners
- 5.1.2.6. Other Diagnostic and Monitoring Devices
- 5.1.3. Vision Correction Devices
- 5.1.3.1. Spectacles
- 5.1.3.2. Contact Lenses
- 5.1.1. Surgical Devices
- 5.2. Market Analysis, Insights and Forecast - by Region
- 5.2.1. North America
- 5.2.2. South America
- 5.2.3. Europe
- 5.2.4. Middle East & Africa
- 5.2.5. Asia Pacific
- 5.1. Market Analysis, Insights and Forecast - by Devices
- 6. Global US Ophthalmic Devices Industry Analysis, Insights and Forecast, 2021-2033
- 6.1. Market Analysis, Insights and Forecast - by Devices
- 6.1.1. Surgical Devices
- 6.1.1.1. Glaucoma Drainage Devices
- 6.1.1.2. Glaucoma Stents and Implants
- 6.1.1.3. Intraocular Lenses
- 6.1.1.4. Lasers
- 6.1.1.5. Other Surgical Devices
- 6.1.2. Diagnostic and Monitoring Devices
- 6.1.2.1. Autorefractors and Keratometers
- 6.1.2.2. Corneal Topography Systems
- 6.1.2.3. Ophthalmic Ultrasound Imaging Systems
- 6.1.2.4. Ophthalmoscopes
- 6.1.2.5. Optical Coherence Tomography Scanners
- 6.1.2.6. Other Diagnostic and Monitoring Devices
- 6.1.3. Vision Correction Devices
- 6.1.3.1. Spectacles
- 6.1.3.2. Contact Lenses
- 6.1.1. Surgical Devices
- 6.1. Market Analysis, Insights and Forecast - by Devices
- 7. North America US Ophthalmic Devices Industry Analysis, Insights and Forecast, 2020-2032
- 7.1. Market Analysis, Insights and Forecast - by Devices
- 7.1.1. Surgical Devices
- 7.1.1.1. Glaucoma Drainage Devices
- 7.1.1.2. Glaucoma Stents and Implants
- 7.1.1.3. Intraocular Lenses
- 7.1.1.4. Lasers
- 7.1.1.5. Other Surgical Devices
- 7.1.2. Diagnostic and Monitoring Devices
- 7.1.2.1. Autorefractors and Keratometers
- 7.1.2.2. Corneal Topography Systems
- 7.1.2.3. Ophthalmic Ultrasound Imaging Systems
- 7.1.2.4. Ophthalmoscopes
- 7.1.2.5. Optical Coherence Tomography Scanners
- 7.1.2.6. Other Diagnostic and Monitoring Devices
- 7.1.3. Vision Correction Devices
- 7.1.3.1. Spectacles
- 7.1.3.2. Contact Lenses
- 7.1.1. Surgical Devices
- 7.1. Market Analysis, Insights and Forecast - by Devices
- 8. South America US Ophthalmic Devices Industry Analysis, Insights and Forecast, 2020-2032
- 8.1. Market Analysis, Insights and Forecast - by Devices
- 8.1.1. Surgical Devices
- 8.1.1.1. Glaucoma Drainage Devices
- 8.1.1.2. Glaucoma Stents and Implants
- 8.1.1.3. Intraocular Lenses
- 8.1.1.4. Lasers
- 8.1.1.5. Other Surgical Devices
- 8.1.2. Diagnostic and Monitoring Devices
- 8.1.2.1. Autorefractors and Keratometers
- 8.1.2.2. Corneal Topography Systems
- 8.1.2.3. Ophthalmic Ultrasound Imaging Systems
- 8.1.2.4. Ophthalmoscopes
- 8.1.2.5. Optical Coherence Tomography Scanners
- 8.1.2.6. Other Diagnostic and Monitoring Devices
- 8.1.3. Vision Correction Devices
- 8.1.3.1. Spectacles
- 8.1.3.2. Contact Lenses
- 8.1.1. Surgical Devices
- 8.1. Market Analysis, Insights and Forecast - by Devices
- 9. Europe US Ophthalmic Devices Industry Analysis, Insights and Forecast, 2020-2032
- 9.1. Market Analysis, Insights and Forecast - by Devices
- 9.1.1. Surgical Devices
- 9.1.1.1. Glaucoma Drainage Devices
- 9.1.1.2. Glaucoma Stents and Implants
- 9.1.1.3. Intraocular Lenses
- 9.1.1.4. Lasers
- 9.1.1.5. Other Surgical Devices
- 9.1.2. Diagnostic and Monitoring Devices
- 9.1.2.1. Autorefractors and Keratometers
- 9.1.2.2. Corneal Topography Systems
- 9.1.2.3. Ophthalmic Ultrasound Imaging Systems
- 9.1.2.4. Ophthalmoscopes
- 9.1.2.5. Optical Coherence Tomography Scanners
- 9.1.2.6. Other Diagnostic and Monitoring Devices
- 9.1.3. Vision Correction Devices
- 9.1.3.1. Spectacles
- 9.1.3.2. Contact Lenses
- 9.1.1. Surgical Devices
- 9.1. Market Analysis, Insights and Forecast - by Devices
- 10. Middle East & Africa US Ophthalmic Devices Industry Analysis, Insights and Forecast, 2020-2032
- 10.1. Market Analysis, Insights and Forecast - by Devices
- 10.1.1. Surgical Devices
- 10.1.1.1. Glaucoma Drainage Devices
- 10.1.1.2. Glaucoma Stents and Implants
- 10.1.1.3. Intraocular Lenses
- 10.1.1.4. Lasers
- 10.1.1.5. Other Surgical Devices
- 10.1.2. Diagnostic and Monitoring Devices
- 10.1.2.1. Autorefractors and Keratometers
- 10.1.2.2. Corneal Topography Systems
- 10.1.2.3. Ophthalmic Ultrasound Imaging Systems
- 10.1.2.4. Ophthalmoscopes
- 10.1.2.5. Optical Coherence Tomography Scanners
- 10.1.2.6. Other Diagnostic and Monitoring Devices
- 10.1.3. Vision Correction Devices
- 10.1.3.1. Spectacles
- 10.1.3.2. Contact Lenses
- 10.1.1. Surgical Devices
- 10.1. Market Analysis, Insights and Forecast - by Devices
- 11. Asia Pacific US Ophthalmic Devices Industry Analysis, Insights and Forecast, 2020-2032
- 11.1. Market Analysis, Insights and Forecast - by Devices
- 11.1.1. Surgical Devices
- 11.1.1.1. Glaucoma Drainage Devices
- 11.1.1.2. Glaucoma Stents and Implants
- 11.1.1.3. Intraocular Lenses
- 11.1.1.4. Lasers
- 11.1.1.5. Other Surgical Devices
- 11.1.2. Diagnostic and Monitoring Devices
- 11.1.2.1. Autorefractors and Keratometers
- 11.1.2.2. Corneal Topography Systems
- 11.1.2.3. Ophthalmic Ultrasound Imaging Systems
- 11.1.2.4. Ophthalmoscopes
- 11.1.2.5. Optical Coherence Tomography Scanners
- 11.1.2.6. Other Diagnostic and Monitoring Devices
- 11.1.3. Vision Correction Devices
- 11.1.3.1. Spectacles
- 11.1.3.2. Contact Lenses
- 11.1.1. Surgical Devices
- 11.1. Market Analysis, Insights and Forecast - by Devices
- 12. Competitive Analysis
- 12.1. Company Profiles
- 12.1.1 HAAG-Streit Group
- 12.1.1.1. Company Overview
- 12.1.1.2. Products
- 12.1.1.3. Company Financials
- 12.1.1.4. SWOT Analysis
- 12.1.2 Ziemer Ophthalmic Systems AG
- 12.1.2.1. Company Overview
- 12.1.2.2. Products
- 12.1.2.3. Company Financials
- 12.1.2.4. SWOT Analysis
- 12.1.3 Nidek Co Ltd
- 12.1.3.1. Company Overview
- 12.1.3.2. Products
- 12.1.3.3. Company Financials
- 12.1.3.4. SWOT Analysis
- 12.1.4 EssilorLuxottica SA
- 12.1.4.1. Company Overview
- 12.1.4.2. Products
- 12.1.4.3. Company Financials
- 12.1.4.4. SWOT Analysis
- 12.1.5 Johnson and Johnson
- 12.1.5.1. Company Overview
- 12.1.5.2. Products
- 12.1.5.3. Company Financials
- 12.1.5.4. SWOT Analysis
- 12.1.6 Carl Zeiss AG
- 12.1.6.1. Company Overview
- 12.1.6.2. Products
- 12.1.6.3. Company Financials
- 12.1.6.4. SWOT Analysis
- 12.1.7 Topcon Corporation
- 12.1.7.1. Company Overview
- 12.1.7.2. Products
- 12.1.7.3. Company Financials
- 12.1.7.4. SWOT Analysis
- 12.1.8 Alcon Inc
- 12.1.8.1. Company Overview
- 12.1.8.2. Products
- 12.1.8.3. Company Financials
- 12.1.8.4. SWOT Analysis
- 12.1.9 Bausch Health Companies Inc
- 12.1.9.1. Company Overview
- 12.1.9.2. Products
- 12.1.9.3. Company Financials
- 12.1.9.4. SWOT Analysis
- 12.1.10 Hoya Corporation
- 12.1.10.1. Company Overview
- 12.1.10.2. Products
- 12.1.10.3. Company Financials
- 12.1.10.4. SWOT Analysis
- 12.1.1 HAAG-Streit Group
- 12.2. Market Entropy
- 12.2.1 Company's Key Areas Served
- 12.2.2 Recent Developments
- 12.3. Company Market Share Analysis 2025
- 12.3.1 Top 5 Companies Market Share Analysis
- 12.3.2 Top 3 Companies Market Share Analysis
- 12.4. List of Potential Customers
- 13. Research Methodology
List of Figures
- Figure 1: Global US Ophthalmic Devices Industry Revenue Breakdown (billion, %) by Region 2025 & 2033
- Figure 2: Global US Ophthalmic Devices Industry Volume Breakdown (K Unit, %) by Region 2025 & 2033
- Figure 3: North America US Ophthalmic Devices Industry Revenue (billion), by Devices 2025 & 2033
- Figure 4: North America US Ophthalmic Devices Industry Volume (K Unit), by Devices 2025 & 2033
- Figure 5: North America US Ophthalmic Devices Industry Revenue Share (%), by Devices 2025 & 2033
- Figure 6: North America US Ophthalmic Devices Industry Volume Share (%), by Devices 2025 & 2033
- Figure 7: North America US Ophthalmic Devices Industry Revenue (billion), by Country 2025 & 2033
- Figure 8: North America US Ophthalmic Devices Industry Volume (K Unit), by Country 2025 & 2033
- Figure 9: North America US Ophthalmic Devices Industry Revenue Share (%), by Country 2025 & 2033
- Figure 10: North America US Ophthalmic Devices Industry Volume Share (%), by Country 2025 & 2033
- Figure 11: South America US Ophthalmic Devices Industry Revenue (billion), by Devices 2025 & 2033
- Figure 12: South America US Ophthalmic Devices Industry Volume (K Unit), by Devices 2025 & 2033
- Figure 13: South America US Ophthalmic Devices Industry Revenue Share (%), by Devices 2025 & 2033
- Figure 14: South America US Ophthalmic Devices Industry Volume Share (%), by Devices 2025 & 2033
- Figure 15: South America US Ophthalmic Devices Industry Revenue (billion), by Country 2025 & 2033
- Figure 16: South America US Ophthalmic Devices Industry Volume (K Unit), by Country 2025 & 2033
- Figure 17: South America US Ophthalmic Devices Industry Revenue Share (%), by Country 2025 & 2033
- Figure 18: South America US Ophthalmic Devices Industry Volume Share (%), by Country 2025 & 2033
- Figure 19: Europe US Ophthalmic Devices Industry Revenue (billion), by Devices 2025 & 2033
- Figure 20: Europe US Ophthalmic Devices Industry Volume (K Unit), by Devices 2025 & 2033
- Figure 21: Europe US Ophthalmic Devices Industry Revenue Share (%), by Devices 2025 & 2033
- Figure 22: Europe US Ophthalmic Devices Industry Volume Share (%), by Devices 2025 & 2033
- Figure 23: Europe US Ophthalmic Devices Industry Revenue (billion), by Country 2025 & 2033
- Figure 24: Europe US Ophthalmic Devices Industry Volume (K Unit), by Country 2025 & 2033
- Figure 25: Europe US Ophthalmic Devices Industry Revenue Share (%), by Country 2025 & 2033
- Figure 26: Europe US Ophthalmic Devices Industry Volume Share (%), by Country 2025 & 2033
- Figure 27: Middle East & Africa US Ophthalmic Devices Industry Revenue (billion), by Devices 2025 & 2033
- Figure 28: Middle East & Africa US Ophthalmic Devices Industry Volume (K Unit), by Devices 2025 & 2033
- Figure 29: Middle East & Africa US Ophthalmic Devices Industry Revenue Share (%), by Devices 2025 & 2033
- Figure 30: Middle East & Africa US Ophthalmic Devices Industry Volume Share (%), by Devices 2025 & 2033
- Figure 31: Middle East & Africa US Ophthalmic Devices Industry Revenue (billion), by Country 2025 & 2033
- Figure 32: Middle East & Africa US Ophthalmic Devices Industry Volume (K Unit), by Country 2025 & 2033
- Figure 33: Middle East & Africa US Ophthalmic Devices Industry Revenue Share (%), by Country 2025 & 2033
- Figure 34: Middle East & Africa US Ophthalmic Devices Industry Volume Share (%), by Country 2025 & 2033
- Figure 35: Asia Pacific US Ophthalmic Devices Industry Revenue (billion), by Devices 2025 & 2033
- Figure 36: Asia Pacific US Ophthalmic Devices Industry Volume (K Unit), by Devices 2025 & 2033
- Figure 37: Asia Pacific US Ophthalmic Devices Industry Revenue Share (%), by Devices 2025 & 2033
- Figure 38: Asia Pacific US Ophthalmic Devices Industry Volume Share (%), by Devices 2025 & 2033
- Figure 39: Asia Pacific US Ophthalmic Devices Industry Revenue (billion), by Country 2025 & 2033
- Figure 40: Asia Pacific US Ophthalmic Devices Industry Volume (K Unit), by Country 2025 & 2033
- Figure 41: Asia Pacific US Ophthalmic Devices Industry Revenue Share (%), by Country 2025 & 2033
- Figure 42: Asia Pacific US Ophthalmic Devices Industry Volume Share (%), by Country 2025 & 2033
List of Tables
- Table 1: Global US Ophthalmic Devices Industry Revenue billion Forecast, by Devices 2020 & 2033
- Table 2: Global US Ophthalmic Devices Industry Volume K Unit Forecast, by Devices 2020 & 2033
- Table 3: Global US Ophthalmic Devices Industry Revenue billion Forecast, by Region 2020 & 2033
- Table 4: Global US Ophthalmic Devices Industry Volume K Unit Forecast, by Region 2020 & 2033
- Table 5: Global US Ophthalmic Devices Industry Revenue billion Forecast, by Devices 2020 & 2033
- Table 6: Global US Ophthalmic Devices Industry Volume K Unit Forecast, by Devices 2020 & 2033
- Table 7: Global US Ophthalmic Devices Industry Revenue billion Forecast, by Country 2020 & 2033
- Table 8: Global US Ophthalmic Devices Industry Volume K Unit Forecast, by Country 2020 & 2033
- Table 9: United States US Ophthalmic Devices Industry Revenue (billion) Forecast, by Application 2020 & 2033
- Table 10: United States US Ophthalmic Devices Industry Volume (K Unit) Forecast, by Application 2020 & 2033
- Table 11: Canada US Ophthalmic Devices Industry Revenue (billion) Forecast, by Application 2020 & 2033
- Table 12: Canada US Ophthalmic Devices Industry Volume (K Unit) Forecast, by Application 2020 & 2033
- Table 13: Mexico US Ophthalmic Devices Industry Revenue (billion) Forecast, by Application 2020 & 2033
- Table 14: Mexico US Ophthalmic Devices Industry Volume (K Unit) Forecast, by Application 2020 & 2033
- Table 15: Global US Ophthalmic Devices Industry Revenue billion Forecast, by Devices 2020 & 2033
- Table 16: Global US Ophthalmic Devices Industry Volume K Unit Forecast, by Devices 2020 & 2033
- Table 17: Global US Ophthalmic Devices Industry Revenue billion Forecast, by Country 2020 & 2033
- Table 18: Global US Ophthalmic Devices Industry Volume K Unit Forecast, by Country 2020 & 2033
- Table 19: Brazil US Ophthalmic Devices Industry Revenue (billion) Forecast, by Application 2020 & 2033
- Table 20: Brazil US Ophthalmic Devices Industry Volume (K Unit) Forecast, by Application 2020 & 2033
- Table 21: Argentina US Ophthalmic Devices Industry Revenue (billion) Forecast, by Application 2020 & 2033
- Table 22: Argentina US Ophthalmic Devices Industry Volume (K Unit) Forecast, by Application 2020 & 2033
- Table 23: Rest of South America US Ophthalmic Devices Industry Revenue (billion) Forecast, by Application 2020 & 2033
- Table 24: Rest of South America US Ophthalmic Devices Industry Volume (K Unit) Forecast, by Application 2020 & 2033
- Table 25: Global US Ophthalmic Devices Industry Revenue billion Forecast, by Devices 2020 & 2033
- Table 26: Global US Ophthalmic Devices Industry Volume K Unit Forecast, by Devices 2020 & 2033
- Table 27: Global US Ophthalmic Devices Industry Revenue billion Forecast, by Country 2020 & 2033
- Table 28: Global US Ophthalmic Devices Industry Volume K Unit Forecast, by Country 2020 & 2033
- Table 29: United Kingdom US Ophthalmic Devices Industry Revenue (billion) Forecast, by Application 2020 & 2033
- Table 30: United Kingdom US Ophthalmic Devices Industry Volume (K Unit) Forecast, by Application 2020 & 2033
- Table 31: Germany US Ophthalmic Devices Industry Revenue (billion) Forecast, by Application 2020 & 2033
- Table 32: Germany US Ophthalmic Devices Industry Volume (K Unit) Forecast, by Application 2020 & 2033
- Table 33: France US Ophthalmic Devices Industry Revenue (billion) Forecast, by Application 2020 & 2033
- Table 34: France US Ophthalmic Devices Industry Volume (K Unit) Forecast, by Application 2020 & 2033
- Table 35: Italy US Ophthalmic Devices Industry Revenue (billion) Forecast, by Application 2020 & 2033
- Table 36: Italy US Ophthalmic Devices Industry Volume (K Unit) Forecast, by Application 2020 & 2033
- Table 37: Spain US Ophthalmic Devices Industry Revenue (billion) Forecast, by Application 2020 & 2033
- Table 38: Spain US Ophthalmic Devices Industry Volume (K Unit) Forecast, by Application 2020 & 2033
- Table 39: Russia US Ophthalmic Devices Industry Revenue (billion) Forecast, by Application 2020 & 2033
- Table 40: Russia US Ophthalmic Devices Industry Volume (K Unit) Forecast, by Application 2020 & 2033
- Table 41: Benelux US Ophthalmic Devices Industry Revenue (billion) Forecast, by Application 2020 & 2033
- Table 42: Benelux US Ophthalmic Devices Industry Volume (K Unit) Forecast, by Application 2020 & 2033
- Table 43: Nordics US Ophthalmic Devices Industry Revenue (billion) Forecast, by Application 2020 & 2033
- Table 44: Nordics US Ophthalmic Devices Industry Volume (K Unit) Forecast, by Application 2020 & 2033
- Table 45: Rest of Europe US Ophthalmic Devices Industry Revenue (billion) Forecast, by Application 2020 & 2033
- Table 46: Rest of Europe US Ophthalmic Devices Industry Volume (K Unit) Forecast, by Application 2020 & 2033
- Table 47: Global US Ophthalmic Devices Industry Revenue billion Forecast, by Devices 2020 & 2033
- Table 48: Global US Ophthalmic Devices Industry Volume K Unit Forecast, by Devices 2020 & 2033
- Table 49: Global US Ophthalmic Devices Industry Revenue billion Forecast, by Country 2020 & 2033
- Table 50: Global US Ophthalmic Devices Industry Volume K Unit Forecast, by Country 2020 & 2033
- Table 51: Turkey US Ophthalmic Devices Industry Revenue (billion) Forecast, by Application 2020 & 2033
- Table 52: Turkey US Ophthalmic Devices Industry Volume (K Unit) Forecast, by Application 2020 & 2033
- Table 53: Israel US Ophthalmic Devices Industry Revenue (billion) Forecast, by Application 2020 & 2033
- Table 54: Israel US Ophthalmic Devices Industry Volume (K Unit) Forecast, by Application 2020 & 2033
- Table 55: GCC US Ophthalmic Devices Industry Revenue (billion) Forecast, by Application 2020 & 2033
- Table 56: GCC US Ophthalmic Devices Industry Volume (K Unit) Forecast, by Application 2020 & 2033
- Table 57: North Africa US Ophthalmic Devices Industry Revenue (billion) Forecast, by Application 2020 & 2033
- Table 58: North Africa US Ophthalmic Devices Industry Volume (K Unit) Forecast, by Application 2020 & 2033
- Table 59: South Africa US Ophthalmic Devices Industry Revenue (billion) Forecast, by Application 2020 & 2033
- Table 60: South Africa US Ophthalmic Devices Industry Volume (K Unit) Forecast, by Application 2020 & 2033
- Table 61: Rest of Middle East & Africa US Ophthalmic Devices Industry Revenue (billion) Forecast, by Application 2020 & 2033
- Table 62: Rest of Middle East & Africa US Ophthalmic Devices Industry Volume (K Unit) Forecast, by Application 2020 & 2033
- Table 63: Global US Ophthalmic Devices Industry Revenue billion Forecast, by Devices 2020 & 2033
- Table 64: Global US Ophthalmic Devices Industry Volume K Unit Forecast, by Devices 2020 & 2033
- Table 65: Global US Ophthalmic Devices Industry Revenue billion Forecast, by Country 2020 & 2033
- Table 66: Global US Ophthalmic Devices Industry Volume K Unit Forecast, by Country 2020 & 2033
- Table 67: China US Ophthalmic Devices Industry Revenue (billion) Forecast, by Application 2020 & 2033
- Table 68: China US Ophthalmic Devices Industry Volume (K Unit) Forecast, by Application 2020 & 2033
- Table 69: India US Ophthalmic Devices Industry Revenue (billion) Forecast, by Application 2020 & 2033
- Table 70: India US Ophthalmic Devices Industry Volume (K Unit) Forecast, by Application 2020 & 2033
- Table 71: Japan US Ophthalmic Devices Industry Revenue (billion) Forecast, by Application 2020 & 2033
- Table 72: Japan US Ophthalmic Devices Industry Volume (K Unit) Forecast, by Application 2020 & 2033
- Table 73: South Korea US Ophthalmic Devices Industry Revenue (billion) Forecast, by Application 2020 & 2033
- Table 74: South Korea US Ophthalmic Devices Industry Volume (K Unit) Forecast, by Application 2020 & 2033
- Table 75: ASEAN US Ophthalmic Devices Industry Revenue (billion) Forecast, by Application 2020 & 2033
- Table 76: ASEAN US Ophthalmic Devices Industry Volume (K Unit) Forecast, by Application 2020 & 2033
- Table 77: Oceania US Ophthalmic Devices Industry Revenue (billion) Forecast, by Application 2020 & 2033
- Table 78: Oceania US Ophthalmic Devices Industry Volume (K Unit) Forecast, by Application 2020 & 2033
- Table 79: Rest of Asia Pacific US Ophthalmic Devices Industry Revenue (billion) Forecast, by Application 2020 & 2033
- Table 80: Rest of Asia Pacific US Ophthalmic Devices Industry Volume (K Unit) Forecast, by Application 2020 & 2033
Frequently Asked Questions
1. What is the projected Compound Annual Growth Rate (CAGR) of the US Ophthalmic Devices Industry?
The projected CAGR is approximately 8.6%.
2. Which companies are prominent players in the US Ophthalmic Devices Industry?
Key companies in the market include HAAG-Streit Group, Ziemer Ophthalmic Systems AG, Nidek Co Ltd, EssilorLuxottica SA, Johnson and Johnson, Carl Zeiss AG, Topcon Corporation, Alcon Inc, Bausch Health Companies Inc, Hoya Corporation.
3. What are the main segments of the US Ophthalmic Devices Industry?
The market segments include Devices.
4. Can you provide details about the market size?
The market size is estimated to be USD 20.5 billion as of 2022.
5. What are some drivers contributing to market growth?
Demographic Shift and Increasing Prevalence of Eye Diseases; Rising Geriatric Population; Technological Advancements in Ophthalmic Devices.
6. What are the notable trends driving market growth?
Contact Lens are Expected to Register a Significant Growth in the United States Ophthalmic Devices Market Over the Forecast Period.
7. Are there any restraints impacting market growth?
Risk Associated with Ophthalmic Procedures.
8. Can you provide examples of recent developments in the market?
November 2022: Sight Sciences reported a publication of clinical data demonstrating the standalone effectiveness of the OMNI Surgical System in pseudophakic glaucoma patients with uncontrolled pressure following a previous combination cataract stent procedure.
9. What pricing options are available for accessing the report?
Pricing options include single-user, multi-user, and enterprise licenses priced at USD 3800, USD 4500, and USD 5800 respectively.
10. Is the market size provided in terms of value or volume?
The market size is provided in terms of value, measured in billion and volume, measured in K Unit.
11. Are there any specific market keywords associated with the report?
Yes, the market keyword associated with the report is "US Ophthalmic Devices Industry," which aids in identifying and referencing the specific market segment covered.
12. How do I determine which pricing option suits my needs best?
The pricing options vary based on user requirements and access needs. Individual users may opt for single-user licenses, while businesses requiring broader access may choose multi-user or enterprise licenses for cost-effective access to the report.
13. Are there any additional resources or data provided in the US Ophthalmic Devices Industry report?
While the report offers comprehensive insights, it's advisable to review the specific contents or supplementary materials provided to ascertain if additional resources or data are available.
14. How can I stay updated on further developments or reports in the US Ophthalmic Devices Industry?
To stay informed about further developments, trends, and reports in the US Ophthalmic Devices Industry, consider subscribing to industry newsletters, following relevant companies and organizations, or regularly checking reputable industry news sources and publications.
Methodology
Step 1 - Identification of Relevant Samples Size from Population Database


Step 2 - Approaches for Defining Global Market Size (Value, Volume* & Price*)

Note*: In applicable scenarios
Step 3 - Data Sources
Primary Research
- Web Analytics
- Survey Reports
- Research Institute
- Latest Research Reports
- Opinion Leaders
Secondary Research
- Annual Reports
- White Paper
- Latest Press Release
- Industry Association
- Paid Database
- Investor Presentations

Step 4 - Data Triangulation
Involves using different sources of information in order to increase the validity of a study
These sources are likely to be stakeholders in a program - participants, other researchers, program staff, other community members, and so on.
Then we put all data in single framework & apply various statistical tools to find out the dynamic on the market.
During the analysis stage, feedback from the stakeholder groups would be compared to determine areas of agreement as well as areas of divergence