

Key Insights
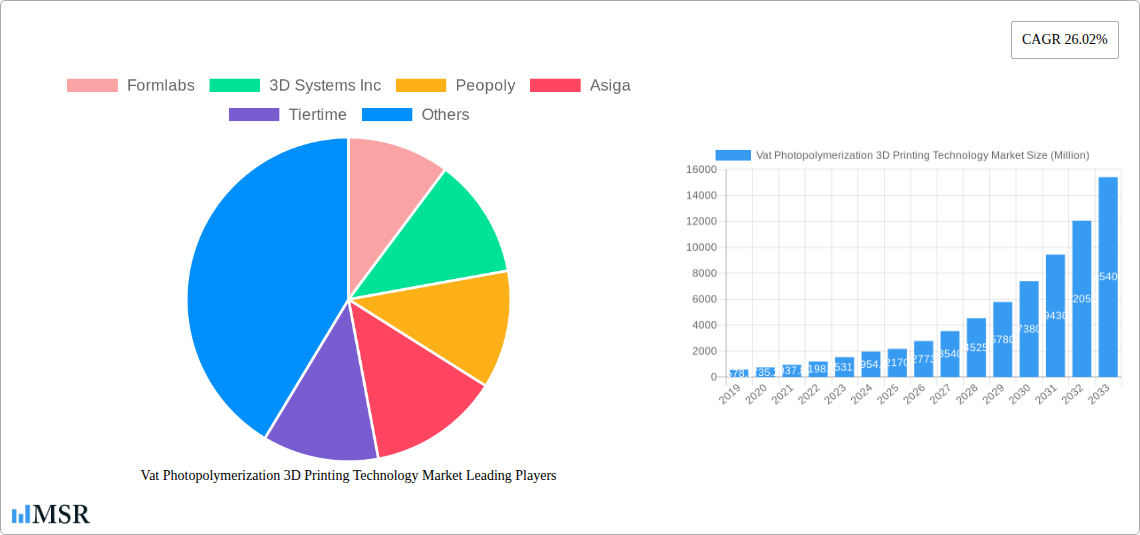
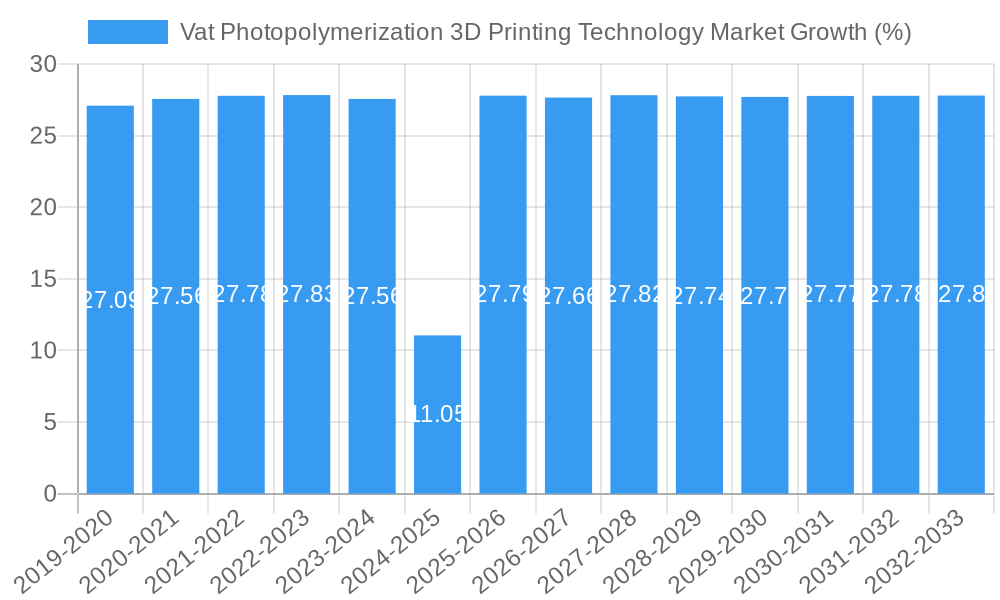
The Vat Photopolymerization 3D Printing Technology Market is experiencing remarkable growth, projected to reach approximately USD 2.17 billion in 2025. Driven by an impressive Compound Annual Growth Rate (CAGR) of 26.02%, this market is set to expand significantly through the forecast period ending in 2033. This rapid expansion is fueled by key advancements in materials science, leading to the development of more versatile and robust photopolymer resins. The increasing adoption of these technologies across high-value sectors like dentistry and orthopedics, where intricate and precise parts are paramount, is a major catalyst. Innovations in stereolithography (SLA), digital light processing (DLP), and continuous digital light processing (CDLP) are enhancing build speeds, resolution, and material compatibility, making vat photopolymerization increasingly competitive with traditional manufacturing methods. Furthermore, the growing demand for personalized medical devices and patient-specific implants directly benefits from the precision and customization capabilities offered by these 3D printing techniques.
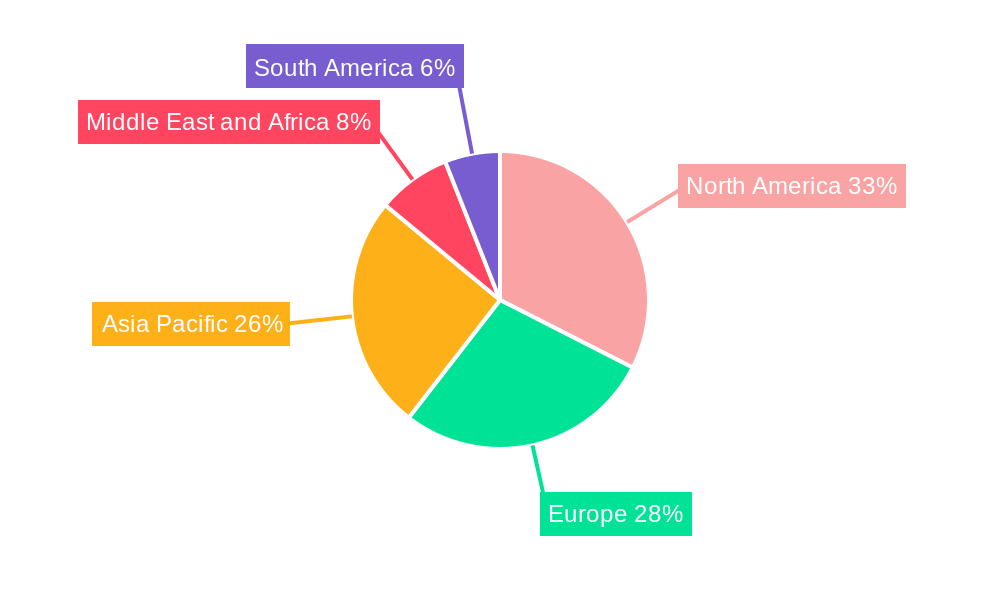
The market's trajectory is also being shaped by a dynamic interplay of trends and restraints. While the high initial investment costs for professional-grade vat photopolymerization systems and the need for specialized post-processing can pose challenges, ongoing technological refinements are gradually addressing these concerns. The emergence of more accessible desktop SLA and DLP printers, coupled with advancements in automated post-processing solutions, is democratizing access and broadening the user base. Geographically, North America and Europe are leading the adoption due to robust healthcare infrastructure and significant R&D investments. However, the Asia Pacific region, particularly China and Japan, is expected to witness substantial growth, driven by increasing healthcare expenditure, a burgeoning manufacturing sector, and government initiatives supporting advanced manufacturing technologies. Companies like Formlabs, 3D Systems Inc., and Peopoly are at the forefront of this innovation, continually pushing the boundaries of what is possible with vat photopolymerization.
Report Description:
Dive deep into the rapidly evolving Vat Photopolymerization 3D Printing Technology Market, a pivotal sector driving innovation across dentistry, orthopedics, tissue engineering, and beyond. This in-depth report provides an exhaustive analysis of market dynamics, key trends, and future opportunities from 2019 to 2033, with a focused outlook on 2025 and the forecast period. We meticulously dissect the Stereolithography (SLA), Digital Light Processing (DLP), and Continuous Digital Light Processing (CDLP) segments, exploring their technological advancements and market penetration. Understand the intricate value chain, from hardware and software to services and advanced materials, and gain insights into the strategies of leading players like Formlabs, 3D Systems Inc, Peopoly, Asiga, Tiertime, Tasly Holding Group, UnionTech, Zortrax, and Rayshape. This report is an indispensable resource for industry stakeholders seeking to capitalize on the burgeoning demand for high-precision, advanced additive manufacturing solutions.
Vat Photopolymerization 3D Printing Technology Market Market Concentration & Dynamics
The Vat Photopolymerization 3D Printing Technology Market is characterized by a dynamic interplay of established players and innovative startups, contributing to a moderately concentrated market landscape. Innovation ecosystems are flourishing, driven by significant investments in R&D to enhance print speed, resolution, and material capabilities. Formlabs and 3D Systems Inc continue to hold substantial market shares, fueled by their comprehensive product portfolios and established distribution networks. However, specialized players like Peopoly and Asiga are carving out niches with their advanced SLA and DLP systems, particularly for industrial and dental applications. Regulatory frameworks, while evolving to accommodate novel medical and industrial uses, are also a significant factor influencing market entry and product development. The threat of substitute products, such as other additive manufacturing technologies or traditional manufacturing methods, is mitigated by the unique precision and material properties offered by vat photopolymerization. End-user trends, particularly the increasing demand for personalized medical devices and high-fidelity prototypes, are directly shaping market direction. Mergers and acquisitions (M&A) activity is anticipated to remain robust as larger companies seek to acquire cutting-edge technologies and expand their market reach. The number of M&A deals in the historical period (2019-2024) has been approximately 25, signaling consolidation and strategic growth. Future market concentration will likely depend on the pace of technological innovation and the ability of new entrants to disrupt established value chains.
Vat Photopolymerization 3D Printing Technology Market Industry Insights & Trends
The Vat Photopolymerization 3D Printing Technology Market is experiencing robust growth, projected to reach an estimated USD 8,500 Million by 2025, with a compelling Compound Annual Growth Rate (CAGR) of 18.5% from 2019 to 2033. This expansion is propelled by a confluence of technological advancements and escalating adoption across diverse sectors. The inherent precision, speed, and ability to produce intricate geometries make vat photopolymerization technologies, particularly SLA and DLP, indispensable for applications demanding high accuracy. Key growth drivers include the burgeoning demand for dental prosthetics, orthodontic aligners, and surgical guides within the healthcare industry, where the ability to create patient-specific solutions is paramount. The market size for healthcare applications alone is estimated to surpass USD 3,000 Million by 2025. Furthermore, the aerospace and automotive industries are increasingly leveraging vat photopolymerization for rapid prototyping, tooling, and the production of complex end-use parts, driving demand for advanced engineering-grade photopolymer resins.
Technological disruptions are a constant feature, with innovations in resin chemistry leading to materials with enhanced mechanical properties, biocompatibility, and temperature resistance. The emergence of Continuous Digital Light Processing (CDLP) further amplifies print speeds, making mass production more feasible. Consumer behaviors are also evolving, with a growing appreciation for customized products and on-demand manufacturing. This shift is particularly evident in consumer goods and electronics, where the ability to create unique designs and functional prototypes is a significant differentiator. The integration of AI and machine learning into 3D printing workflows is also optimizing print parameters, reducing waste, and improving overall efficiency, further solidifying the market's growth trajectory. The estimated market size for hardware components is projected to reach USD 4,000 Million by 2025, while materials are expected to contribute USD 3,500 Million.
Key Markets & Segments Leading Vat Photopolymerization 3D Printing Technology Market
The Vat Photopolymerization 3D Printing Technology Market is witnessing significant dominance from the Healthcare sector, particularly Dentistry, which stands as the primary market driver. This dominance is fueled by the unparalleled ability of SLA and DLP technologies to produce highly accurate dental models, crowns, bridges, and orthodontic appliances with exceptional detail and biocompatibility. The estimated market size for dental applications is projected to reach USD 2,500 Million by 2025.
Component Dominance:
- Hardware: The hardware segment, encompassing 3D printers themselves, is the largest contributor, projected to reach USD 4,000 Million by 2025. The continuous development of higher resolution, faster printing speeds, and larger build volumes for SLA and DLP printers directly fuels this segment's growth. Key drivers include technological advancements in light sources (lasers and projectors) and advancements in mechanical design for precision movement.
- Materials: The materials segment is also a significant driver, anticipated to reach USD 3,500 Million by 2025. The development of novel photopolymer resins with enhanced properties such as flexibility, strength, biocompatibility, and high-temperature resistance is crucial for expanding applications. Economic growth and increased investment in R&D for material science are key factors.
Technology Dominance:
- Stereolithography (SLA): SLA remains the dominant technology due to its established history, high precision, and excellent surface finish, making it ideal for intricate designs. Drivers include continued refinement of laser accuracy and material formulations.
- Digital Light Processing (DLP): DLP is rapidly gaining traction due to its faster print speeds compared to traditional SLA, driven by the ability to cure entire layers simultaneously. Economic factors favor DLP for applications requiring higher throughput.
Application Dominance:
- Dentistry: As mentioned, Dentistry is the leading application, driven by the need for personalized, high-precision dental restorations and appliances. The increasing prevalence of dental conditions and the growing demand for aesthetic treatments further propel this segment.
- Orthopedics: The Orthopedics segment is experiencing significant growth due to the demand for custom-fitted prosthetics, orthotics, and surgical guides. Drivers include advancements in medical imaging and the growing need for patient-specific treatment solutions.
Geographically, North America and Europe currently lead the market, driven by strong healthcare infrastructure, high disposable incomes, and significant R&D investments. However, the Asia-Pacific region is emerging as a high-growth market due to expanding healthcare access, increasing adoption of advanced manufacturing technologies, and a growing base of dental laboratories and orthopedic clinics.
Vat Photopolymerization 3D Printing Technology Market Product Developments
Recent product developments in the Vat Photopolymerization 3D Printing Technology Market highlight a clear trend towards enhanced speed, accuracy, and expanded material capabilities. Innovations are focused on miniaturization for desktop use, industrial-scale solutions, and specialized applications. The introduction of continuous build processes, as seen with Sprybuild's SLA printer, promises to revolutionize production efficiency by enabling non-stop printing on a conveyor belt. This is particularly impactful for serial production of items like dental models and orthopedic insoles. Furthermore, the launch of dedicated dental 3D printers like SHINING 3D's AccuFab-CEL signifies a growing market focus on tailored solutions for specific industries, offering optimized workflows and material compatibility for dental professionals.
Challenges in the Vat Photopolymerization 3D Printing Technology Market Market
Despite its rapid growth, the Vat Photopolymerization 3D Printing Technology Market faces several challenges. Regulatory hurdles, particularly for medical-grade applications, can slow down market entry and require extensive validation processes. Supply chain issues, including the availability and cost of specialized photopolymer resins and components, can impact production and pricing. Furthermore, the competitive pressure from other additive manufacturing technologies and established traditional manufacturing methods necessitates continuous innovation and cost optimization. The initial investment cost for high-end vat photopolymerization systems can also be a barrier for smaller enterprises and individual practitioners, impacting widespread adoption.
Forces Driving Vat Photopolymerization 3D Printing Technology Market Growth
Several powerful forces are driving the growth of the Vat Photopolymerization 3D Printing Technology Market. Technological advancements, such as increased print resolution, faster printing speeds, and the development of a wider range of advanced photopolymer materials with improved mechanical and biocompatible properties, are fundamental drivers. The escalating demand for personalized medical devices, particularly in dentistry and orthopedics, where custom-fit solutions are essential for patient outcomes, is a significant catalyst. Furthermore, the increasing adoption of 3D printing for rapid prototyping and low-volume production in industries like aerospace, automotive, and consumer goods, seeking to accelerate product development cycles and reduce costs, also contributes significantly.
Challenges in the Vat Photopolymerization 3D Printing Technology Market Market
Looking beyond immediate challenges, long-term growth catalysts for the Vat Photopolymerization 3D Printing Technology Market lie in continued innovation and market expansion. The development of novel photopolymer materials with even more advanced functionalities, such as self-healing capabilities, enhanced conductivity, or specialized drug-delivery properties, will unlock new application frontiers. Strategic partnerships between material manufacturers, printer vendors, and end-users will foster greater interoperability and tailor-made solutions. Furthermore, the increasing accessibility and affordability of vat photopolymerization systems, driven by economies of scale and technological miniaturization, will fuel adoption in emerging economies and broader industrial sectors. The integration of these technologies into broader manufacturing ecosystems and the development of robust post-processing solutions will solidify their long-term viability.
Emerging Opportunities in Vat Photopolymerization 3D Printing Technology Market
The Vat Photopolymerization 3D Printing Technology Market is ripe with emerging opportunities. The expansion of its use in tissue engineering and bioprinting presents a revolutionary frontier, with the potential to create complex biological scaffolds and even functional organs. The growing trend of distributed manufacturing and on-demand production across various industries, from consumer electronics to specialized industrial components, offers significant market potential. The development of more sustainable and eco-friendly photopolymer resins, addressing environmental concerns, will also be a key differentiator. Furthermore, the increasing integration of AI and machine learning in optimizing print processes, material selection, and quality control presents opportunities for enhanced efficiency and user experience. Exploring new markets in sectors like jewelry design and advanced optics also holds promise.
Leading Players in the Vat Photopolymerization 3D Printing Technology Market Sector
- Formlabs
- 3D Systems Inc
- Peopoly
- Asiga
- Tiertime
- Tasly Holding Group
- UnionTech
- Zortrax
- Rayshape
Key Milestones in Vat Photopolymerization 3D Printing Technology Market Industry
- March 2024: Sprybuild, an Israeli start-up, reported the launch of its SLA 3D printer featuring a patented continuous build process on a conveyor belt and rigid optical interface. This innovation significantly enhances production speed and efficiency for applications like dental models, orthopedic insoles, eyeglass frames, hearing aids, and prosthetic components.
- February 2024: SHINING 3D, a prominent 3D digitization and printing solutions provider, announced the launch of its AccuFab-CEL, a specialized dental 3D printer, at LabDay 2024, the largest dental laboratory event in the United States. This launch underscores the growing focus on industry-specific solutions within the vat photopolymerization market.
Strategic Outlook for Vat Photopolymerization 3D Printing Technology Market Market
The strategic outlook for the Vat Photopolymerization 3D Printing Technology Market is exceptionally promising, driven by relentless innovation and expanding application landscapes. Continued investment in R&D for novel photopolymer materials with enhanced functionalities, such as superior biocompatibility for medical implants or advanced mechanical properties for industrial tooling, will be a key growth accelerator. The strategic focus on developing more integrated software solutions, including AI-powered design optimization and automated quality control, will further streamline workflows and enhance user accessibility. Partnerships and collaborations between technology providers, material scientists, and industry-specific end-users will be crucial for developing bespoke solutions and unlocking new market segments, particularly in the burgeoning fields of bioprinting and advanced functional components. The trend towards decentralized manufacturing and on-demand production will also foster strategic opportunities for market expansion into new geographical regions and industries seeking to leverage the precision and efficiency of vat photopolymerization.
Vat Photopolymerization 3D Printing Technology Market Segmentation
-
1. Component
- 1.1. Hardware
- 1.2. Software
- 1.3. Services
- 1.4. Materials
-
2. Technology
- 2.1. Stereolithography (SLA)
- 2.2. Digital Light Processing (DLP)
- 2.3. Continuous Digital Light Processing (CDLP)
-
3. Application
- 3.1. Dentistry
- 3.2. Orthopedics
- 3.3. Tissue Engineering
- 3.4. Other Ap
Vat Photopolymerization 3D Printing Technology Market Segmentation By Geography
-
1. North America
- 1.1. United States
- 1.2. Canada
- 1.3. Mexico
-
2. Europe
- 2.1. Germany
- 2.2. United Kingdom
- 2.3. France
- 2.4. Italy
- 2.5. Spain
- 2.6. Rest of Europe
-
3. Asia Pacific
- 3.1. China
- 3.2. Japan
- 3.3. India
- 3.4. Australia
- 3.5. South Korea
- 3.6. Rest of Asia Pacific
-
4. Middle East and Africa
- 4.1. GCC
- 4.2. South Africa
- 4.3. Rest of Middle East and Africa
-
5. South America
- 5.1. Brazil
- 5.2. Argentina
- 5.3. Rest of South America
Vat Photopolymerization 3D Printing Technology Market REPORT HIGHLIGHTS
| Aspects | Details |
|---|---|
| Study Period | 2019-2033 |
| Base Year | 2024 |
| Estimated Year | 2025 |
| Forecast Period | 2025-2033 |
| Historical Period | 2019-2024 |
| Growth Rate | CAGR of 26.02% from 2019-2033 |
| Segmentation |
|
Table of Contents
- 1. Introduction
- 1.1. Research Scope
- 1.2. Market Segmentation
- 1.3. Research Methodology
- 1.4. Definitions and Assumptions
- 2. Executive Summary
- 2.1. Introduction
- 3. Market Dynamics
- 3.1. Introduction
- 3.2. Market Drivers
- 3.2.1. Rising Demand for Minimally Invasive Procedures; Growing Technological Advancements
- 3.3. Market Restrains
- 3.3.1. Rising Demand for Minimally Invasive Procedures; Growing Technological Advancements
- 3.4. Market Trends
- 3.4.1. Orthopedics Segment Expected to Hold a Significant Market Share Over the Forecast Period
- 4. Market Factor Analysis
- 4.1. Porters Five Forces
- 4.2. Supply/Value Chain
- 4.3. PESTEL analysis
- 4.4. Market Entropy
- 4.5. Patent/Trademark Analysis
- 5. Global Vat Photopolymerization 3D Printing Technology Market Analysis, Insights and Forecast, 2019-2031
- 5.1. Market Analysis, Insights and Forecast - by Component
- 5.1.1. Hardware
- 5.1.2. Software
- 5.1.3. Services
- 5.1.4. Materials
- 5.2. Market Analysis, Insights and Forecast - by Technology
- 5.2.1. Stereolithography (SLA)
- 5.2.2. Digital Light Processing (DLP)
- 5.2.3. Continuous Digital Light Processing (CDLP)
- 5.3. Market Analysis, Insights and Forecast - by Application
- 5.3.1. Dentistry
- 5.3.2. Orthopedics
- 5.3.3. Tissue Engineering
- 5.3.4. Other Ap
- 5.4. Market Analysis, Insights and Forecast - by Region
- 5.4.1. North America
- 5.4.2. Europe
- 5.4.3. Asia Pacific
- 5.4.4. Middle East and Africa
- 5.4.5. South America
- 5.1. Market Analysis, Insights and Forecast - by Component
- 6. North America Vat Photopolymerization 3D Printing Technology Market Analysis, Insights and Forecast, 2019-2031
- 6.1. Market Analysis, Insights and Forecast - by Component
- 6.1.1. Hardware
- 6.1.2. Software
- 6.1.3. Services
- 6.1.4. Materials
- 6.2. Market Analysis, Insights and Forecast - by Technology
- 6.2.1. Stereolithography (SLA)
- 6.2.2. Digital Light Processing (DLP)
- 6.2.3. Continuous Digital Light Processing (CDLP)
- 6.3. Market Analysis, Insights and Forecast - by Application
- 6.3.1. Dentistry
- 6.3.2. Orthopedics
- 6.3.3. Tissue Engineering
- 6.3.4. Other Ap
- 6.1. Market Analysis, Insights and Forecast - by Component
- 7. Europe Vat Photopolymerization 3D Printing Technology Market Analysis, Insights and Forecast, 2019-2031
- 7.1. Market Analysis, Insights and Forecast - by Component
- 7.1.1. Hardware
- 7.1.2. Software
- 7.1.3. Services
- 7.1.4. Materials
- 7.2. Market Analysis, Insights and Forecast - by Technology
- 7.2.1. Stereolithography (SLA)
- 7.2.2. Digital Light Processing (DLP)
- 7.2.3. Continuous Digital Light Processing (CDLP)
- 7.3. Market Analysis, Insights and Forecast - by Application
- 7.3.1. Dentistry
- 7.3.2. Orthopedics
- 7.3.3. Tissue Engineering
- 7.3.4. Other Ap
- 7.1. Market Analysis, Insights and Forecast - by Component
- 8. Asia Pacific Vat Photopolymerization 3D Printing Technology Market Analysis, Insights and Forecast, 2019-2031
- 8.1. Market Analysis, Insights and Forecast - by Component
- 8.1.1. Hardware
- 8.1.2. Software
- 8.1.3. Services
- 8.1.4. Materials
- 8.2. Market Analysis, Insights and Forecast - by Technology
- 8.2.1. Stereolithography (SLA)
- 8.2.2. Digital Light Processing (DLP)
- 8.2.3. Continuous Digital Light Processing (CDLP)
- 8.3. Market Analysis, Insights and Forecast - by Application
- 8.3.1. Dentistry
- 8.3.2. Orthopedics
- 8.3.3. Tissue Engineering
- 8.3.4. Other Ap
- 8.1. Market Analysis, Insights and Forecast - by Component
- 9. Middle East and Africa Vat Photopolymerization 3D Printing Technology Market Analysis, Insights and Forecast, 2019-2031
- 9.1. Market Analysis, Insights and Forecast - by Component
- 9.1.1. Hardware
- 9.1.2. Software
- 9.1.3. Services
- 9.1.4. Materials
- 9.2. Market Analysis, Insights and Forecast - by Technology
- 9.2.1. Stereolithography (SLA)
- 9.2.2. Digital Light Processing (DLP)
- 9.2.3. Continuous Digital Light Processing (CDLP)
- 9.3. Market Analysis, Insights and Forecast - by Application
- 9.3.1. Dentistry
- 9.3.2. Orthopedics
- 9.3.3. Tissue Engineering
- 9.3.4. Other Ap
- 9.1. Market Analysis, Insights and Forecast - by Component
- 10. South America Vat Photopolymerization 3D Printing Technology Market Analysis, Insights and Forecast, 2019-2031
- 10.1. Market Analysis, Insights and Forecast - by Component
- 10.1.1. Hardware
- 10.1.2. Software
- 10.1.3. Services
- 10.1.4. Materials
- 10.2. Market Analysis, Insights and Forecast - by Technology
- 10.2.1. Stereolithography (SLA)
- 10.2.2. Digital Light Processing (DLP)
- 10.2.3. Continuous Digital Light Processing (CDLP)
- 10.3. Market Analysis, Insights and Forecast - by Application
- 10.3.1. Dentistry
- 10.3.2. Orthopedics
- 10.3.3. Tissue Engineering
- 10.3.4. Other Ap
- 10.1. Market Analysis, Insights and Forecast - by Component
- 11. Competitive Analysis
- 11.1. Global Market Share Analysis 2024
- 11.2. Company Profiles
- 11.2.1 Formlabs
- 11.2.1.1. Overview
- 11.2.1.2. Products
- 11.2.1.3. SWOT Analysis
- 11.2.1.4. Recent Developments
- 11.2.1.5. Financials (Based on Availability)
- 11.2.2 3D Systems Inc
- 11.2.2.1. Overview
- 11.2.2.2. Products
- 11.2.2.3. SWOT Analysis
- 11.2.2.4. Recent Developments
- 11.2.2.5. Financials (Based on Availability)
- 11.2.3 Peopoly
- 11.2.3.1. Overview
- 11.2.3.2. Products
- 11.2.3.3. SWOT Analysis
- 11.2.3.4. Recent Developments
- 11.2.3.5. Financials (Based on Availability)
- 11.2.4 Asiga
- 11.2.4.1. Overview
- 11.2.4.2. Products
- 11.2.4.3. SWOT Analysis
- 11.2.4.4. Recent Developments
- 11.2.4.5. Financials (Based on Availability)
- 11.2.5 Tiertime
- 11.2.5.1. Overview
- 11.2.5.2. Products
- 11.2.5.3. SWOT Analysis
- 11.2.5.4. Recent Developments
- 11.2.5.5. Financials (Based on Availability)
- 11.2.6 Tasly Holding Group
- 11.2.6.1. Overview
- 11.2.6.2. Products
- 11.2.6.3. SWOT Analysis
- 11.2.6.4. Recent Developments
- 11.2.6.5. Financials (Based on Availability)
- 11.2.7 UnionTech
- 11.2.7.1. Overview
- 11.2.7.2. Products
- 11.2.7.3. SWOT Analysis
- 11.2.7.4. Recent Developments
- 11.2.7.5. Financials (Based on Availability)
- 11.2.8 Zortrax
- 11.2.8.1. Overview
- 11.2.8.2. Products
- 11.2.8.3. SWOT Analysis
- 11.2.8.4. Recent Developments
- 11.2.8.5. Financials (Based on Availability)
- 11.2.9 Rayshape*List Not Exhaustive
- 11.2.9.1. Overview
- 11.2.9.2. Products
- 11.2.9.3. SWOT Analysis
- 11.2.9.4. Recent Developments
- 11.2.9.5. Financials (Based on Availability)
- 11.2.1 Formlabs
List of Figures
- Figure 1: Global Vat Photopolymerization 3D Printing Technology Market Revenue Breakdown (Million, %) by Region 2024 & 2032
- Figure 2: Global Vat Photopolymerization 3D Printing Technology Market Volume Breakdown (Billion, %) by Region 2024 & 2032
- Figure 3: North America Vat Photopolymerization 3D Printing Technology Market Revenue (Million), by Component 2024 & 2032
- Figure 4: North America Vat Photopolymerization 3D Printing Technology Market Volume (Billion), by Component 2024 & 2032
- Figure 5: North America Vat Photopolymerization 3D Printing Technology Market Revenue Share (%), by Component 2024 & 2032
- Figure 6: North America Vat Photopolymerization 3D Printing Technology Market Volume Share (%), by Component 2024 & 2032
- Figure 7: North America Vat Photopolymerization 3D Printing Technology Market Revenue (Million), by Technology 2024 & 2032
- Figure 8: North America Vat Photopolymerization 3D Printing Technology Market Volume (Billion), by Technology 2024 & 2032
- Figure 9: North America Vat Photopolymerization 3D Printing Technology Market Revenue Share (%), by Technology 2024 & 2032
- Figure 10: North America Vat Photopolymerization 3D Printing Technology Market Volume Share (%), by Technology 2024 & 2032
- Figure 11: North America Vat Photopolymerization 3D Printing Technology Market Revenue (Million), by Application 2024 & 2032
- Figure 12: North America Vat Photopolymerization 3D Printing Technology Market Volume (Billion), by Application 2024 & 2032
- Figure 13: North America Vat Photopolymerization 3D Printing Technology Market Revenue Share (%), by Application 2024 & 2032
- Figure 14: North America Vat Photopolymerization 3D Printing Technology Market Volume Share (%), by Application 2024 & 2032
- Figure 15: North America Vat Photopolymerization 3D Printing Technology Market Revenue (Million), by Country 2024 & 2032
- Figure 16: North America Vat Photopolymerization 3D Printing Technology Market Volume (Billion), by Country 2024 & 2032
- Figure 17: North America Vat Photopolymerization 3D Printing Technology Market Revenue Share (%), by Country 2024 & 2032
- Figure 18: North America Vat Photopolymerization 3D Printing Technology Market Volume Share (%), by Country 2024 & 2032
- Figure 19: Europe Vat Photopolymerization 3D Printing Technology Market Revenue (Million), by Component 2024 & 2032
- Figure 20: Europe Vat Photopolymerization 3D Printing Technology Market Volume (Billion), by Component 2024 & 2032
- Figure 21: Europe Vat Photopolymerization 3D Printing Technology Market Revenue Share (%), by Component 2024 & 2032
- Figure 22: Europe Vat Photopolymerization 3D Printing Technology Market Volume Share (%), by Component 2024 & 2032
- Figure 23: Europe Vat Photopolymerization 3D Printing Technology Market Revenue (Million), by Technology 2024 & 2032
- Figure 24: Europe Vat Photopolymerization 3D Printing Technology Market Volume (Billion), by Technology 2024 & 2032
- Figure 25: Europe Vat Photopolymerization 3D Printing Technology Market Revenue Share (%), by Technology 2024 & 2032
- Figure 26: Europe Vat Photopolymerization 3D Printing Technology Market Volume Share (%), by Technology 2024 & 2032
- Figure 27: Europe Vat Photopolymerization 3D Printing Technology Market Revenue (Million), by Application 2024 & 2032
- Figure 28: Europe Vat Photopolymerization 3D Printing Technology Market Volume (Billion), by Application 2024 & 2032
- Figure 29: Europe Vat Photopolymerization 3D Printing Technology Market Revenue Share (%), by Application 2024 & 2032
- Figure 30: Europe Vat Photopolymerization 3D Printing Technology Market Volume Share (%), by Application 2024 & 2032
- Figure 31: Europe Vat Photopolymerization 3D Printing Technology Market Revenue (Million), by Country 2024 & 2032
- Figure 32: Europe Vat Photopolymerization 3D Printing Technology Market Volume (Billion), by Country 2024 & 2032
- Figure 33: Europe Vat Photopolymerization 3D Printing Technology Market Revenue Share (%), by Country 2024 & 2032
- Figure 34: Europe Vat Photopolymerization 3D Printing Technology Market Volume Share (%), by Country 2024 & 2032
- Figure 35: Asia Pacific Vat Photopolymerization 3D Printing Technology Market Revenue (Million), by Component 2024 & 2032
- Figure 36: Asia Pacific Vat Photopolymerization 3D Printing Technology Market Volume (Billion), by Component 2024 & 2032
- Figure 37: Asia Pacific Vat Photopolymerization 3D Printing Technology Market Revenue Share (%), by Component 2024 & 2032
- Figure 38: Asia Pacific Vat Photopolymerization 3D Printing Technology Market Volume Share (%), by Component 2024 & 2032
- Figure 39: Asia Pacific Vat Photopolymerization 3D Printing Technology Market Revenue (Million), by Technology 2024 & 2032
- Figure 40: Asia Pacific Vat Photopolymerization 3D Printing Technology Market Volume (Billion), by Technology 2024 & 2032
- Figure 41: Asia Pacific Vat Photopolymerization 3D Printing Technology Market Revenue Share (%), by Technology 2024 & 2032
- Figure 42: Asia Pacific Vat Photopolymerization 3D Printing Technology Market Volume Share (%), by Technology 2024 & 2032
- Figure 43: Asia Pacific Vat Photopolymerization 3D Printing Technology Market Revenue (Million), by Application 2024 & 2032
- Figure 44: Asia Pacific Vat Photopolymerization 3D Printing Technology Market Volume (Billion), by Application 2024 & 2032
- Figure 45: Asia Pacific Vat Photopolymerization 3D Printing Technology Market Revenue Share (%), by Application 2024 & 2032
- Figure 46: Asia Pacific Vat Photopolymerization 3D Printing Technology Market Volume Share (%), by Application 2024 & 2032
- Figure 47: Asia Pacific Vat Photopolymerization 3D Printing Technology Market Revenue (Million), by Country 2024 & 2032
- Figure 48: Asia Pacific Vat Photopolymerization 3D Printing Technology Market Volume (Billion), by Country 2024 & 2032
- Figure 49: Asia Pacific Vat Photopolymerization 3D Printing Technology Market Revenue Share (%), by Country 2024 & 2032
- Figure 50: Asia Pacific Vat Photopolymerization 3D Printing Technology Market Volume Share (%), by Country 2024 & 2032
- Figure 51: Middle East and Africa Vat Photopolymerization 3D Printing Technology Market Revenue (Million), by Component 2024 & 2032
- Figure 52: Middle East and Africa Vat Photopolymerization 3D Printing Technology Market Volume (Billion), by Component 2024 & 2032
- Figure 53: Middle East and Africa Vat Photopolymerization 3D Printing Technology Market Revenue Share (%), by Component 2024 & 2032
- Figure 54: Middle East and Africa Vat Photopolymerization 3D Printing Technology Market Volume Share (%), by Component 2024 & 2032
- Figure 55: Middle East and Africa Vat Photopolymerization 3D Printing Technology Market Revenue (Million), by Technology 2024 & 2032
- Figure 56: Middle East and Africa Vat Photopolymerization 3D Printing Technology Market Volume (Billion), by Technology 2024 & 2032
- Figure 57: Middle East and Africa Vat Photopolymerization 3D Printing Technology Market Revenue Share (%), by Technology 2024 & 2032
- Figure 58: Middle East and Africa Vat Photopolymerization 3D Printing Technology Market Volume Share (%), by Technology 2024 & 2032
- Figure 59: Middle East and Africa Vat Photopolymerization 3D Printing Technology Market Revenue (Million), by Application 2024 & 2032
- Figure 60: Middle East and Africa Vat Photopolymerization 3D Printing Technology Market Volume (Billion), by Application 2024 & 2032
- Figure 61: Middle East and Africa Vat Photopolymerization 3D Printing Technology Market Revenue Share (%), by Application 2024 & 2032
- Figure 62: Middle East and Africa Vat Photopolymerization 3D Printing Technology Market Volume Share (%), by Application 2024 & 2032
- Figure 63: Middle East and Africa Vat Photopolymerization 3D Printing Technology Market Revenue (Million), by Country 2024 & 2032
- Figure 64: Middle East and Africa Vat Photopolymerization 3D Printing Technology Market Volume (Billion), by Country 2024 & 2032
- Figure 65: Middle East and Africa Vat Photopolymerization 3D Printing Technology Market Revenue Share (%), by Country 2024 & 2032
- Figure 66: Middle East and Africa Vat Photopolymerization 3D Printing Technology Market Volume Share (%), by Country 2024 & 2032
- Figure 67: South America Vat Photopolymerization 3D Printing Technology Market Revenue (Million), by Component 2024 & 2032
- Figure 68: South America Vat Photopolymerization 3D Printing Technology Market Volume (Billion), by Component 2024 & 2032
- Figure 69: South America Vat Photopolymerization 3D Printing Technology Market Revenue Share (%), by Component 2024 & 2032
- Figure 70: South America Vat Photopolymerization 3D Printing Technology Market Volume Share (%), by Component 2024 & 2032
- Figure 71: South America Vat Photopolymerization 3D Printing Technology Market Revenue (Million), by Technology 2024 & 2032
- Figure 72: South America Vat Photopolymerization 3D Printing Technology Market Volume (Billion), by Technology 2024 & 2032
- Figure 73: South America Vat Photopolymerization 3D Printing Technology Market Revenue Share (%), by Technology 2024 & 2032
- Figure 74: South America Vat Photopolymerization 3D Printing Technology Market Volume Share (%), by Technology 2024 & 2032
- Figure 75: South America Vat Photopolymerization 3D Printing Technology Market Revenue (Million), by Application 2024 & 2032
- Figure 76: South America Vat Photopolymerization 3D Printing Technology Market Volume (Billion), by Application 2024 & 2032
- Figure 77: South America Vat Photopolymerization 3D Printing Technology Market Revenue Share (%), by Application 2024 & 2032
- Figure 78: South America Vat Photopolymerization 3D Printing Technology Market Volume Share (%), by Application 2024 & 2032
- Figure 79: South America Vat Photopolymerization 3D Printing Technology Market Revenue (Million), by Country 2024 & 2032
- Figure 80: South America Vat Photopolymerization 3D Printing Technology Market Volume (Billion), by Country 2024 & 2032
- Figure 81: South America Vat Photopolymerization 3D Printing Technology Market Revenue Share (%), by Country 2024 & 2032
- Figure 82: South America Vat Photopolymerization 3D Printing Technology Market Volume Share (%), by Country 2024 & 2032
List of Tables
- Table 1: Global Vat Photopolymerization 3D Printing Technology Market Revenue Million Forecast, by Region 2019 & 2032
- Table 2: Global Vat Photopolymerization 3D Printing Technology Market Volume Billion Forecast, by Region 2019 & 2032
- Table 3: Global Vat Photopolymerization 3D Printing Technology Market Revenue Million Forecast, by Component 2019 & 2032
- Table 4: Global Vat Photopolymerization 3D Printing Technology Market Volume Billion Forecast, by Component 2019 & 2032
- Table 5: Global Vat Photopolymerization 3D Printing Technology Market Revenue Million Forecast, by Technology 2019 & 2032
- Table 6: Global Vat Photopolymerization 3D Printing Technology Market Volume Billion Forecast, by Technology 2019 & 2032
- Table 7: Global Vat Photopolymerization 3D Printing Technology Market Revenue Million Forecast, by Application 2019 & 2032
- Table 8: Global Vat Photopolymerization 3D Printing Technology Market Volume Billion Forecast, by Application 2019 & 2032
- Table 9: Global Vat Photopolymerization 3D Printing Technology Market Revenue Million Forecast, by Region 2019 & 2032
- Table 10: Global Vat Photopolymerization 3D Printing Technology Market Volume Billion Forecast, by Region 2019 & 2032
- Table 11: Global Vat Photopolymerization 3D Printing Technology Market Revenue Million Forecast, by Component 2019 & 2032
- Table 12: Global Vat Photopolymerization 3D Printing Technology Market Volume Billion Forecast, by Component 2019 & 2032
- Table 13: Global Vat Photopolymerization 3D Printing Technology Market Revenue Million Forecast, by Technology 2019 & 2032
- Table 14: Global Vat Photopolymerization 3D Printing Technology Market Volume Billion Forecast, by Technology 2019 & 2032
- Table 15: Global Vat Photopolymerization 3D Printing Technology Market Revenue Million Forecast, by Application 2019 & 2032
- Table 16: Global Vat Photopolymerization 3D Printing Technology Market Volume Billion Forecast, by Application 2019 & 2032
- Table 17: Global Vat Photopolymerization 3D Printing Technology Market Revenue Million Forecast, by Country 2019 & 2032
- Table 18: Global Vat Photopolymerization 3D Printing Technology Market Volume Billion Forecast, by Country 2019 & 2032
- Table 19: United States Vat Photopolymerization 3D Printing Technology Market Revenue (Million) Forecast, by Application 2019 & 2032
- Table 20: United States Vat Photopolymerization 3D Printing Technology Market Volume (Billion) Forecast, by Application 2019 & 2032
- Table 21: Canada Vat Photopolymerization 3D Printing Technology Market Revenue (Million) Forecast, by Application 2019 & 2032
- Table 22: Canada Vat Photopolymerization 3D Printing Technology Market Volume (Billion) Forecast, by Application 2019 & 2032
- Table 23: Mexico Vat Photopolymerization 3D Printing Technology Market Revenue (Million) Forecast, by Application 2019 & 2032
- Table 24: Mexico Vat Photopolymerization 3D Printing Technology Market Volume (Billion) Forecast, by Application 2019 & 2032
- Table 25: Global Vat Photopolymerization 3D Printing Technology Market Revenue Million Forecast, by Component 2019 & 2032
- Table 26: Global Vat Photopolymerization 3D Printing Technology Market Volume Billion Forecast, by Component 2019 & 2032
- Table 27: Global Vat Photopolymerization 3D Printing Technology Market Revenue Million Forecast, by Technology 2019 & 2032
- Table 28: Global Vat Photopolymerization 3D Printing Technology Market Volume Billion Forecast, by Technology 2019 & 2032
- Table 29: Global Vat Photopolymerization 3D Printing Technology Market Revenue Million Forecast, by Application 2019 & 2032
- Table 30: Global Vat Photopolymerization 3D Printing Technology Market Volume Billion Forecast, by Application 2019 & 2032
- Table 31: Global Vat Photopolymerization 3D Printing Technology Market Revenue Million Forecast, by Country 2019 & 2032
- Table 32: Global Vat Photopolymerization 3D Printing Technology Market Volume Billion Forecast, by Country 2019 & 2032
- Table 33: Germany Vat Photopolymerization 3D Printing Technology Market Revenue (Million) Forecast, by Application 2019 & 2032
- Table 34: Germany Vat Photopolymerization 3D Printing Technology Market Volume (Billion) Forecast, by Application 2019 & 2032
- Table 35: United Kingdom Vat Photopolymerization 3D Printing Technology Market Revenue (Million) Forecast, by Application 2019 & 2032
- Table 36: United Kingdom Vat Photopolymerization 3D Printing Technology Market Volume (Billion) Forecast, by Application 2019 & 2032
- Table 37: France Vat Photopolymerization 3D Printing Technology Market Revenue (Million) Forecast, by Application 2019 & 2032
- Table 38: France Vat Photopolymerization 3D Printing Technology Market Volume (Billion) Forecast, by Application 2019 & 2032
- Table 39: Italy Vat Photopolymerization 3D Printing Technology Market Revenue (Million) Forecast, by Application 2019 & 2032
- Table 40: Italy Vat Photopolymerization 3D Printing Technology Market Volume (Billion) Forecast, by Application 2019 & 2032
- Table 41: Spain Vat Photopolymerization 3D Printing Technology Market Revenue (Million) Forecast, by Application 2019 & 2032
- Table 42: Spain Vat Photopolymerization 3D Printing Technology Market Volume (Billion) Forecast, by Application 2019 & 2032
- Table 43: Rest of Europe Vat Photopolymerization 3D Printing Technology Market Revenue (Million) Forecast, by Application 2019 & 2032
- Table 44: Rest of Europe Vat Photopolymerization 3D Printing Technology Market Volume (Billion) Forecast, by Application 2019 & 2032
- Table 45: Global Vat Photopolymerization 3D Printing Technology Market Revenue Million Forecast, by Component 2019 & 2032
- Table 46: Global Vat Photopolymerization 3D Printing Technology Market Volume Billion Forecast, by Component 2019 & 2032
- Table 47: Global Vat Photopolymerization 3D Printing Technology Market Revenue Million Forecast, by Technology 2019 & 2032
- Table 48: Global Vat Photopolymerization 3D Printing Technology Market Volume Billion Forecast, by Technology 2019 & 2032
- Table 49: Global Vat Photopolymerization 3D Printing Technology Market Revenue Million Forecast, by Application 2019 & 2032
- Table 50: Global Vat Photopolymerization 3D Printing Technology Market Volume Billion Forecast, by Application 2019 & 2032
- Table 51: Global Vat Photopolymerization 3D Printing Technology Market Revenue Million Forecast, by Country 2019 & 2032
- Table 52: Global Vat Photopolymerization 3D Printing Technology Market Volume Billion Forecast, by Country 2019 & 2032
- Table 53: China Vat Photopolymerization 3D Printing Technology Market Revenue (Million) Forecast, by Application 2019 & 2032
- Table 54: China Vat Photopolymerization 3D Printing Technology Market Volume (Billion) Forecast, by Application 2019 & 2032
- Table 55: Japan Vat Photopolymerization 3D Printing Technology Market Revenue (Million) Forecast, by Application 2019 & 2032
- Table 56: Japan Vat Photopolymerization 3D Printing Technology Market Volume (Billion) Forecast, by Application 2019 & 2032
- Table 57: India Vat Photopolymerization 3D Printing Technology Market Revenue (Million) Forecast, by Application 2019 & 2032
- Table 58: India Vat Photopolymerization 3D Printing Technology Market Volume (Billion) Forecast, by Application 2019 & 2032
- Table 59: Australia Vat Photopolymerization 3D Printing Technology Market Revenue (Million) Forecast, by Application 2019 & 2032
- Table 60: Australia Vat Photopolymerization 3D Printing Technology Market Volume (Billion) Forecast, by Application 2019 & 2032
- Table 61: South Korea Vat Photopolymerization 3D Printing Technology Market Revenue (Million) Forecast, by Application 2019 & 2032
- Table 62: South Korea Vat Photopolymerization 3D Printing Technology Market Volume (Billion) Forecast, by Application 2019 & 2032
- Table 63: Rest of Asia Pacific Vat Photopolymerization 3D Printing Technology Market Revenue (Million) Forecast, by Application 2019 & 2032
- Table 64: Rest of Asia Pacific Vat Photopolymerization 3D Printing Technology Market Volume (Billion) Forecast, by Application 2019 & 2032
- Table 65: Global Vat Photopolymerization 3D Printing Technology Market Revenue Million Forecast, by Component 2019 & 2032
- Table 66: Global Vat Photopolymerization 3D Printing Technology Market Volume Billion Forecast, by Component 2019 & 2032
- Table 67: Global Vat Photopolymerization 3D Printing Technology Market Revenue Million Forecast, by Technology 2019 & 2032
- Table 68: Global Vat Photopolymerization 3D Printing Technology Market Volume Billion Forecast, by Technology 2019 & 2032
- Table 69: Global Vat Photopolymerization 3D Printing Technology Market Revenue Million Forecast, by Application 2019 & 2032
- Table 70: Global Vat Photopolymerization 3D Printing Technology Market Volume Billion Forecast, by Application 2019 & 2032
- Table 71: Global Vat Photopolymerization 3D Printing Technology Market Revenue Million Forecast, by Country 2019 & 2032
- Table 72: Global Vat Photopolymerization 3D Printing Technology Market Volume Billion Forecast, by Country 2019 & 2032
- Table 73: GCC Vat Photopolymerization 3D Printing Technology Market Revenue (Million) Forecast, by Application 2019 & 2032
- Table 74: GCC Vat Photopolymerization 3D Printing Technology Market Volume (Billion) Forecast, by Application 2019 & 2032
- Table 75: South Africa Vat Photopolymerization 3D Printing Technology Market Revenue (Million) Forecast, by Application 2019 & 2032
- Table 76: South Africa Vat Photopolymerization 3D Printing Technology Market Volume (Billion) Forecast, by Application 2019 & 2032
- Table 77: Rest of Middle East and Africa Vat Photopolymerization 3D Printing Technology Market Revenue (Million) Forecast, by Application 2019 & 2032
- Table 78: Rest of Middle East and Africa Vat Photopolymerization 3D Printing Technology Market Volume (Billion) Forecast, by Application 2019 & 2032
- Table 79: Global Vat Photopolymerization 3D Printing Technology Market Revenue Million Forecast, by Component 2019 & 2032
- Table 80: Global Vat Photopolymerization 3D Printing Technology Market Volume Billion Forecast, by Component 2019 & 2032
- Table 81: Global Vat Photopolymerization 3D Printing Technology Market Revenue Million Forecast, by Technology 2019 & 2032
- Table 82: Global Vat Photopolymerization 3D Printing Technology Market Volume Billion Forecast, by Technology 2019 & 2032
- Table 83: Global Vat Photopolymerization 3D Printing Technology Market Revenue Million Forecast, by Application 2019 & 2032
- Table 84: Global Vat Photopolymerization 3D Printing Technology Market Volume Billion Forecast, by Application 2019 & 2032
- Table 85: Global Vat Photopolymerization 3D Printing Technology Market Revenue Million Forecast, by Country 2019 & 2032
- Table 86: Global Vat Photopolymerization 3D Printing Technology Market Volume Billion Forecast, by Country 2019 & 2032
- Table 87: Brazil Vat Photopolymerization 3D Printing Technology Market Revenue (Million) Forecast, by Application 2019 & 2032
- Table 88: Brazil Vat Photopolymerization 3D Printing Technology Market Volume (Billion) Forecast, by Application 2019 & 2032
- Table 89: Argentina Vat Photopolymerization 3D Printing Technology Market Revenue (Million) Forecast, by Application 2019 & 2032
- Table 90: Argentina Vat Photopolymerization 3D Printing Technology Market Volume (Billion) Forecast, by Application 2019 & 2032
- Table 91: Rest of South America Vat Photopolymerization 3D Printing Technology Market Revenue (Million) Forecast, by Application 2019 & 2032
- Table 92: Rest of South America Vat Photopolymerization 3D Printing Technology Market Volume (Billion) Forecast, by Application 2019 & 2032
Frequently Asked Questions
1. What is the projected Compound Annual Growth Rate (CAGR) of the Vat Photopolymerization 3D Printing Technology Market?
The projected CAGR is approximately 26.02%.
2. Which companies are prominent players in the Vat Photopolymerization 3D Printing Technology Market?
Key companies in the market include Formlabs, 3D Systems Inc, Peopoly, Asiga, Tiertime, Tasly Holding Group, UnionTech, Zortrax, Rayshape*List Not Exhaustive.
3. What are the main segments of the Vat Photopolymerization 3D Printing Technology Market?
The market segments include Component, Technology, Application.
4. Can you provide details about the market size?
The market size is estimated to be USD 2.17 Million as of 2022.
5. What are some drivers contributing to market growth?
Rising Demand for Minimally Invasive Procedures; Growing Technological Advancements.
6. What are the notable trends driving market growth?
Orthopedics Segment Expected to Hold a Significant Market Share Over the Forecast Period.
7. Are there any restraints impacting market growth?
Rising Demand for Minimally Invasive Procedures; Growing Technological Advancements.
8. Can you provide examples of recent developments in the market?
March 2024: Sprybuild, an Israeli start-up, reported the launch of its SLA 3D printer featuring a patented continuous build process on a conveyor belt and rigid optical interface. This 3D printer can be used in the production of dental models, orthopedic insoles, eyeglass frames, hearing aids, and prosthetic components.February 2024: SHINING 3D, a 3D digitization and printing solutions provider, reported the launch of AccuFab-CEL, a dental 3D printer, at the largest dental laboratory event in the United States, LabDay 2024.
9. What pricing options are available for accessing the report?
Pricing options include single-user, multi-user, and enterprise licenses priced at USD 4750, USD 5250, and USD 8750 respectively.
10. Is the market size provided in terms of value or volume?
The market size is provided in terms of value, measured in Million and volume, measured in Billion.
11. Are there any specific market keywords associated with the report?
Yes, the market keyword associated with the report is "Vat Photopolymerization 3D Printing Technology Market," which aids in identifying and referencing the specific market segment covered.
12. How do I determine which pricing option suits my needs best?
The pricing options vary based on user requirements and access needs. Individual users may opt for single-user licenses, while businesses requiring broader access may choose multi-user or enterprise licenses for cost-effective access to the report.
13. Are there any additional resources or data provided in the Vat Photopolymerization 3D Printing Technology Market report?
While the report offers comprehensive insights, it's advisable to review the specific contents or supplementary materials provided to ascertain if additional resources or data are available.
14. How can I stay updated on further developments or reports in the Vat Photopolymerization 3D Printing Technology Market?
To stay informed about further developments, trends, and reports in the Vat Photopolymerization 3D Printing Technology Market, consider subscribing to industry newsletters, following relevant companies and organizations, or regularly checking reputable industry news sources and publications.
Methodology
Step 1 - Identification of Relevant Samples Size from Population Database


Step 2 - Approaches for Defining Global Market Size (Value, Volume* & Price*)

Note*: In applicable scenarios
Step 3 - Data Sources
Primary Research
- Web Analytics
- Survey Reports
- Research Institute
- Latest Research Reports
- Opinion Leaders
Secondary Research
- Annual Reports
- White Paper
- Latest Press Release
- Industry Association
- Paid Database
- Investor Presentations

Step 4 - Data Triangulation
Involves using different sources of information in order to increase the validity of a study
These sources are likely to be stakeholders in a program - participants, other researchers, program staff, other community members, and so on.
Then we put all data in single framework & apply various statistical tools to find out the dynamic on the market.
During the analysis stage, feedback from the stakeholder groups would be compared to determine areas of agreement as well as areas of divergence
