

Key Insights
The CRISPR and CAS Genes market is projected to experience significant expansion, reaching an estimated market size of $5.6 billion by 2025 and growing at a Compound Annual Growth Rate (CAGR) of 17.14% through 2033. This growth is driven by rapid advancements in genome engineering, enabling precise gene editing. The increasing demand for genetic material manipulation tools across life sciences, coupled with the rising prevalence of genetic diseases, novel therapeutic development, and agricultural biotechnology applications, fuels this market. Substantial R&D investments, supportive government initiatives, and the trend towards personalized medicine further accelerate growth.
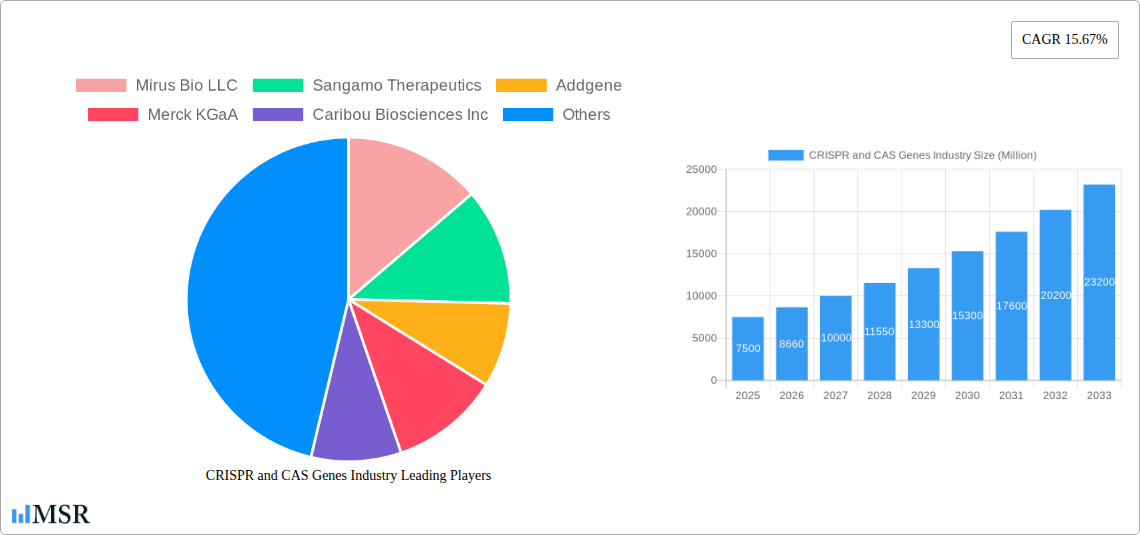
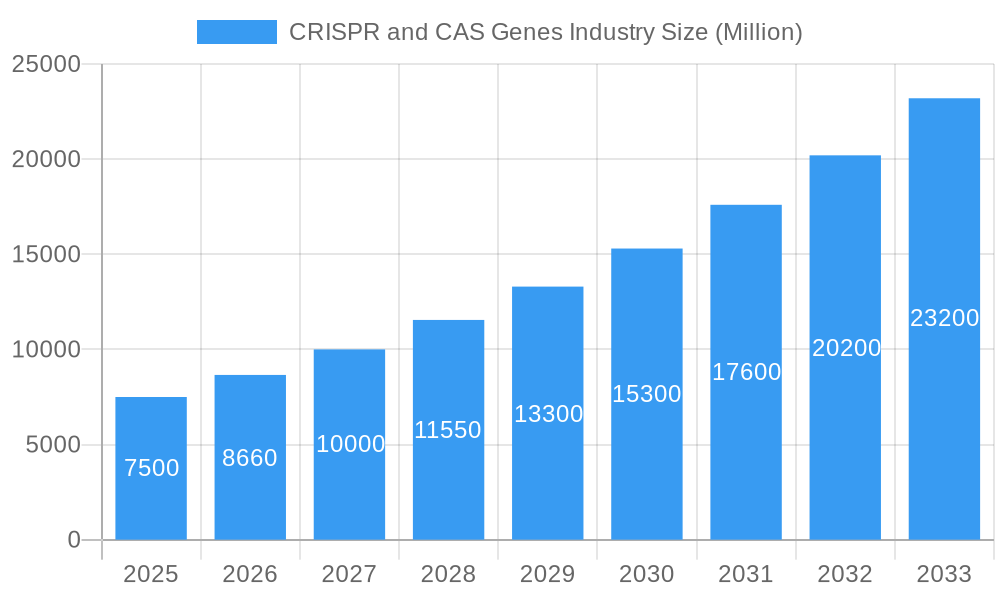
CRISPR and CAS Genes Industry Market Size (In Billion)
Key market segments include Vector-based Cas and DNA-free Cas technologies. Applications span genome engineering, disease modeling, functional genomics, and emerging "other applications." Leading industry players like Thermo Fisher Scientific, Editas Medicine, CRISPR Therapeutics, and Mirus Bio LLC are driving innovation. Potential restraints such as ethical considerations, regulatory challenges, and high platform costs are being addressed through technological refinements and increased accessibility.
CRISPR and CAS Genes Industry Company Market Share
CRISPR and CAS Genes Market: In-depth Analysis and Future Outlook (2019-2033)
This comprehensive market intelligence report offers detailed insights into the CRISPR and CAS Genes market, focusing on the period from 2019 to 2033, with a base and estimated year of 2025. It provides analysis of market concentration, key drivers, segmentation, product innovations, and strategic player outlooks. This report is essential for biotechnology investors, pharmaceutical companies, research institutions, and gene therapy developers seeking to understand the transformative impact of CRISPR technology on genome engineering, disease modeling, functional genomics, and novel therapeutic development.
CRISPR and CAS Genes Industry Market Concentration & Dynamics
The CRISPR and CAS Genes Industry exhibits a moderate to high market concentration, driven by significant R&D investments and strategic collaborations. The innovation ecosystem is vibrant, with a constant influx of patented technologies and novel applications emerging from academic and commercial research. Regulatory frameworks are evolving to keep pace with the rapid advancements, influencing the development and commercialization pathways for CRISPR-based therapies and diagnostics. While direct substitutes for the precision of CRISPR are limited, traditional gene therapy approaches and other gene editing tools represent indirect competition. End-user trends are heavily influenced by the promise of personalized medicine and the potential to cure previously intractable genetic diseases. Merger and acquisition (M&A) activities are on the rise as larger pharmaceutical entities seek to acquire cutting-edge CRISPR platforms and intellectual property. Key M&A deals in the historical period have demonstrated an aggregate value exceeding $5,000 Million. Companies are actively consolidating their market positions, leading to an estimated market share distribution where the top 5 players command over 60% of the total market by the base year of 2025.
CRISPR and CAS Genes Industry Industry Insights & Trends
The CRISPR and CAS Genes Industry is experiencing exponential growth, projected to reach an impressive market size of over $20,000 Million by 2033, exhibiting a robust Compound Annual Growth Rate (CAGR) of approximately 25% during the forecast period of 2025–2033. This surge is fueled by groundbreaking technological advancements and an increasing understanding of genetic underpinnings of numerous diseases. The CRISPR/Cas9 system and its variations, such as CRISPR-Cas12, CRISPR-Cas13, and prime editing, are revolutionizing genome editing capabilities, enabling precise gene knockouts, insertions, and modifications. The development of novel delivery systems, including vector-based Cas and increasingly efficient DNA-free Cas methods, is significantly improving therapeutic efficacy and reducing off-target effects. Functional genomics research is leveraging CRISPR for high-throughput screening and target validation, accelerating drug discovery pipelines. The therapeutic potential for treating genetic disorders like sickle cell disease, cystic fibrosis, Huntington's disease, and various cancers is a major growth driver, attracting substantial investment from venture capital and pharmaceutical giants. Furthermore, the application of CRISPR in developing advanced disease models for preclinical research is creating new avenues for understanding disease pathogenesis and testing novel therapeutic strategies. The rising prevalence of genetic diseases and the growing demand for personalized medicine solutions further bolster the market's upward trajectory.
Key Markets & Segments Leading CRISPR and CAS Genes Industry
The CRISPR and CAS Genes Industry is experiencing robust growth across all its key segments and regions, with North America emerging as a dominant market due to its strong R&D infrastructure, significant government funding, and a high concentration of leading biotechnology firms. The United States, in particular, leads in both innovation and adoption.
Product Segment Dominance:
- Vector-based Cas: This segment currently holds a significant market share due to its established efficacy and widespread use in research and early-stage clinical applications. The ongoing development of more targeted and safer viral and non-viral vectors continues to drive its prominence.
- DNA-free Cas: While still a developing segment, DNA-free CRISPR technologies (e.g., using RNP complexes) are rapidly gaining traction due to their reduced risk of off-target integration and immunogenicity, making them highly attractive for therapeutic applications. Their market share is projected to grow substantially over the forecast period.
Application Segment Dominance:
- Genome Engineering: This is the largest and most fundamental application, underpinning advancements in nearly all other areas. Its dominance is driven by its versatility in basic research, drug discovery, and the development of genetically modified organisms.
- Disease Models: The creation of accurate and predictive disease models using CRISPR is crucial for understanding disease mechanisms and testing therapeutic interventions. The demand for sophisticated disease models across oncology, neurology, and rare diseases is a major growth catalyst.
- Functional Genomics: CRISPR-based screens are revolutionizing functional genomics by enabling the systematic investigation of gene function on a large scale. This application is critical for identifying novel drug targets and understanding complex biological pathways.
- Other Applications: This encompasses a growing range of applications, including agricultural biotechnology, diagnostics, and the development of gene drives, showcasing the expansive reach of CRISPR technology.
Economic growth in developed regions, coupled with increasing healthcare expenditure, provides a conducive environment for the adoption of advanced genetic technologies. Infrastructure development in emerging markets, alongside supportive government initiatives aimed at fostering biotechnology innovation, is also contributing to the expansion of the CRISPR market globally.
CRISPR and CAS Genes Industry Product Developments
The CRISPR and CAS Genes Industry is characterized by continuous product innovation. Advancements in CRISPR-Cas9 systems are leading to increased specificity and reduced off-target effects, while novel variants like prime editing and base editing offer unprecedented precision for genetic modifications. The development of efficient delivery systems, including sophisticated viral vectors and novel non-viral methods like lipid nanoparticles, is crucial for translating these technologies into viable therapeutics. Furthermore, advancements in DNA-free CRISPR delivery, utilizing ribonucleoprotein complexes, are enhancing safety profiles. These innovations are critical for applications ranging from genome engineering in research settings to the development of life-saving gene therapies for a wide array of genetic diseases.
Challenges in the CRISPR and CAS Genes Industry Market
Despite its immense potential, the CRISPR and CAS Genes Industry faces several significant challenges. Regulatory hurdles surrounding the approval of gene therapies and the ethical considerations of germline editing remain complex and evolving. The high cost of developing and manufacturing CRISPR-based therapeutics can limit accessibility, particularly in underserved markets. Supply chain issues for specialized reagents and delivery components, along with ensuring the consistent quality and scalability of CRISPR products, pose ongoing logistical challenges. Furthermore, competitive pressures from established gene therapy platforms and the need for continuous technological refinement to improve efficacy and safety are constant demands.
Forces Driving CRISPR and CAS Genes Industry Growth
The growth of the CRISPR and CAS Genes Industry is primarily driven by several powerful forces. Technological advancements in gene editing precision and efficiency, exemplified by the development of prime editing and base editing, are expanding the therapeutic window. Increased understanding of genetic diseases and a growing pipeline of CRISPR-based drug candidates for oncology, rare diseases, and infectious diseases are attracting substantial investment. Supportive government initiatives and funding for biotechnology research and development globally, coupled with an expanding market for diagnostics and agricultural applications, further fuel market expansion. The increasing global burden of genetic diseases and the growing demand for personalized medicine solutions are also critical growth catalysts.
Challenges in the CRISPR and CAS Genes Industry Market
Long-term growth catalysts for the CRISPR and CAS Genes Industry are rooted in persistent innovation and strategic market expansion. The continuous refinement of CRISPR delivery systems to improve targeting and reduce immunogenicity will unlock new therapeutic avenues. Strategic partnerships between biotechnology companies and pharmaceutical giants are accelerating the clinical translation of CRISPR therapies. Furthermore, the exploration of novel applications beyond human health, such as in agriculture and industrial biotechnology, presents significant untapped market potential. The development of CRISPR-based diagnostics for early disease detection and monitoring will also contribute to sustained market growth.
Emerging Opportunities in CRISPR and CAS Genes Industry
Emerging opportunities in the CRISPR and CAS Genes Industry are vast and transformative. The development of in vivo CRISPR therapies that can directly edit genes within the patient's body, eliminating the need for ex vivo cell manipulation, represents a significant frontier. The integration of CRISPR with artificial intelligence (AI) for gene target identification and drug design promises to accelerate discovery pipelines. Furthermore, the expansion of CRISPR applications in agriculture for crop improvement, pest resistance, and enhanced nutritional value presents a substantial market. The growing demand for personalized cancer vaccines and the potential for CRISPR-based treatments for neurodegenerative disorders are also key emerging areas.
Leading Players in the CRISPR and CAS Genes Industry Sector
- Mirus Bio LLC
- Sangamo Therapeutics
- Addgene
- Merck KGaA
- Caribou Biosciences Inc
- PerkinElmer Inc (Horizon Discovery Ltd )
- Takara Bio Inc
- Intellia Therapeutics
- Inscripta Inc
- OriGene Technologies Inc
- Thermo Fisher Scientific
- Editas Medicine
- CRISPR THERAPEUTICS
Key Milestones in CRISPR and CAS Genes Industry Industry
- December 2022: A researcher from the University of California sponsored a clinical trial under the title "Transplantation of Clustered Regularly Interspaced Short Palindromic Repeats Modified Hematopoietic Progenitor Stem Cells (CRISPRSCD001) in Patients With Severe Sickle Cell Disease" to evaluate the hematopoietic stem cell transplantation (HSCT) using CRISPR/Cas9 edited red blood cells (known as CRISPRSCD001 Drug Product). This milestone signifies a critical step forward in the clinical application of CRISPR for treating genetic blood disorders.
- November 2022: Massachusetts Institute of Technology researchers designed a new CRISPR-based tool that inserts large DNA sequences at desired sites in cells, known as PASTE. This technique holds the potential for treating a variety of diseases caused by faulty genes and marks a significant advancement in the precision and capability of genome editing tools.
Strategic Outlook for CRISPR and CAS Genes Industry Market
The strategic outlook for the CRISPR and CAS Genes Industry is exceptionally bright, characterized by continuous innovation and expanding therapeutic applications. Growth will be accelerated by the successful translation of CRISPR therapies into approved treatments for a growing list of genetic diseases, particularly in areas like oncology and rare genetic disorders. Strategic collaborations between research institutions and commercial entities will continue to drive product development and market penetration. Investment in improving CRISPR delivery methods and exploring in vivo gene editing will unlock new treatment paradigms. Furthermore, the expanding use of CRISPR in diagnostics and agricultural biotechnology presents substantial long-term growth opportunities, solidifying its position as a cornerstone technology in the future of biology and medicine.
CRISPR and CAS Genes Industry Segmentation
-
1. Product
- 1.1. Vector-based Cas
- 1.2. DNA-free Cas
-
2. Application
- 2.1. Genome Engineering
- 2.2. Disease Models
- 2.3. Functional Genomics
- 2.4. Other Applications
CRISPR and CAS Genes Industry Segmentation By Geography
-
1. North America
- 1.1. United States
- 1.2. Canada
- 1.3. Mexico
-
2. Europe
- 2.1. Germany
- 2.2. United Kingdom
- 2.3. France
- 2.4. Italy
- 2.5. Spain
- 2.6. Rest of Europe
-
3. Asia Pacific
- 3.1. China
- 3.2. Japan
- 3.3. India
- 3.4. Australia
- 3.5. South Korea
- 3.6. Rest of Asia Pacific
-
4. Middle East and Africa
- 4.1. GCC
- 4.2. South Africa
- 4.3. Rest of Middle East and Africa
-
5. South America
- 5.1. Brazil
- 5.2. Argentina
- 5.3. Rest of South America
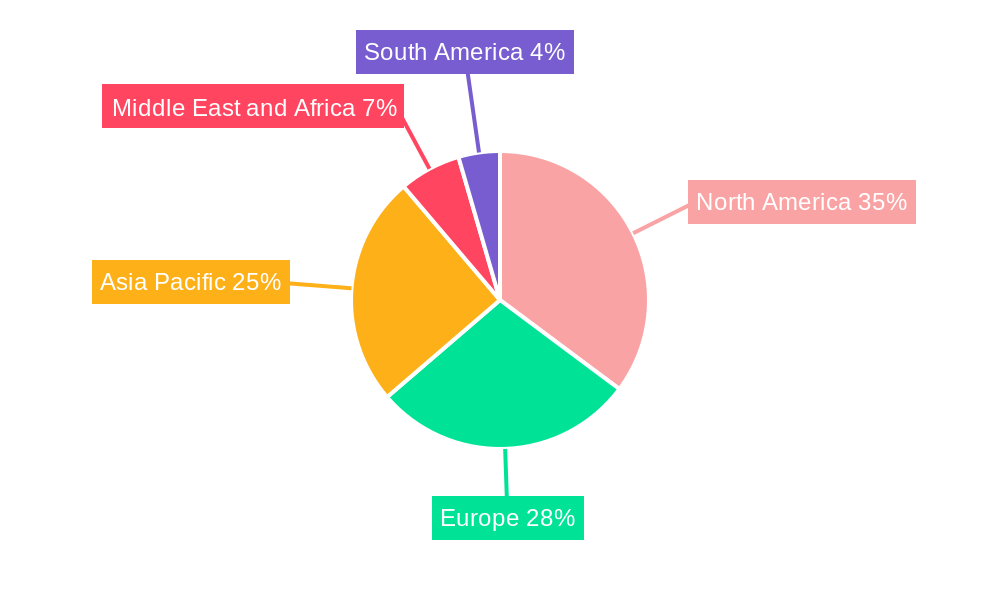
CRISPR and CAS Genes Industry Regional Market Share
Geographic Coverage of CRISPR and CAS Genes Industry
CRISPR and CAS Genes Industry REPORT HIGHLIGHTS
| Aspects | Details |
|---|---|
| Study Period | 2020-2034 |
| Base Year | 2025 |
| Estimated Year | 2026 |
| Forecast Period | 2026-2034 |
| Historical Period | 2020-2025 |
| Growth Rate | CAGR of 17.14% from 2020-2034 |
| Segmentation |
|
Table of Contents
- 1. Introduction
- 1.1. Research Scope
- 1.2. Market Segmentation
- 1.3. Research Objective
- 1.4. Definitions and Assumptions
- 2. Executive Summary
- 2.1. Market Snapshot
- 3. Market Dynamics
- 3.1. Market Drivers
- 3.2. Market Restrains
- 3.3. Market Trends
- 3.4. Market Opportunities
- 4. Market Factor Analysis
- 4.1. Porters Five Forces
- 4.1.1. Bargaining Power of Suppliers
- 4.1.2. Bargaining Power of Buyers
- 4.1.3. Threat of New Entrants
- 4.1.4. Threat of Substitutes
- 4.1.5. Competitive Rivalry
- 4.2. PESTEL analysis
- 4.3. BCG Analysis
- 4.3.1. Stars (High Growth, High Market Share)
- 4.3.2. Cash Cows (Low Growth, High Market Share)
- 4.3.3. Question Mark (High Growth, Low Market Share)
- 4.3.4. Dogs (Low Growth, Low Market Share)
- 4.4. Ansoff Matrix Analysis
- 4.5. Supply Chain Analysis
- 4.6. Regulatory Landscape
- 4.7. Current Market Potential and Opportunity Assessment (TAM–SAM–SOM Framework)
- 4.8. MSR Analyst Note
- 4.1. Porters Five Forces
- 5. Market Analysis, Insights and Forecast 2021-2033
- 5.1. Market Analysis, Insights and Forecast - by Product
- 5.1.1. Vector-based Cas
- 5.1.2. DNA-free Cas
- 5.2. Market Analysis, Insights and Forecast - by Application
- 5.2.1. Genome Engineering
- 5.2.2. Disease Models
- 5.2.3. Functional Genomics
- 5.2.4. Other Applications
- 5.3. Market Analysis, Insights and Forecast - by Region
- 5.3.1. North America
- 5.3.2. Europe
- 5.3.3. Asia Pacific
- 5.3.4. Middle East and Africa
- 5.3.5. South America
- 5.1. Market Analysis, Insights and Forecast - by Product
- 6. Global CRISPR and CAS Genes Industry Analysis, Insights and Forecast, 2021-2033
- 6.1. Market Analysis, Insights and Forecast - by Product
- 6.1.1. Vector-based Cas
- 6.1.2. DNA-free Cas
- 6.2. Market Analysis, Insights and Forecast - by Application
- 6.2.1. Genome Engineering
- 6.2.2. Disease Models
- 6.2.3. Functional Genomics
- 6.2.4. Other Applications
- 6.1. Market Analysis, Insights and Forecast - by Product
- 7. North America CRISPR and CAS Genes Industry Analysis, Insights and Forecast, 2020-2032
- 7.1. Market Analysis, Insights and Forecast - by Product
- 7.1.1. Vector-based Cas
- 7.1.2. DNA-free Cas
- 7.2. Market Analysis, Insights and Forecast - by Application
- 7.2.1. Genome Engineering
- 7.2.2. Disease Models
- 7.2.3. Functional Genomics
- 7.2.4. Other Applications
- 7.1. Market Analysis, Insights and Forecast - by Product
- 8. Europe CRISPR and CAS Genes Industry Analysis, Insights and Forecast, 2020-2032
- 8.1. Market Analysis, Insights and Forecast - by Product
- 8.1.1. Vector-based Cas
- 8.1.2. DNA-free Cas
- 8.2. Market Analysis, Insights and Forecast - by Application
- 8.2.1. Genome Engineering
- 8.2.2. Disease Models
- 8.2.3. Functional Genomics
- 8.2.4. Other Applications
- 8.1. Market Analysis, Insights and Forecast - by Product
- 9. Asia Pacific CRISPR and CAS Genes Industry Analysis, Insights and Forecast, 2020-2032
- 9.1. Market Analysis, Insights and Forecast - by Product
- 9.1.1. Vector-based Cas
- 9.1.2. DNA-free Cas
- 9.2. Market Analysis, Insights and Forecast - by Application
- 9.2.1. Genome Engineering
- 9.2.2. Disease Models
- 9.2.3. Functional Genomics
- 9.2.4. Other Applications
- 9.1. Market Analysis, Insights and Forecast - by Product
- 10. Middle East and Africa CRISPR and CAS Genes Industry Analysis, Insights and Forecast, 2020-2032
- 10.1. Market Analysis, Insights and Forecast - by Product
- 10.1.1. Vector-based Cas
- 10.1.2. DNA-free Cas
- 10.2. Market Analysis, Insights and Forecast - by Application
- 10.2.1. Genome Engineering
- 10.2.2. Disease Models
- 10.2.3. Functional Genomics
- 10.2.4. Other Applications
- 10.1. Market Analysis, Insights and Forecast - by Product
- 11. South America CRISPR and CAS Genes Industry Analysis, Insights and Forecast, 2020-2032
- 11.1. Market Analysis, Insights and Forecast - by Product
- 11.1.1. Vector-based Cas
- 11.1.2. DNA-free Cas
- 11.2. Market Analysis, Insights and Forecast - by Application
- 11.2.1. Genome Engineering
- 11.2.2. Disease Models
- 11.2.3. Functional Genomics
- 11.2.4. Other Applications
- 11.1. Market Analysis, Insights and Forecast - by Product
- 12. Competitive Analysis
- 12.1. Company Profiles
- 12.1.1 Mirus Bio LLC
- 12.1.1.1. Company Overview
- 12.1.1.2. Products
- 12.1.1.3. Company Financials
- 12.1.1.4. SWOT Analysis
- 12.1.2 Sangamo Therapeutics
- 12.1.2.1. Company Overview
- 12.1.2.2. Products
- 12.1.2.3. Company Financials
- 12.1.2.4. SWOT Analysis
- 12.1.3 Addgene
- 12.1.3.1. Company Overview
- 12.1.3.2. Products
- 12.1.3.3. Company Financials
- 12.1.3.4. SWOT Analysis
- 12.1.4 Merck KGaA
- 12.1.4.1. Company Overview
- 12.1.4.2. Products
- 12.1.4.3. Company Financials
- 12.1.4.4. SWOT Analysis
- 12.1.5 Caribou Biosciences Inc
- 12.1.5.1. Company Overview
- 12.1.5.2. Products
- 12.1.5.3. Company Financials
- 12.1.5.4. SWOT Analysis
- 12.1.6 PerkinElmer Inc (Horizon Discovery Ltd )
- 12.1.6.1. Company Overview
- 12.1.6.2. Products
- 12.1.6.3. Company Financials
- 12.1.6.4. SWOT Analysis
- 12.1.7 Takara Bio Inc
- 12.1.7.1. Company Overview
- 12.1.7.2. Products
- 12.1.7.3. Company Financials
- 12.1.7.4. SWOT Analysis
- 12.1.8 Intellia Therpeutics
- 12.1.8.1. Company Overview
- 12.1.8.2. Products
- 12.1.8.3. Company Financials
- 12.1.8.4. SWOT Analysis
- 12.1.9 Inscripta Inc
- 12.1.9.1. Company Overview
- 12.1.9.2. Products
- 12.1.9.3. Company Financials
- 12.1.9.4. SWOT Analysis
- 12.1.10 OriGene Technologies Inc
- 12.1.10.1. Company Overview
- 12.1.10.2. Products
- 12.1.10.3. Company Financials
- 12.1.10.4. SWOT Analysis
- 12.1.11 Thermo Fisher Scientific
- 12.1.11.1. Company Overview
- 12.1.11.2. Products
- 12.1.11.3. Company Financials
- 12.1.11.4. SWOT Analysis
- 12.1.12 Editas Medicine
- 12.1.12.1. Company Overview
- 12.1.12.2. Products
- 12.1.12.3. Company Financials
- 12.1.12.4. SWOT Analysis
- 12.1.13 CRISPR THERAPEUTICS
- 12.1.13.1. Company Overview
- 12.1.13.2. Products
- 12.1.13.3. Company Financials
- 12.1.13.4. SWOT Analysis
- 12.1.1 Mirus Bio LLC
- 12.2. Market Entropy
- 12.2.1 Company's Key Areas Served
- 12.2.2 Recent Developments
- 12.3. Company Market Share Analysis 2025
- 12.3.1 Top 5 Companies Market Share Analysis
- 12.3.2 Top 3 Companies Market Share Analysis
- 12.4. List of Potential Customers
- 13. Research Methodology
List of Figures
- Figure 1: Global CRISPR and CAS Genes Industry Revenue Breakdown (billion, %) by Region 2025 & 2033
- Figure 2: Global CRISPR and CAS Genes Industry Volume Breakdown (K Unit, %) by Region 2025 & 2033
- Figure 3: North America CRISPR and CAS Genes Industry Revenue (billion), by Product 2025 & 2033
- Figure 4: North America CRISPR and CAS Genes Industry Volume (K Unit), by Product 2025 & 2033
- Figure 5: North America CRISPR and CAS Genes Industry Revenue Share (%), by Product 2025 & 2033
- Figure 6: North America CRISPR and CAS Genes Industry Volume Share (%), by Product 2025 & 2033
- Figure 7: North America CRISPR and CAS Genes Industry Revenue (billion), by Application 2025 & 2033
- Figure 8: North America CRISPR and CAS Genes Industry Volume (K Unit), by Application 2025 & 2033
- Figure 9: North America CRISPR and CAS Genes Industry Revenue Share (%), by Application 2025 & 2033
- Figure 10: North America CRISPR and CAS Genes Industry Volume Share (%), by Application 2025 & 2033
- Figure 11: North America CRISPR and CAS Genes Industry Revenue (billion), by Country 2025 & 2033
- Figure 12: North America CRISPR and CAS Genes Industry Volume (K Unit), by Country 2025 & 2033
- Figure 13: North America CRISPR and CAS Genes Industry Revenue Share (%), by Country 2025 & 2033
- Figure 14: North America CRISPR and CAS Genes Industry Volume Share (%), by Country 2025 & 2033
- Figure 15: Europe CRISPR and CAS Genes Industry Revenue (billion), by Product 2025 & 2033
- Figure 16: Europe CRISPR and CAS Genes Industry Volume (K Unit), by Product 2025 & 2033
- Figure 17: Europe CRISPR and CAS Genes Industry Revenue Share (%), by Product 2025 & 2033
- Figure 18: Europe CRISPR and CAS Genes Industry Volume Share (%), by Product 2025 & 2033
- Figure 19: Europe CRISPR and CAS Genes Industry Revenue (billion), by Application 2025 & 2033
- Figure 20: Europe CRISPR and CAS Genes Industry Volume (K Unit), by Application 2025 & 2033
- Figure 21: Europe CRISPR and CAS Genes Industry Revenue Share (%), by Application 2025 & 2033
- Figure 22: Europe CRISPR and CAS Genes Industry Volume Share (%), by Application 2025 & 2033
- Figure 23: Europe CRISPR and CAS Genes Industry Revenue (billion), by Country 2025 & 2033
- Figure 24: Europe CRISPR and CAS Genes Industry Volume (K Unit), by Country 2025 & 2033
- Figure 25: Europe CRISPR and CAS Genes Industry Revenue Share (%), by Country 2025 & 2033
- Figure 26: Europe CRISPR and CAS Genes Industry Volume Share (%), by Country 2025 & 2033
- Figure 27: Asia Pacific CRISPR and CAS Genes Industry Revenue (billion), by Product 2025 & 2033
- Figure 28: Asia Pacific CRISPR and CAS Genes Industry Volume (K Unit), by Product 2025 & 2033
- Figure 29: Asia Pacific CRISPR and CAS Genes Industry Revenue Share (%), by Product 2025 & 2033
- Figure 30: Asia Pacific CRISPR and CAS Genes Industry Volume Share (%), by Product 2025 & 2033
- Figure 31: Asia Pacific CRISPR and CAS Genes Industry Revenue (billion), by Application 2025 & 2033
- Figure 32: Asia Pacific CRISPR and CAS Genes Industry Volume (K Unit), by Application 2025 & 2033
- Figure 33: Asia Pacific CRISPR and CAS Genes Industry Revenue Share (%), by Application 2025 & 2033
- Figure 34: Asia Pacific CRISPR and CAS Genes Industry Volume Share (%), by Application 2025 & 2033
- Figure 35: Asia Pacific CRISPR and CAS Genes Industry Revenue (billion), by Country 2025 & 2033
- Figure 36: Asia Pacific CRISPR and CAS Genes Industry Volume (K Unit), by Country 2025 & 2033
- Figure 37: Asia Pacific CRISPR and CAS Genes Industry Revenue Share (%), by Country 2025 & 2033
- Figure 38: Asia Pacific CRISPR and CAS Genes Industry Volume Share (%), by Country 2025 & 2033
- Figure 39: Middle East and Africa CRISPR and CAS Genes Industry Revenue (billion), by Product 2025 & 2033
- Figure 40: Middle East and Africa CRISPR and CAS Genes Industry Volume (K Unit), by Product 2025 & 2033
- Figure 41: Middle East and Africa CRISPR and CAS Genes Industry Revenue Share (%), by Product 2025 & 2033
- Figure 42: Middle East and Africa CRISPR and CAS Genes Industry Volume Share (%), by Product 2025 & 2033
- Figure 43: Middle East and Africa CRISPR and CAS Genes Industry Revenue (billion), by Application 2025 & 2033
- Figure 44: Middle East and Africa CRISPR and CAS Genes Industry Volume (K Unit), by Application 2025 & 2033
- Figure 45: Middle East and Africa CRISPR and CAS Genes Industry Revenue Share (%), by Application 2025 & 2033
- Figure 46: Middle East and Africa CRISPR and CAS Genes Industry Volume Share (%), by Application 2025 & 2033
- Figure 47: Middle East and Africa CRISPR and CAS Genes Industry Revenue (billion), by Country 2025 & 2033
- Figure 48: Middle East and Africa CRISPR and CAS Genes Industry Volume (K Unit), by Country 2025 & 2033
- Figure 49: Middle East and Africa CRISPR and CAS Genes Industry Revenue Share (%), by Country 2025 & 2033
- Figure 50: Middle East and Africa CRISPR and CAS Genes Industry Volume Share (%), by Country 2025 & 2033
- Figure 51: South America CRISPR and CAS Genes Industry Revenue (billion), by Product 2025 & 2033
- Figure 52: South America CRISPR and CAS Genes Industry Volume (K Unit), by Product 2025 & 2033
- Figure 53: South America CRISPR and CAS Genes Industry Revenue Share (%), by Product 2025 & 2033
- Figure 54: South America CRISPR and CAS Genes Industry Volume Share (%), by Product 2025 & 2033
- Figure 55: South America CRISPR and CAS Genes Industry Revenue (billion), by Application 2025 & 2033
- Figure 56: South America CRISPR and CAS Genes Industry Volume (K Unit), by Application 2025 & 2033
- Figure 57: South America CRISPR and CAS Genes Industry Revenue Share (%), by Application 2025 & 2033
- Figure 58: South America CRISPR and CAS Genes Industry Volume Share (%), by Application 2025 & 2033
- Figure 59: South America CRISPR and CAS Genes Industry Revenue (billion), by Country 2025 & 2033
- Figure 60: South America CRISPR and CAS Genes Industry Volume (K Unit), by Country 2025 & 2033
- Figure 61: South America CRISPR and CAS Genes Industry Revenue Share (%), by Country 2025 & 2033
- Figure 62: South America CRISPR and CAS Genes Industry Volume Share (%), by Country 2025 & 2033
List of Tables
- Table 1: Global CRISPR and CAS Genes Industry Revenue billion Forecast, by Product 2020 & 2033
- Table 2: Global CRISPR and CAS Genes Industry Volume K Unit Forecast, by Product 2020 & 2033
- Table 3: Global CRISPR and CAS Genes Industry Revenue billion Forecast, by Application 2020 & 2033
- Table 4: Global CRISPR and CAS Genes Industry Volume K Unit Forecast, by Application 2020 & 2033
- Table 5: Global CRISPR and CAS Genes Industry Revenue billion Forecast, by Region 2020 & 2033
- Table 6: Global CRISPR and CAS Genes Industry Volume K Unit Forecast, by Region 2020 & 2033
- Table 7: Global CRISPR and CAS Genes Industry Revenue billion Forecast, by Product 2020 & 2033
- Table 8: Global CRISPR and CAS Genes Industry Volume K Unit Forecast, by Product 2020 & 2033
- Table 9: Global CRISPR and CAS Genes Industry Revenue billion Forecast, by Application 2020 & 2033
- Table 10: Global CRISPR and CAS Genes Industry Volume K Unit Forecast, by Application 2020 & 2033
- Table 11: Global CRISPR and CAS Genes Industry Revenue billion Forecast, by Country 2020 & 2033
- Table 12: Global CRISPR and CAS Genes Industry Volume K Unit Forecast, by Country 2020 & 2033
- Table 13: United States CRISPR and CAS Genes Industry Revenue (billion) Forecast, by Application 2020 & 2033
- Table 14: United States CRISPR and CAS Genes Industry Volume (K Unit) Forecast, by Application 2020 & 2033
- Table 15: Canada CRISPR and CAS Genes Industry Revenue (billion) Forecast, by Application 2020 & 2033
- Table 16: Canada CRISPR and CAS Genes Industry Volume (K Unit) Forecast, by Application 2020 & 2033
- Table 17: Mexico CRISPR and CAS Genes Industry Revenue (billion) Forecast, by Application 2020 & 2033
- Table 18: Mexico CRISPR and CAS Genes Industry Volume (K Unit) Forecast, by Application 2020 & 2033
- Table 19: Global CRISPR and CAS Genes Industry Revenue billion Forecast, by Product 2020 & 2033
- Table 20: Global CRISPR and CAS Genes Industry Volume K Unit Forecast, by Product 2020 & 2033
- Table 21: Global CRISPR and CAS Genes Industry Revenue billion Forecast, by Application 2020 & 2033
- Table 22: Global CRISPR and CAS Genes Industry Volume K Unit Forecast, by Application 2020 & 2033
- Table 23: Global CRISPR and CAS Genes Industry Revenue billion Forecast, by Country 2020 & 2033
- Table 24: Global CRISPR and CAS Genes Industry Volume K Unit Forecast, by Country 2020 & 2033
- Table 25: Germany CRISPR and CAS Genes Industry Revenue (billion) Forecast, by Application 2020 & 2033
- Table 26: Germany CRISPR and CAS Genes Industry Volume (K Unit) Forecast, by Application 2020 & 2033
- Table 27: United Kingdom CRISPR and CAS Genes Industry Revenue (billion) Forecast, by Application 2020 & 2033
- Table 28: United Kingdom CRISPR and CAS Genes Industry Volume (K Unit) Forecast, by Application 2020 & 2033
- Table 29: France CRISPR and CAS Genes Industry Revenue (billion) Forecast, by Application 2020 & 2033
- Table 30: France CRISPR and CAS Genes Industry Volume (K Unit) Forecast, by Application 2020 & 2033
- Table 31: Italy CRISPR and CAS Genes Industry Revenue (billion) Forecast, by Application 2020 & 2033
- Table 32: Italy CRISPR and CAS Genes Industry Volume (K Unit) Forecast, by Application 2020 & 2033
- Table 33: Spain CRISPR and CAS Genes Industry Revenue (billion) Forecast, by Application 2020 & 2033
- Table 34: Spain CRISPR and CAS Genes Industry Volume (K Unit) Forecast, by Application 2020 & 2033
- Table 35: Rest of Europe CRISPR and CAS Genes Industry Revenue (billion) Forecast, by Application 2020 & 2033
- Table 36: Rest of Europe CRISPR and CAS Genes Industry Volume (K Unit) Forecast, by Application 2020 & 2033
- Table 37: Global CRISPR and CAS Genes Industry Revenue billion Forecast, by Product 2020 & 2033
- Table 38: Global CRISPR and CAS Genes Industry Volume K Unit Forecast, by Product 2020 & 2033
- Table 39: Global CRISPR and CAS Genes Industry Revenue billion Forecast, by Application 2020 & 2033
- Table 40: Global CRISPR and CAS Genes Industry Volume K Unit Forecast, by Application 2020 & 2033
- Table 41: Global CRISPR and CAS Genes Industry Revenue billion Forecast, by Country 2020 & 2033
- Table 42: Global CRISPR and CAS Genes Industry Volume K Unit Forecast, by Country 2020 & 2033
- Table 43: China CRISPR and CAS Genes Industry Revenue (billion) Forecast, by Application 2020 & 2033
- Table 44: China CRISPR and CAS Genes Industry Volume (K Unit) Forecast, by Application 2020 & 2033
- Table 45: Japan CRISPR and CAS Genes Industry Revenue (billion) Forecast, by Application 2020 & 2033
- Table 46: Japan CRISPR and CAS Genes Industry Volume (K Unit) Forecast, by Application 2020 & 2033
- Table 47: India CRISPR and CAS Genes Industry Revenue (billion) Forecast, by Application 2020 & 2033
- Table 48: India CRISPR and CAS Genes Industry Volume (K Unit) Forecast, by Application 2020 & 2033
- Table 49: Australia CRISPR and CAS Genes Industry Revenue (billion) Forecast, by Application 2020 & 2033
- Table 50: Australia CRISPR and CAS Genes Industry Volume (K Unit) Forecast, by Application 2020 & 2033
- Table 51: South Korea CRISPR and CAS Genes Industry Revenue (billion) Forecast, by Application 2020 & 2033
- Table 52: South Korea CRISPR and CAS Genes Industry Volume (K Unit) Forecast, by Application 2020 & 2033
- Table 53: Rest of Asia Pacific CRISPR and CAS Genes Industry Revenue (billion) Forecast, by Application 2020 & 2033
- Table 54: Rest of Asia Pacific CRISPR and CAS Genes Industry Volume (K Unit) Forecast, by Application 2020 & 2033
- Table 55: Global CRISPR and CAS Genes Industry Revenue billion Forecast, by Product 2020 & 2033
- Table 56: Global CRISPR and CAS Genes Industry Volume K Unit Forecast, by Product 2020 & 2033
- Table 57: Global CRISPR and CAS Genes Industry Revenue billion Forecast, by Application 2020 & 2033
- Table 58: Global CRISPR and CAS Genes Industry Volume K Unit Forecast, by Application 2020 & 2033
- Table 59: Global CRISPR and CAS Genes Industry Revenue billion Forecast, by Country 2020 & 2033
- Table 60: Global CRISPR and CAS Genes Industry Volume K Unit Forecast, by Country 2020 & 2033
- Table 61: GCC CRISPR and CAS Genes Industry Revenue (billion) Forecast, by Application 2020 & 2033
- Table 62: GCC CRISPR and CAS Genes Industry Volume (K Unit) Forecast, by Application 2020 & 2033
- Table 63: South Africa CRISPR and CAS Genes Industry Revenue (billion) Forecast, by Application 2020 & 2033
- Table 64: South Africa CRISPR and CAS Genes Industry Volume (K Unit) Forecast, by Application 2020 & 2033
- Table 65: Rest of Middle East and Africa CRISPR and CAS Genes Industry Revenue (billion) Forecast, by Application 2020 & 2033
- Table 66: Rest of Middle East and Africa CRISPR and CAS Genes Industry Volume (K Unit) Forecast, by Application 2020 & 2033
- Table 67: Global CRISPR and CAS Genes Industry Revenue billion Forecast, by Product 2020 & 2033
- Table 68: Global CRISPR and CAS Genes Industry Volume K Unit Forecast, by Product 2020 & 2033
- Table 69: Global CRISPR and CAS Genes Industry Revenue billion Forecast, by Application 2020 & 2033
- Table 70: Global CRISPR and CAS Genes Industry Volume K Unit Forecast, by Application 2020 & 2033
- Table 71: Global CRISPR and CAS Genes Industry Revenue billion Forecast, by Country 2020 & 2033
- Table 72: Global CRISPR and CAS Genes Industry Volume K Unit Forecast, by Country 2020 & 2033
- Table 73: Brazil CRISPR and CAS Genes Industry Revenue (billion) Forecast, by Application 2020 & 2033
- Table 74: Brazil CRISPR and CAS Genes Industry Volume (K Unit) Forecast, by Application 2020 & 2033
- Table 75: Argentina CRISPR and CAS Genes Industry Revenue (billion) Forecast, by Application 2020 & 2033
- Table 76: Argentina CRISPR and CAS Genes Industry Volume (K Unit) Forecast, by Application 2020 & 2033
- Table 77: Rest of South America CRISPR and CAS Genes Industry Revenue (billion) Forecast, by Application 2020 & 2033
- Table 78: Rest of South America CRISPR and CAS Genes Industry Volume (K Unit) Forecast, by Application 2020 & 2033
Frequently Asked Questions
1. What is the projected Compound Annual Growth Rate (CAGR) of the CRISPR and CAS Genes Industry?
The projected CAGR is approximately 17.14%.
2. Which companies are prominent players in the CRISPR and CAS Genes Industry?
Key companies in the market include Mirus Bio LLC, Sangamo Therapeutics, Addgene, Merck KGaA, Caribou Biosciences Inc, PerkinElmer Inc (Horizon Discovery Ltd ), Takara Bio Inc, Intellia Therpeutics, Inscripta Inc, OriGene Technologies Inc, Thermo Fisher Scientific, Editas Medicine, CRISPR THERAPEUTICS.
3. What are the main segments of the CRISPR and CAS Genes Industry?
The market segments include Product, Application.
4. Can you provide details about the market size?
The market size is estimated to be USD 5.6 billion as of 2022.
5. What are some drivers contributing to market growth?
Increasing Investment by Biotechnology Companies for Novel Therapeutics; Increasing Genomics Research and Development Activities and Funding; High Burden of Cancer and Other Diseases.
6. What are the notable trends driving market growth?
Genome Engineering Segment is Anticipated to Witness a Growth in the Market Over the Forecast Period.
7. Are there any restraints impacting market growth?
Off-target Effects Associated with the Implementation of CRISPR; High Cost and Ethical Concerns Associated with CRISPR Technology.
8. Can you provide examples of recent developments in the market?
December 2022: A researcher from the University of California sponsored a clinical trial under the title "Transplantation of Clustered Regularly Interspaced Short Palindromic Repeats Modified Hematopoietic Progenitor Stem Cells (CRISPR_SCD001) in Patients With Severe Sickle Cell Disease" to evaluate the hematopoietic stem cell transplantation (HSCT) using CRISPR/Cas9 edited red blood cells (known as CRISPR_SCD001 Drug Product).
9. What pricing options are available for accessing the report?
Pricing options include single-user, multi-user, and enterprise licenses priced at USD 4750, USD 5250, and USD 8750 respectively.
10. Is the market size provided in terms of value or volume?
The market size is provided in terms of value, measured in billion and volume, measured in K Unit.
11. Are there any specific market keywords associated with the report?
Yes, the market keyword associated with the report is "CRISPR and CAS Genes Industry," which aids in identifying and referencing the specific market segment covered.
12. How do I determine which pricing option suits my needs best?
The pricing options vary based on user requirements and access needs. Individual users may opt for single-user licenses, while businesses requiring broader access may choose multi-user or enterprise licenses for cost-effective access to the report.
13. Are there any additional resources or data provided in the CRISPR and CAS Genes Industry report?
While the report offers comprehensive insights, it's advisable to review the specific contents or supplementary materials provided to ascertain if additional resources or data are available.
14. How can I stay updated on further developments or reports in the CRISPR and CAS Genes Industry?
To stay informed about further developments, trends, and reports in the CRISPR and CAS Genes Industry, consider subscribing to industry newsletters, following relevant companies and organizations, or regularly checking reputable industry news sources and publications.
Methodology
Step 1 - Identification of Relevant Samples Size from Population Database


Step 2 - Approaches for Defining Global Market Size (Value, Volume* & Price*)

Note*: In applicable scenarios
Step 3 - Data Sources
Primary Research
- Web Analytics
- Survey Reports
- Research Institute
- Latest Research Reports
- Opinion Leaders
Secondary Research
- Annual Reports
- White Paper
- Latest Press Release
- Industry Association
- Paid Database
- Investor Presentations

Step 4 - Data Triangulation
Involves using different sources of information in order to increase the validity of a study
These sources are likely to be stakeholders in a program - participants, other researchers, program staff, other community members, and so on.
Then we put all data in single framework & apply various statistical tools to find out the dynamic on the market.
During the analysis stage, feedback from the stakeholder groups would be compared to determine areas of agreement as well as areas of divergence