

Key Insights
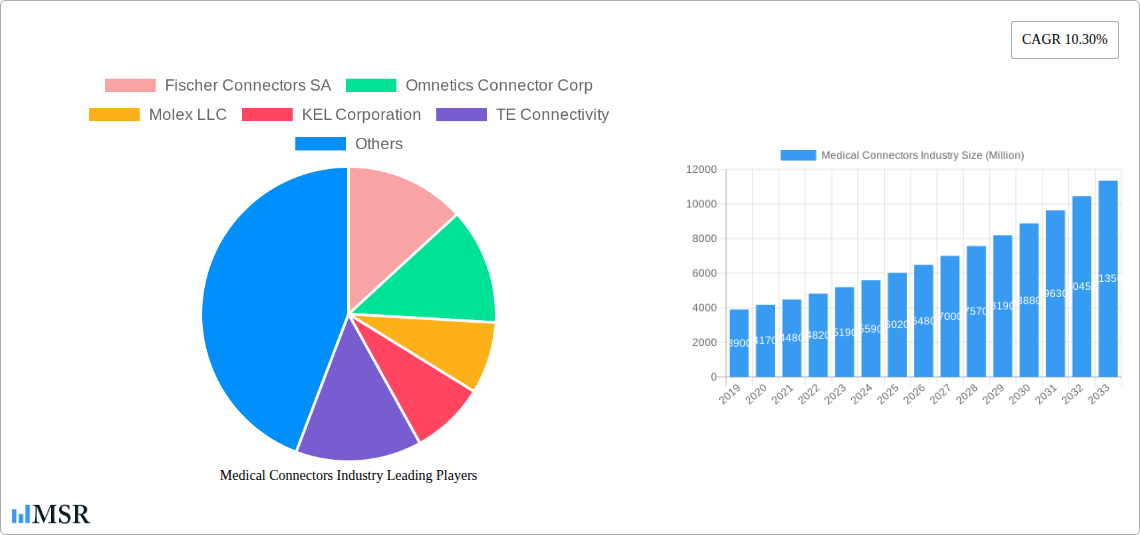
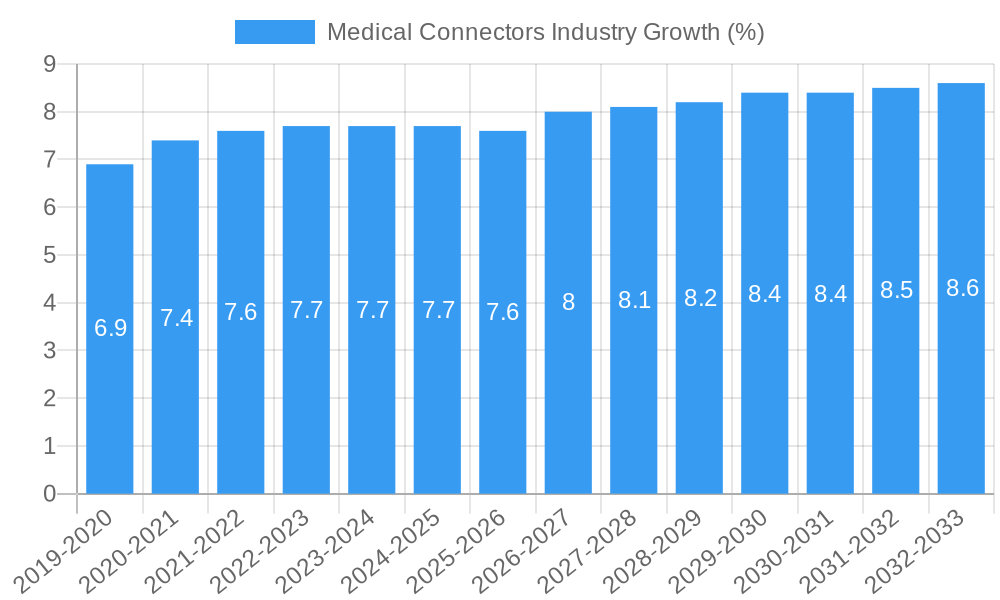
The global Medical Connectors Industry is poised for robust expansion, projected to reach a substantial market size of approximately $6,500 million by 2025. This growth is fueled by a significant Compound Annual Growth Rate (CAGR) of 10.30% from 2019 to 2033, indicating a dynamic and expanding market. Key drivers for this surge include the increasing prevalence of chronic diseases and an aging global population, which consequently elevates the demand for sophisticated patient monitoring and diagnostic equipment. Furthermore, rapid technological advancements in medical devices, such as the integration of miniaturized electronics and the development of advanced imaging technologies, necessitate innovative and high-performance connector solutions. The growing adoption of minimally invasive surgical techniques also contributes to the demand for specialized, reliable, and sterile connectors designed for these procedures.
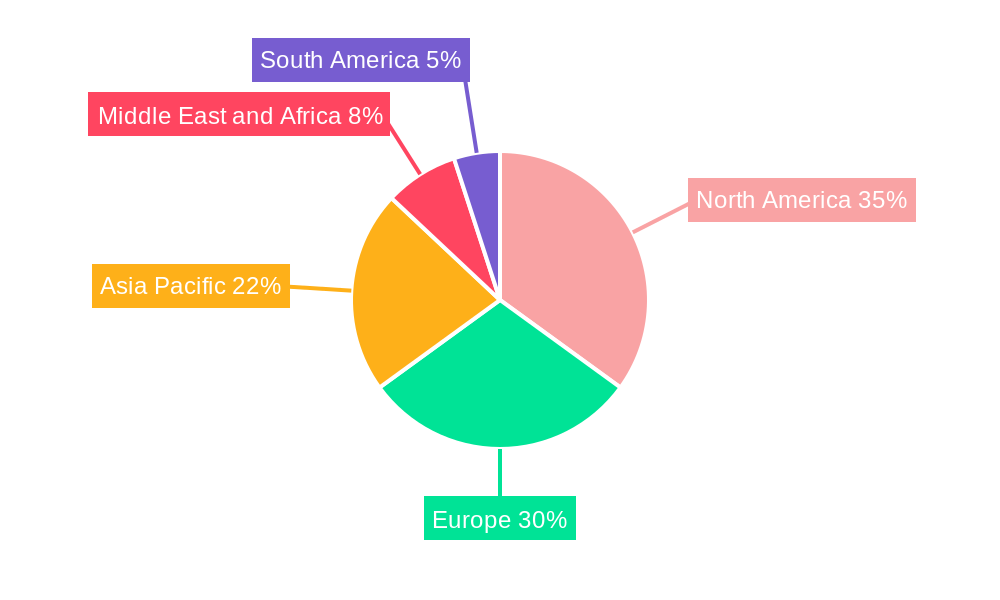
The market is characterized by a diverse range of segments, with product innovation playing a crucial role. Flat Silicone Surgical Cables, Embedded Electronics Connectors, and Radio-Frequency Connectors are among the high-demand product categories, driven by their application in cutting-edge medical devices. Patient Monitoring Devices, Electrosurgical Devices, and Diagnostic Imaging Devices represent major application segments, underscoring the critical role of medical connectors in ensuring the functionality and safety of these essential healthcare tools. Hospitals and Ambulatory Surgical Centers are the dominant end-user segments, reflecting the primary environments where these devices are deployed. Geographically, North America and Europe are expected to lead the market, owing to their well-established healthcare infrastructure and high healthcare expenditure. However, the Asia Pacific region is anticipated to witness the fastest growth, driven by increasing healthcare investments, a growing middle class, and expanding access to advanced medical technologies. While the market presents significant opportunities, potential restraints include stringent regulatory approvals, the high cost of advanced connector technologies, and the need for robust cybersecurity measures for connected medical devices.
Comprehensive Report on the Medical Connectors Industry: Market Size, Trends, and Future Outlook (2019-2033)
Unlock critical insights into the burgeoning medical connectors industry with this in-depth report. Covering the study period 2019–2033, with a base year of 2025, and a forecast period of 2025–2033, this analysis provides an unparalleled understanding of market dynamics, technological advancements, and growth opportunities. Explore the latest innovations in flat silicone surgical cables, embedded electronics connectors, disposable plastic connectors, magnetic medical connectors, and more, crucial for patient monitoring devices, electrosurgical devices, diagnostic imaging devices, and cardiology devices. This report is essential for hospitals, ambulatory surgical centers, and other stakeholders seeking to navigate the complexities of this rapidly evolving sector.
Medical Connectors Industry Market Concentration & Dynamics
The medical connectors market exhibits a moderate to high concentration, with key players like TE Connectivity, Amphenol Corporation, Molex LLC, and Fischer Connectors SA holding significant market shares. Innovation ecosystems are driven by a confluence of technological advancements in miniaturization, material science, and signal integrity. Regulatory frameworks, such as FDA and CE marking, are paramount, influencing product development and market entry strategies. The presence of substitute products, primarily within legacy connector technologies, is being steadily diminished by the superior performance and safety features of modern medical connectors. End-user trends are increasingly demanding enhanced reliability, biocompatibility, and miniaturization for complex medical devices. M&A activities are notable, as larger entities seek to expand their portfolios and geographical reach. For instance, the acquisition of specialized connector manufacturers by diversified technology giants contributes to market consolidation. The number of M&A deals within the medical connector sector has seen a steady increase, reflecting strategic consolidation aimed at capturing greater market share and technological expertise.
Medical Connectors Industry Industry Insights & Trends
The medical connectors industry is poised for substantial growth, driven by escalating global healthcare expenditures, an aging population, and the increasing prevalence of chronic diseases. The market size is projected to reach XX Million by 2025, with a projected Compound Annual Growth Rate (CAGR) of XX% from 2019–2033. Technological disruptions, including the advent of IoT in healthcare, miniaturization trends in medical devices, and the growing adoption of wearable health monitors, are profoundly influencing the demand for advanced medical connector solutions. The rising preference for minimally invasive procedures further fuels the need for compact, high-performance connectors in endoscopy devices and neurology devices. Evolving consumer behaviors, characterized by a demand for patient-centric care and remote monitoring capabilities, are creating new avenues for medical connector innovation. The increasing integration of electronics into medical devices, from simple probes to sophisticated imaging systems, necessitates robust and reliable interconnectivity. Furthermore, the push towards single-use and disposable medical components, particularly in infection-sensitive applications, is driving the demand for advanced disposable plastic connectors. The market size for medical connectors in 2025 is estimated at XX Million.
Key Markets & Segments Leading Medical Connectors Industry
North America currently dominates the medical connectors market, with the United States leading in both consumption and innovation. This dominance is attributable to a robust healthcare infrastructure, high R&D investments, and a strong regulatory framework that fosters advanced medical device development.
Product Segment Dominance:
- Disposable Plastic Connectors: This segment is experiencing rapid growth due to increasing concerns about healthcare-associated infections and the rising demand for single-use medical devices. Their cost-effectiveness and ease of disposal make them ideal for a wide range of patient monitoring devices and enteral devices. The market for disposable plastic connectors is expected to grow at a significant CAGR.
- Hybrid Circular Connector and Receptacle Systems: These are crucial for applications demanding high reliability and complex functionalities, such as diagnostic imaging devices and analyzers and processing equipment. Their ability to integrate multiple signal types, power, and data within a single connector is a key growth driver.
- Push-Pull Connectors: Widely adopted in patient monitoring devices, respiratory devices, and dental instruments, these connectors offer quick and secure mating and unmating, essential for time-sensitive medical procedures and emergency care.
Application Segment Dominance:
- Patient Monitoring Devices: This segment represents a substantial portion of the medical connectors market. The continuous need for real-time data acquisition and reliable signal transmission in intensive care units, operating rooms, and home healthcare settings drives the demand for specialized connectors.
- Diagnostic Imaging Devices: The complexity and high-resolution requirements of diagnostic imaging devices like MRI and CT scanners necessitate connectors capable of handling high-frequency signals and large data volumes with minimal signal loss.
End User Segment Dominance:
- Hospitals: As the primary healthcare providers, hospitals represent the largest end-user segment. Their continuous procurement of medical equipment, from diagnostic tools to surgical instruments, fuels the demand for a wide array of medical connectors.
Medical Connectors Industry Product Developments
Product developments in the medical connectors industry are characterized by a relentless pursuit of miniaturization, enhanced biocompatibility, and superior signal integrity. Innovations such as magnetic medical connectors are gaining traction for their ease of use and sterile connection capabilities, particularly in sensitive applications. The integration of advanced materials and manufacturing techniques allows for the creation of highly reliable embedded electronics connectors that can withstand demanding sterilization processes. The ongoing development of push-pull connectors with improved latching mechanisms and higher pin densities caters to the evolving needs of patient monitoring devices and neurology devices, offering both safety and efficiency.
Challenges in the Medical Connectors Industry Market
The medical connectors industry faces significant challenges, including stringent and evolving regulatory compliance requirements across different global markets, which can increase R&D and manufacturing costs. Supply chain disruptions, as witnessed in recent years, pose a considerable risk, impacting the availability of raw materials and components, and potentially leading to production delays. Furthermore, intense competitive pressures from both established players and emerging manufacturers, especially in the low-cost segment, exert constant pressure on pricing and profit margins.
Forces Driving Medical Connectors Industry Growth
Several key forces are driving the growth of the medical connectors industry. Technological advancements, such as the miniaturization of implantable and wearable medical devices, necessitate smaller and more sophisticated connectors. The increasing global adoption of telemedicine and remote patient monitoring solutions amplifies the demand for reliable and secure connectivity. Economic factors, including rising healthcare spending in emerging economies and government initiatives to improve healthcare access, also contribute significantly to market expansion. Regulatory bodies, while posing challenges, also drive innovation by setting higher standards for safety and performance.
Challenges in the Medical Connectors Industry Market
Long-term growth catalysts in the medical connectors industry are deeply rooted in continuous innovation and market expansion. The ongoing digital transformation of healthcare, characterized by the increasing adoption of AI, IoT, and big data analytics, will demand more advanced interconnect solutions for data transmission and power delivery. Strategic partnerships between medical device manufacturers and connector suppliers are crucial for co-developing next-generation products tailored to specific clinical needs. Furthermore, the expansion of healthcare infrastructure in developing regions presents significant market opportunities for established and emerging players alike, driving sustained growth.
Emerging Opportunities in Medical Connectors Industry
Emerging opportunities in the medical connectors industry are abundant, particularly in the rapidly growing fields of personalized medicine and advanced diagnostics. The development of connectors for next-generation sequencing and in-vitro diagnostic devices presents a lucrative avenue. The increasing demand for robust and miniaturized connectors for wearable and implantable biosensors used in chronic disease management and preventative healthcare is another key growth area. Furthermore, the integration of wireless charging capabilities within medical devices, facilitated by specialized connectors, is creating new market niches. The focus on antimicrobial coatings and self-sterilizing connector technologies also presents significant opportunities for product differentiation.
Leading Players in the Medical Connectors Industry Sector
- Fischer Connectors SA
- Omnetics Connector Corp
- Molex LLC
- KEL Corporation
- TE Connectivity
- Smiths Interconnect
- Amphenol Corporation
- Souriau
- Salter Labs
- Shenzhen Xime Connector Technology Co Ltd
- Qosina
- ITT Interconnect Solutions
Key Milestones in Medical Connectors Industry Industry
- August 2022: TE Connectivity Corporation, United States, launched a EUR 5 million rapid prototyping center for medical devices at its existing manufacturing facility in Galway, significantly enhancing its ability to deliver innovative solutions quickly.
- July 2022: Qosina introduced 25 new tube-to-tube barb connectors to its portfolio. Qosina has an extensive inventory of tube-to-tube barb connections in over 500 different designs. These connectors may support inner tube sizes as small as 1/32 inch (0.031 inches, 0.8 mm) and as large as 1 inch (25.4 mm), addressing a wide range of fluid management needs in medical devices.
Strategic Outlook for Medical Connectors Industry Market
The strategic outlook for the medical connectors industry is overwhelmingly positive, driven by the relentless pace of medical innovation and the global imperative to improve healthcare outcomes. Growth accelerators will include the increasing integration of connectivity in point-of-care diagnostics, the expanding market for minimally invasive surgical instruments, and the continued development of sophisticated implantable devices. Companies that focus on developing highly reliable, miniaturized, and biocompatible connector solutions, while navigating complex regulatory landscapes, are best positioned for success. Strategic opportunities lie in forging strong collaborations with medical device OEMs to co-create bespoke connector designs and in expanding market reach into underserved geographical regions with growing healthcare needs.
Medical Connectors Industry Segmentation
-
1. Product
- 1.1. Flat Silicone Surgical Cables
- 1.2. Embedded Electronics Connectors
- 1.3. Radio-Frequency Connectors
- 1.4. Disposable Plastic Connectors
- 1.5. Hybrid Circular Connector and Receptacle Systems
- 1.6. Power Cords With Retention Systems
- 1.7. Lighted Hospital-Grade Cords
- 1.8. Magnetic Medical Connectors
- 1.9. Push-Pull Connectors
-
2. Application
- 2.1. Patient Monitoring Devices
- 2.2. Electrosurgical Devices
- 2.3. Diagnostic Imaging Devices
- 2.4. Cardiology Devices
- 2.5. Analyzers and Processing Equipment
- 2.6. Respiratory Devices
- 2.7. Dental Instruments
- 2.8. Endoscopy Devices
- 2.9. Neurology Devices
- 2.10. Enteral Devices
- 2.11. Other Applications
-
3. End User
- 3.1. Hospitals
- 3.2. Ambulatory Surgical Centers
- 3.3. Other End Users
Medical Connectors Industry Segmentation By Geography
-
1. North America
- 1.1. United States
- 1.2. Canada
- 1.3. Mexico
-
2. Europe
- 2.1. Germany
- 2.2. United Kingdom
- 2.3. France
- 2.4. Italy
- 2.5. Spain
- 2.6. Rest of Europe
-
3. Asia Pacific
- 3.1. China
- 3.2. Japan
- 3.3. India
- 3.4. Australia
- 3.5. South Korea
- 3.6. Rest of Asia Pacific
-
4. Middle East and Africa
- 4.1. GCC
- 4.2. South Africa
- 4.3. Rest of Middle East and Africa
-
5. South America
- 5.1. Brazil
- 5.2. Argentina
- 5.3. Rest of South America
Medical Connectors Industry REPORT HIGHLIGHTS
| Aspects | Details |
|---|---|
| Study Period | 2019-2033 |
| Base Year | 2024 |
| Estimated Year | 2025 |
| Forecast Period | 2025-2033 |
| Historical Period | 2019-2024 |
| Growth Rate | CAGR of 10.30% from 2019-2033 |
| Segmentation |
|
Table of Contents
- 1. Introduction
- 1.1. Research Scope
- 1.2. Market Segmentation
- 1.3. Research Methodology
- 1.4. Definitions and Assumptions
- 2. Executive Summary
- 2.1. Introduction
- 3. Market Dynamics
- 3.1. Introduction
- 3.2. Market Drivers
- 3.2.1. Rising Incidence of Chronic Diseases; Rising Medical Device Market
- 3.3. Market Restrains
- 3.3.1. Stringent Regulatory Standars
- 3.4. Market Trends
- 3.4.1. Patient Monitoring Segment is Expected to Hold the Large Share in the Market Studied During the Forecast Period
- 4. Market Factor Analysis
- 4.1. Porters Five Forces
- 4.2. Supply/Value Chain
- 4.3. PESTEL analysis
- 4.4. Market Entropy
- 4.5. Patent/Trademark Analysis
- 5. Global Medical Connectors Industry Analysis, Insights and Forecast, 2019-2031
- 5.1. Market Analysis, Insights and Forecast - by Product
- 5.1.1. Flat Silicone Surgical Cables
- 5.1.2. Embedded Electronics Connectors
- 5.1.3. Radio-Frequency Connectors
- 5.1.4. Disposable Plastic Connectors
- 5.1.5. Hybrid Circular Connector and Receptacle Systems
- 5.1.6. Power Cords With Retention Systems
- 5.1.7. Lighted Hospital-Grade Cords
- 5.1.8. Magnetic Medical Connectors
- 5.1.9. Push-Pull Connectors
- 5.2. Market Analysis, Insights and Forecast - by Application
- 5.2.1. Patient Monitoring Devices
- 5.2.2. Electrosurgical Devices
- 5.2.3. Diagnostic Imaging Devices
- 5.2.4. Cardiology Devices
- 5.2.5. Analyzers and Processing Equipment
- 5.2.6. Respiratory Devices
- 5.2.7. Dental Instruments
- 5.2.8. Endoscopy Devices
- 5.2.9. Neurology Devices
- 5.2.10. Enteral Devices
- 5.2.11. Other Applications
- 5.3. Market Analysis, Insights and Forecast - by End User
- 5.3.1. Hospitals
- 5.3.2. Ambulatory Surgical Centers
- 5.3.3. Other End Users
- 5.4. Market Analysis, Insights and Forecast - by Region
- 5.4.1. North America
- 5.4.2. Europe
- 5.4.3. Asia Pacific
- 5.4.4. Middle East and Africa
- 5.4.5. South America
- 5.1. Market Analysis, Insights and Forecast - by Product
- 6. North America Medical Connectors Industry Analysis, Insights and Forecast, 2019-2031
- 6.1. Market Analysis, Insights and Forecast - by Product
- 6.1.1. Flat Silicone Surgical Cables
- 6.1.2. Embedded Electronics Connectors
- 6.1.3. Radio-Frequency Connectors
- 6.1.4. Disposable Plastic Connectors
- 6.1.5. Hybrid Circular Connector and Receptacle Systems
- 6.1.6. Power Cords With Retention Systems
- 6.1.7. Lighted Hospital-Grade Cords
- 6.1.8. Magnetic Medical Connectors
- 6.1.9. Push-Pull Connectors
- 6.2. Market Analysis, Insights and Forecast - by Application
- 6.2.1. Patient Monitoring Devices
- 6.2.2. Electrosurgical Devices
- 6.2.3. Diagnostic Imaging Devices
- 6.2.4. Cardiology Devices
- 6.2.5. Analyzers and Processing Equipment
- 6.2.6. Respiratory Devices
- 6.2.7. Dental Instruments
- 6.2.8. Endoscopy Devices
- 6.2.9. Neurology Devices
- 6.2.10. Enteral Devices
- 6.2.11. Other Applications
- 6.3. Market Analysis, Insights and Forecast - by End User
- 6.3.1. Hospitals
- 6.3.2. Ambulatory Surgical Centers
- 6.3.3. Other End Users
- 6.1. Market Analysis, Insights and Forecast - by Product
- 7. Europe Medical Connectors Industry Analysis, Insights and Forecast, 2019-2031
- 7.1. Market Analysis, Insights and Forecast - by Product
- 7.1.1. Flat Silicone Surgical Cables
- 7.1.2. Embedded Electronics Connectors
- 7.1.3. Radio-Frequency Connectors
- 7.1.4. Disposable Plastic Connectors
- 7.1.5. Hybrid Circular Connector and Receptacle Systems
- 7.1.6. Power Cords With Retention Systems
- 7.1.7. Lighted Hospital-Grade Cords
- 7.1.8. Magnetic Medical Connectors
- 7.1.9. Push-Pull Connectors
- 7.2. Market Analysis, Insights and Forecast - by Application
- 7.2.1. Patient Monitoring Devices
- 7.2.2. Electrosurgical Devices
- 7.2.3. Diagnostic Imaging Devices
- 7.2.4. Cardiology Devices
- 7.2.5. Analyzers and Processing Equipment
- 7.2.6. Respiratory Devices
- 7.2.7. Dental Instruments
- 7.2.8. Endoscopy Devices
- 7.2.9. Neurology Devices
- 7.2.10. Enteral Devices
- 7.2.11. Other Applications
- 7.3. Market Analysis, Insights and Forecast - by End User
- 7.3.1. Hospitals
- 7.3.2. Ambulatory Surgical Centers
- 7.3.3. Other End Users
- 7.1. Market Analysis, Insights and Forecast - by Product
- 8. Asia Pacific Medical Connectors Industry Analysis, Insights and Forecast, 2019-2031
- 8.1. Market Analysis, Insights and Forecast - by Product
- 8.1.1. Flat Silicone Surgical Cables
- 8.1.2. Embedded Electronics Connectors
- 8.1.3. Radio-Frequency Connectors
- 8.1.4. Disposable Plastic Connectors
- 8.1.5. Hybrid Circular Connector and Receptacle Systems
- 8.1.6. Power Cords With Retention Systems
- 8.1.7. Lighted Hospital-Grade Cords
- 8.1.8. Magnetic Medical Connectors
- 8.1.9. Push-Pull Connectors
- 8.2. Market Analysis, Insights and Forecast - by Application
- 8.2.1. Patient Monitoring Devices
- 8.2.2. Electrosurgical Devices
- 8.2.3. Diagnostic Imaging Devices
- 8.2.4. Cardiology Devices
- 8.2.5. Analyzers and Processing Equipment
- 8.2.6. Respiratory Devices
- 8.2.7. Dental Instruments
- 8.2.8. Endoscopy Devices
- 8.2.9. Neurology Devices
- 8.2.10. Enteral Devices
- 8.2.11. Other Applications
- 8.3. Market Analysis, Insights and Forecast - by End User
- 8.3.1. Hospitals
- 8.3.2. Ambulatory Surgical Centers
- 8.3.3. Other End Users
- 8.1. Market Analysis, Insights and Forecast - by Product
- 9. Middle East and Africa Medical Connectors Industry Analysis, Insights and Forecast, 2019-2031
- 9.1. Market Analysis, Insights and Forecast - by Product
- 9.1.1. Flat Silicone Surgical Cables
- 9.1.2. Embedded Electronics Connectors
- 9.1.3. Radio-Frequency Connectors
- 9.1.4. Disposable Plastic Connectors
- 9.1.5. Hybrid Circular Connector and Receptacle Systems
- 9.1.6. Power Cords With Retention Systems
- 9.1.7. Lighted Hospital-Grade Cords
- 9.1.8. Magnetic Medical Connectors
- 9.1.9. Push-Pull Connectors
- 9.2. Market Analysis, Insights and Forecast - by Application
- 9.2.1. Patient Monitoring Devices
- 9.2.2. Electrosurgical Devices
- 9.2.3. Diagnostic Imaging Devices
- 9.2.4. Cardiology Devices
- 9.2.5. Analyzers and Processing Equipment
- 9.2.6. Respiratory Devices
- 9.2.7. Dental Instruments
- 9.2.8. Endoscopy Devices
- 9.2.9. Neurology Devices
- 9.2.10. Enteral Devices
- 9.2.11. Other Applications
- 9.3. Market Analysis, Insights and Forecast - by End User
- 9.3.1. Hospitals
- 9.3.2. Ambulatory Surgical Centers
- 9.3.3. Other End Users
- 9.1. Market Analysis, Insights and Forecast - by Product
- 10. South America Medical Connectors Industry Analysis, Insights and Forecast, 2019-2031
- 10.1. Market Analysis, Insights and Forecast - by Product
- 10.1.1. Flat Silicone Surgical Cables
- 10.1.2. Embedded Electronics Connectors
- 10.1.3. Radio-Frequency Connectors
- 10.1.4. Disposable Plastic Connectors
- 10.1.5. Hybrid Circular Connector and Receptacle Systems
- 10.1.6. Power Cords With Retention Systems
- 10.1.7. Lighted Hospital-Grade Cords
- 10.1.8. Magnetic Medical Connectors
- 10.1.9. Push-Pull Connectors
- 10.2. Market Analysis, Insights and Forecast - by Application
- 10.2.1. Patient Monitoring Devices
- 10.2.2. Electrosurgical Devices
- 10.2.3. Diagnostic Imaging Devices
- 10.2.4. Cardiology Devices
- 10.2.5. Analyzers and Processing Equipment
- 10.2.6. Respiratory Devices
- 10.2.7. Dental Instruments
- 10.2.8. Endoscopy Devices
- 10.2.9. Neurology Devices
- 10.2.10. Enteral Devices
- 10.2.11. Other Applications
- 10.3. Market Analysis, Insights and Forecast - by End User
- 10.3.1. Hospitals
- 10.3.2. Ambulatory Surgical Centers
- 10.3.3. Other End Users
- 10.1. Market Analysis, Insights and Forecast - by Product
- 11. North America Medical Connectors Industry Analysis, Insights and Forecast, 2019-2031
- 11.1. Market Analysis, Insights and Forecast - By Country/Sub-region
- 11.1.1 United States
- 11.1.2 Canada
- 11.1.3 Mexico
- 12. Europe Medical Connectors Industry Analysis, Insights and Forecast, 2019-2031
- 12.1. Market Analysis, Insights and Forecast - By Country/Sub-region
- 12.1.1 Germany
- 12.1.2 United Kingdom
- 12.1.3 France
- 12.1.4 Italy
- 12.1.5 Spain
- 12.1.6 Rest of Europe
- 13. Asia Pacific Medical Connectors Industry Analysis, Insights and Forecast, 2019-2031
- 13.1. Market Analysis, Insights and Forecast - By Country/Sub-region
- 13.1.1 China
- 13.1.2 Japan
- 13.1.3 India
- 13.1.4 Australia
- 13.1.5 South Korea
- 13.1.6 Rest of Asia Pacific
- 14. Middle East and Africa Medical Connectors Industry Analysis, Insights and Forecast, 2019-2031
- 14.1. Market Analysis, Insights and Forecast - By Country/Sub-region
- 14.1.1 GCC
- 14.1.2 South Africa
- 14.1.3 Rest of Middle East and Africa
- 15. South America Medical Connectors Industry Analysis, Insights and Forecast, 2019-2031
- 15.1. Market Analysis, Insights and Forecast - By Country/Sub-region
- 15.1.1 Brazil
- 15.1.2 Argentina
- 15.1.3 Rest of South America
- 16. Competitive Analysis
- 16.1. Global Market Share Analysis 2024
- 16.2. Company Profiles
- 16.2.1 Fischer Connectors SA
- 16.2.1.1. Overview
- 16.2.1.2. Products
- 16.2.1.3. SWOT Analysis
- 16.2.1.4. Recent Developments
- 16.2.1.5. Financials (Based on Availability)
- 16.2.2 Omnetics Connector Corp
- 16.2.2.1. Overview
- 16.2.2.2. Products
- 16.2.2.3. SWOT Analysis
- 16.2.2.4. Recent Developments
- 16.2.2.5. Financials (Based on Availability)
- 16.2.3 Molex LLC
- 16.2.3.1. Overview
- 16.2.3.2. Products
- 16.2.3.3. SWOT Analysis
- 16.2.3.4. Recent Developments
- 16.2.3.5. Financials (Based on Availability)
- 16.2.4 KEL Corporation
- 16.2.4.1. Overview
- 16.2.4.2. Products
- 16.2.4.3. SWOT Analysis
- 16.2.4.4. Recent Developments
- 16.2.4.5. Financials (Based on Availability)
- 16.2.5 TE Connectivity
- 16.2.5.1. Overview
- 16.2.5.2. Products
- 16.2.5.3. SWOT Analysis
- 16.2.5.4. Recent Developments
- 16.2.5.5. Financials (Based on Availability)
- 16.2.6 Smiths Interconnect
- 16.2.6.1. Overview
- 16.2.6.2. Products
- 16.2.6.3. SWOT Analysis
- 16.2.6.4. Recent Developments
- 16.2.6.5. Financials (Based on Availability)
- 16.2.7 Amphenol Corporation
- 16.2.7.1. Overview
- 16.2.7.2. Products
- 16.2.7.3. SWOT Analysis
- 16.2.7.4. Recent Developments
- 16.2.7.5. Financials (Based on Availability)
- 16.2.8 Souriau
- 16.2.8.1. Overview
- 16.2.8.2. Products
- 16.2.8.3. SWOT Analysis
- 16.2.8.4. Recent Developments
- 16.2.8.5. Financials (Based on Availability)
- 16.2.9 Salter Labs
- 16.2.9.1. Overview
- 16.2.9.2. Products
- 16.2.9.3. SWOT Analysis
- 16.2.9.4. Recent Developments
- 16.2.9.5. Financials (Based on Availability)
- 16.2.10 Shenzhen Xime Connector Technology Co Ltd
- 16.2.10.1. Overview
- 16.2.10.2. Products
- 16.2.10.3. SWOT Analysis
- 16.2.10.4. Recent Developments
- 16.2.10.5. Financials (Based on Availability)
- 16.2.11 Qosina
- 16.2.11.1. Overview
- 16.2.11.2. Products
- 16.2.11.3. SWOT Analysis
- 16.2.11.4. Recent Developments
- 16.2.11.5. Financials (Based on Availability)
- 16.2.12 ITT Interconnect Solutions
- 16.2.12.1. Overview
- 16.2.12.2. Products
- 16.2.12.3. SWOT Analysis
- 16.2.12.4. Recent Developments
- 16.2.12.5. Financials (Based on Availability)
- 16.2.1 Fischer Connectors SA
List of Figures
- Figure 1: Global Medical Connectors Industry Revenue Breakdown (Million, %) by Region 2024 & 2032
- Figure 2: Global Medical Connectors Industry Volume Breakdown (K Unit, %) by Region 2024 & 2032
- Figure 3: North America Medical Connectors Industry Revenue (Million), by Country 2024 & 2032
- Figure 4: North America Medical Connectors Industry Volume (K Unit), by Country 2024 & 2032
- Figure 5: North America Medical Connectors Industry Revenue Share (%), by Country 2024 & 2032
- Figure 6: North America Medical Connectors Industry Volume Share (%), by Country 2024 & 2032
- Figure 7: Europe Medical Connectors Industry Revenue (Million), by Country 2024 & 2032
- Figure 8: Europe Medical Connectors Industry Volume (K Unit), by Country 2024 & 2032
- Figure 9: Europe Medical Connectors Industry Revenue Share (%), by Country 2024 & 2032
- Figure 10: Europe Medical Connectors Industry Volume Share (%), by Country 2024 & 2032
- Figure 11: Asia Pacific Medical Connectors Industry Revenue (Million), by Country 2024 & 2032
- Figure 12: Asia Pacific Medical Connectors Industry Volume (K Unit), by Country 2024 & 2032
- Figure 13: Asia Pacific Medical Connectors Industry Revenue Share (%), by Country 2024 & 2032
- Figure 14: Asia Pacific Medical Connectors Industry Volume Share (%), by Country 2024 & 2032
- Figure 15: Middle East and Africa Medical Connectors Industry Revenue (Million), by Country 2024 & 2032
- Figure 16: Middle East and Africa Medical Connectors Industry Volume (K Unit), by Country 2024 & 2032
- Figure 17: Middle East and Africa Medical Connectors Industry Revenue Share (%), by Country 2024 & 2032
- Figure 18: Middle East and Africa Medical Connectors Industry Volume Share (%), by Country 2024 & 2032
- Figure 19: South America Medical Connectors Industry Revenue (Million), by Country 2024 & 2032
- Figure 20: South America Medical Connectors Industry Volume (K Unit), by Country 2024 & 2032
- Figure 21: South America Medical Connectors Industry Revenue Share (%), by Country 2024 & 2032
- Figure 22: South America Medical Connectors Industry Volume Share (%), by Country 2024 & 2032
- Figure 23: North America Medical Connectors Industry Revenue (Million), by Product 2024 & 2032
- Figure 24: North America Medical Connectors Industry Volume (K Unit), by Product 2024 & 2032
- Figure 25: North America Medical Connectors Industry Revenue Share (%), by Product 2024 & 2032
- Figure 26: North America Medical Connectors Industry Volume Share (%), by Product 2024 & 2032
- Figure 27: North America Medical Connectors Industry Revenue (Million), by Application 2024 & 2032
- Figure 28: North America Medical Connectors Industry Volume (K Unit), by Application 2024 & 2032
- Figure 29: North America Medical Connectors Industry Revenue Share (%), by Application 2024 & 2032
- Figure 30: North America Medical Connectors Industry Volume Share (%), by Application 2024 & 2032
- Figure 31: North America Medical Connectors Industry Revenue (Million), by End User 2024 & 2032
- Figure 32: North America Medical Connectors Industry Volume (K Unit), by End User 2024 & 2032
- Figure 33: North America Medical Connectors Industry Revenue Share (%), by End User 2024 & 2032
- Figure 34: North America Medical Connectors Industry Volume Share (%), by End User 2024 & 2032
- Figure 35: North America Medical Connectors Industry Revenue (Million), by Country 2024 & 2032
- Figure 36: North America Medical Connectors Industry Volume (K Unit), by Country 2024 & 2032
- Figure 37: North America Medical Connectors Industry Revenue Share (%), by Country 2024 & 2032
- Figure 38: North America Medical Connectors Industry Volume Share (%), by Country 2024 & 2032
- Figure 39: Europe Medical Connectors Industry Revenue (Million), by Product 2024 & 2032
- Figure 40: Europe Medical Connectors Industry Volume (K Unit), by Product 2024 & 2032
- Figure 41: Europe Medical Connectors Industry Revenue Share (%), by Product 2024 & 2032
- Figure 42: Europe Medical Connectors Industry Volume Share (%), by Product 2024 & 2032
- Figure 43: Europe Medical Connectors Industry Revenue (Million), by Application 2024 & 2032
- Figure 44: Europe Medical Connectors Industry Volume (K Unit), by Application 2024 & 2032
- Figure 45: Europe Medical Connectors Industry Revenue Share (%), by Application 2024 & 2032
- Figure 46: Europe Medical Connectors Industry Volume Share (%), by Application 2024 & 2032
- Figure 47: Europe Medical Connectors Industry Revenue (Million), by End User 2024 & 2032
- Figure 48: Europe Medical Connectors Industry Volume (K Unit), by End User 2024 & 2032
- Figure 49: Europe Medical Connectors Industry Revenue Share (%), by End User 2024 & 2032
- Figure 50: Europe Medical Connectors Industry Volume Share (%), by End User 2024 & 2032
- Figure 51: Europe Medical Connectors Industry Revenue (Million), by Country 2024 & 2032
- Figure 52: Europe Medical Connectors Industry Volume (K Unit), by Country 2024 & 2032
- Figure 53: Europe Medical Connectors Industry Revenue Share (%), by Country 2024 & 2032
- Figure 54: Europe Medical Connectors Industry Volume Share (%), by Country 2024 & 2032
- Figure 55: Asia Pacific Medical Connectors Industry Revenue (Million), by Product 2024 & 2032
- Figure 56: Asia Pacific Medical Connectors Industry Volume (K Unit), by Product 2024 & 2032
- Figure 57: Asia Pacific Medical Connectors Industry Revenue Share (%), by Product 2024 & 2032
- Figure 58: Asia Pacific Medical Connectors Industry Volume Share (%), by Product 2024 & 2032
- Figure 59: Asia Pacific Medical Connectors Industry Revenue (Million), by Application 2024 & 2032
- Figure 60: Asia Pacific Medical Connectors Industry Volume (K Unit), by Application 2024 & 2032
- Figure 61: Asia Pacific Medical Connectors Industry Revenue Share (%), by Application 2024 & 2032
- Figure 62: Asia Pacific Medical Connectors Industry Volume Share (%), by Application 2024 & 2032
- Figure 63: Asia Pacific Medical Connectors Industry Revenue (Million), by End User 2024 & 2032
- Figure 64: Asia Pacific Medical Connectors Industry Volume (K Unit), by End User 2024 & 2032
- Figure 65: Asia Pacific Medical Connectors Industry Revenue Share (%), by End User 2024 & 2032
- Figure 66: Asia Pacific Medical Connectors Industry Volume Share (%), by End User 2024 & 2032
- Figure 67: Asia Pacific Medical Connectors Industry Revenue (Million), by Country 2024 & 2032
- Figure 68: Asia Pacific Medical Connectors Industry Volume (K Unit), by Country 2024 & 2032
- Figure 69: Asia Pacific Medical Connectors Industry Revenue Share (%), by Country 2024 & 2032
- Figure 70: Asia Pacific Medical Connectors Industry Volume Share (%), by Country 2024 & 2032
- Figure 71: Middle East and Africa Medical Connectors Industry Revenue (Million), by Product 2024 & 2032
- Figure 72: Middle East and Africa Medical Connectors Industry Volume (K Unit), by Product 2024 & 2032
- Figure 73: Middle East and Africa Medical Connectors Industry Revenue Share (%), by Product 2024 & 2032
- Figure 74: Middle East and Africa Medical Connectors Industry Volume Share (%), by Product 2024 & 2032
- Figure 75: Middle East and Africa Medical Connectors Industry Revenue (Million), by Application 2024 & 2032
- Figure 76: Middle East and Africa Medical Connectors Industry Volume (K Unit), by Application 2024 & 2032
- Figure 77: Middle East and Africa Medical Connectors Industry Revenue Share (%), by Application 2024 & 2032
- Figure 78: Middle East and Africa Medical Connectors Industry Volume Share (%), by Application 2024 & 2032
- Figure 79: Middle East and Africa Medical Connectors Industry Revenue (Million), by End User 2024 & 2032
- Figure 80: Middle East and Africa Medical Connectors Industry Volume (K Unit), by End User 2024 & 2032
- Figure 81: Middle East and Africa Medical Connectors Industry Revenue Share (%), by End User 2024 & 2032
- Figure 82: Middle East and Africa Medical Connectors Industry Volume Share (%), by End User 2024 & 2032
- Figure 83: Middle East and Africa Medical Connectors Industry Revenue (Million), by Country 2024 & 2032
- Figure 84: Middle East and Africa Medical Connectors Industry Volume (K Unit), by Country 2024 & 2032
- Figure 85: Middle East and Africa Medical Connectors Industry Revenue Share (%), by Country 2024 & 2032
- Figure 86: Middle East and Africa Medical Connectors Industry Volume Share (%), by Country 2024 & 2032
- Figure 87: South America Medical Connectors Industry Revenue (Million), by Product 2024 & 2032
- Figure 88: South America Medical Connectors Industry Volume (K Unit), by Product 2024 & 2032
- Figure 89: South America Medical Connectors Industry Revenue Share (%), by Product 2024 & 2032
- Figure 90: South America Medical Connectors Industry Volume Share (%), by Product 2024 & 2032
- Figure 91: South America Medical Connectors Industry Revenue (Million), by Application 2024 & 2032
- Figure 92: South America Medical Connectors Industry Volume (K Unit), by Application 2024 & 2032
- Figure 93: South America Medical Connectors Industry Revenue Share (%), by Application 2024 & 2032
- Figure 94: South America Medical Connectors Industry Volume Share (%), by Application 2024 & 2032
- Figure 95: South America Medical Connectors Industry Revenue (Million), by End User 2024 & 2032
- Figure 96: South America Medical Connectors Industry Volume (K Unit), by End User 2024 & 2032
- Figure 97: South America Medical Connectors Industry Revenue Share (%), by End User 2024 & 2032
- Figure 98: South America Medical Connectors Industry Volume Share (%), by End User 2024 & 2032
- Figure 99: South America Medical Connectors Industry Revenue (Million), by Country 2024 & 2032
- Figure 100: South America Medical Connectors Industry Volume (K Unit), by Country 2024 & 2032
- Figure 101: South America Medical Connectors Industry Revenue Share (%), by Country 2024 & 2032
- Figure 102: South America Medical Connectors Industry Volume Share (%), by Country 2024 & 2032
List of Tables
- Table 1: Global Medical Connectors Industry Revenue Million Forecast, by Region 2019 & 2032
- Table 2: Global Medical Connectors Industry Volume K Unit Forecast, by Region 2019 & 2032
- Table 3: Global Medical Connectors Industry Revenue Million Forecast, by Product 2019 & 2032
- Table 4: Global Medical Connectors Industry Volume K Unit Forecast, by Product 2019 & 2032
- Table 5: Global Medical Connectors Industry Revenue Million Forecast, by Application 2019 & 2032
- Table 6: Global Medical Connectors Industry Volume K Unit Forecast, by Application 2019 & 2032
- Table 7: Global Medical Connectors Industry Revenue Million Forecast, by End User 2019 & 2032
- Table 8: Global Medical Connectors Industry Volume K Unit Forecast, by End User 2019 & 2032
- Table 9: Global Medical Connectors Industry Revenue Million Forecast, by Region 2019 & 2032
- Table 10: Global Medical Connectors Industry Volume K Unit Forecast, by Region 2019 & 2032
- Table 11: Global Medical Connectors Industry Revenue Million Forecast, by Country 2019 & 2032
- Table 12: Global Medical Connectors Industry Volume K Unit Forecast, by Country 2019 & 2032
- Table 13: United States Medical Connectors Industry Revenue (Million) Forecast, by Application 2019 & 2032
- Table 14: United States Medical Connectors Industry Volume (K Unit) Forecast, by Application 2019 & 2032
- Table 15: Canada Medical Connectors Industry Revenue (Million) Forecast, by Application 2019 & 2032
- Table 16: Canada Medical Connectors Industry Volume (K Unit) Forecast, by Application 2019 & 2032
- Table 17: Mexico Medical Connectors Industry Revenue (Million) Forecast, by Application 2019 & 2032
- Table 18: Mexico Medical Connectors Industry Volume (K Unit) Forecast, by Application 2019 & 2032
- Table 19: Global Medical Connectors Industry Revenue Million Forecast, by Country 2019 & 2032
- Table 20: Global Medical Connectors Industry Volume K Unit Forecast, by Country 2019 & 2032
- Table 21: Germany Medical Connectors Industry Revenue (Million) Forecast, by Application 2019 & 2032
- Table 22: Germany Medical Connectors Industry Volume (K Unit) Forecast, by Application 2019 & 2032
- Table 23: United Kingdom Medical Connectors Industry Revenue (Million) Forecast, by Application 2019 & 2032
- Table 24: United Kingdom Medical Connectors Industry Volume (K Unit) Forecast, by Application 2019 & 2032
- Table 25: France Medical Connectors Industry Revenue (Million) Forecast, by Application 2019 & 2032
- Table 26: France Medical Connectors Industry Volume (K Unit) Forecast, by Application 2019 & 2032
- Table 27: Italy Medical Connectors Industry Revenue (Million) Forecast, by Application 2019 & 2032
- Table 28: Italy Medical Connectors Industry Volume (K Unit) Forecast, by Application 2019 & 2032
- Table 29: Spain Medical Connectors Industry Revenue (Million) Forecast, by Application 2019 & 2032
- Table 30: Spain Medical Connectors Industry Volume (K Unit) Forecast, by Application 2019 & 2032
- Table 31: Rest of Europe Medical Connectors Industry Revenue (Million) Forecast, by Application 2019 & 2032
- Table 32: Rest of Europe Medical Connectors Industry Volume (K Unit) Forecast, by Application 2019 & 2032
- Table 33: Global Medical Connectors Industry Revenue Million Forecast, by Country 2019 & 2032
- Table 34: Global Medical Connectors Industry Volume K Unit Forecast, by Country 2019 & 2032
- Table 35: China Medical Connectors Industry Revenue (Million) Forecast, by Application 2019 & 2032
- Table 36: China Medical Connectors Industry Volume (K Unit) Forecast, by Application 2019 & 2032
- Table 37: Japan Medical Connectors Industry Revenue (Million) Forecast, by Application 2019 & 2032
- Table 38: Japan Medical Connectors Industry Volume (K Unit) Forecast, by Application 2019 & 2032
- Table 39: India Medical Connectors Industry Revenue (Million) Forecast, by Application 2019 & 2032
- Table 40: India Medical Connectors Industry Volume (K Unit) Forecast, by Application 2019 & 2032
- Table 41: Australia Medical Connectors Industry Revenue (Million) Forecast, by Application 2019 & 2032
- Table 42: Australia Medical Connectors Industry Volume (K Unit) Forecast, by Application 2019 & 2032
- Table 43: South Korea Medical Connectors Industry Revenue (Million) Forecast, by Application 2019 & 2032
- Table 44: South Korea Medical Connectors Industry Volume (K Unit) Forecast, by Application 2019 & 2032
- Table 45: Rest of Asia Pacific Medical Connectors Industry Revenue (Million) Forecast, by Application 2019 & 2032
- Table 46: Rest of Asia Pacific Medical Connectors Industry Volume (K Unit) Forecast, by Application 2019 & 2032
- Table 47: Global Medical Connectors Industry Revenue Million Forecast, by Country 2019 & 2032
- Table 48: Global Medical Connectors Industry Volume K Unit Forecast, by Country 2019 & 2032
- Table 49: GCC Medical Connectors Industry Revenue (Million) Forecast, by Application 2019 & 2032
- Table 50: GCC Medical Connectors Industry Volume (K Unit) Forecast, by Application 2019 & 2032
- Table 51: South Africa Medical Connectors Industry Revenue (Million) Forecast, by Application 2019 & 2032
- Table 52: South Africa Medical Connectors Industry Volume (K Unit) Forecast, by Application 2019 & 2032
- Table 53: Rest of Middle East and Africa Medical Connectors Industry Revenue (Million) Forecast, by Application 2019 & 2032
- Table 54: Rest of Middle East and Africa Medical Connectors Industry Volume (K Unit) Forecast, by Application 2019 & 2032
- Table 55: Global Medical Connectors Industry Revenue Million Forecast, by Country 2019 & 2032
- Table 56: Global Medical Connectors Industry Volume K Unit Forecast, by Country 2019 & 2032
- Table 57: Brazil Medical Connectors Industry Revenue (Million) Forecast, by Application 2019 & 2032
- Table 58: Brazil Medical Connectors Industry Volume (K Unit) Forecast, by Application 2019 & 2032
- Table 59: Argentina Medical Connectors Industry Revenue (Million) Forecast, by Application 2019 & 2032
- Table 60: Argentina Medical Connectors Industry Volume (K Unit) Forecast, by Application 2019 & 2032
- Table 61: Rest of South America Medical Connectors Industry Revenue (Million) Forecast, by Application 2019 & 2032
- Table 62: Rest of South America Medical Connectors Industry Volume (K Unit) Forecast, by Application 2019 & 2032
- Table 63: Global Medical Connectors Industry Revenue Million Forecast, by Product 2019 & 2032
- Table 64: Global Medical Connectors Industry Volume K Unit Forecast, by Product 2019 & 2032
- Table 65: Global Medical Connectors Industry Revenue Million Forecast, by Application 2019 & 2032
- Table 66: Global Medical Connectors Industry Volume K Unit Forecast, by Application 2019 & 2032
- Table 67: Global Medical Connectors Industry Revenue Million Forecast, by End User 2019 & 2032
- Table 68: Global Medical Connectors Industry Volume K Unit Forecast, by End User 2019 & 2032
- Table 69: Global Medical Connectors Industry Revenue Million Forecast, by Country 2019 & 2032
- Table 70: Global Medical Connectors Industry Volume K Unit Forecast, by Country 2019 & 2032
- Table 71: United States Medical Connectors Industry Revenue (Million) Forecast, by Application 2019 & 2032
- Table 72: United States Medical Connectors Industry Volume (K Unit) Forecast, by Application 2019 & 2032
- Table 73: Canada Medical Connectors Industry Revenue (Million) Forecast, by Application 2019 & 2032
- Table 74: Canada Medical Connectors Industry Volume (K Unit) Forecast, by Application 2019 & 2032
- Table 75: Mexico Medical Connectors Industry Revenue (Million) Forecast, by Application 2019 & 2032
- Table 76: Mexico Medical Connectors Industry Volume (K Unit) Forecast, by Application 2019 & 2032
- Table 77: Global Medical Connectors Industry Revenue Million Forecast, by Product 2019 & 2032
- Table 78: Global Medical Connectors Industry Volume K Unit Forecast, by Product 2019 & 2032
- Table 79: Global Medical Connectors Industry Revenue Million Forecast, by Application 2019 & 2032
- Table 80: Global Medical Connectors Industry Volume K Unit Forecast, by Application 2019 & 2032
- Table 81: Global Medical Connectors Industry Revenue Million Forecast, by End User 2019 & 2032
- Table 82: Global Medical Connectors Industry Volume K Unit Forecast, by End User 2019 & 2032
- Table 83: Global Medical Connectors Industry Revenue Million Forecast, by Country 2019 & 2032
- Table 84: Global Medical Connectors Industry Volume K Unit Forecast, by Country 2019 & 2032
- Table 85: Germany Medical Connectors Industry Revenue (Million) Forecast, by Application 2019 & 2032
- Table 86: Germany Medical Connectors Industry Volume (K Unit) Forecast, by Application 2019 & 2032
- Table 87: United Kingdom Medical Connectors Industry Revenue (Million) Forecast, by Application 2019 & 2032
- Table 88: United Kingdom Medical Connectors Industry Volume (K Unit) Forecast, by Application 2019 & 2032
- Table 89: France Medical Connectors Industry Revenue (Million) Forecast, by Application 2019 & 2032
- Table 90: France Medical Connectors Industry Volume (K Unit) Forecast, by Application 2019 & 2032
- Table 91: Italy Medical Connectors Industry Revenue (Million) Forecast, by Application 2019 & 2032
- Table 92: Italy Medical Connectors Industry Volume (K Unit) Forecast, by Application 2019 & 2032
- Table 93: Spain Medical Connectors Industry Revenue (Million) Forecast, by Application 2019 & 2032
- Table 94: Spain Medical Connectors Industry Volume (K Unit) Forecast, by Application 2019 & 2032
- Table 95: Rest of Europe Medical Connectors Industry Revenue (Million) Forecast, by Application 2019 & 2032
- Table 96: Rest of Europe Medical Connectors Industry Volume (K Unit) Forecast, by Application 2019 & 2032
- Table 97: Global Medical Connectors Industry Revenue Million Forecast, by Product 2019 & 2032
- Table 98: Global Medical Connectors Industry Volume K Unit Forecast, by Product 2019 & 2032
- Table 99: Global Medical Connectors Industry Revenue Million Forecast, by Application 2019 & 2032
- Table 100: Global Medical Connectors Industry Volume K Unit Forecast, by Application 2019 & 2032
- Table 101: Global Medical Connectors Industry Revenue Million Forecast, by End User 2019 & 2032
- Table 102: Global Medical Connectors Industry Volume K Unit Forecast, by End User 2019 & 2032
- Table 103: Global Medical Connectors Industry Revenue Million Forecast, by Country 2019 & 2032
- Table 104: Global Medical Connectors Industry Volume K Unit Forecast, by Country 2019 & 2032
- Table 105: China Medical Connectors Industry Revenue (Million) Forecast, by Application 2019 & 2032
- Table 106: China Medical Connectors Industry Volume (K Unit) Forecast, by Application 2019 & 2032
- Table 107: Japan Medical Connectors Industry Revenue (Million) Forecast, by Application 2019 & 2032
- Table 108: Japan Medical Connectors Industry Volume (K Unit) Forecast, by Application 2019 & 2032
- Table 109: India Medical Connectors Industry Revenue (Million) Forecast, by Application 2019 & 2032
- Table 110: India Medical Connectors Industry Volume (K Unit) Forecast, by Application 2019 & 2032
- Table 111: Australia Medical Connectors Industry Revenue (Million) Forecast, by Application 2019 & 2032
- Table 112: Australia Medical Connectors Industry Volume (K Unit) Forecast, by Application 2019 & 2032
- Table 113: South Korea Medical Connectors Industry Revenue (Million) Forecast, by Application 2019 & 2032
- Table 114: South Korea Medical Connectors Industry Volume (K Unit) Forecast, by Application 2019 & 2032
- Table 115: Rest of Asia Pacific Medical Connectors Industry Revenue (Million) Forecast, by Application 2019 & 2032
- Table 116: Rest of Asia Pacific Medical Connectors Industry Volume (K Unit) Forecast, by Application 2019 & 2032
- Table 117: Global Medical Connectors Industry Revenue Million Forecast, by Product 2019 & 2032
- Table 118: Global Medical Connectors Industry Volume K Unit Forecast, by Product 2019 & 2032
- Table 119: Global Medical Connectors Industry Revenue Million Forecast, by Application 2019 & 2032
- Table 120: Global Medical Connectors Industry Volume K Unit Forecast, by Application 2019 & 2032
- Table 121: Global Medical Connectors Industry Revenue Million Forecast, by End User 2019 & 2032
- Table 122: Global Medical Connectors Industry Volume K Unit Forecast, by End User 2019 & 2032
- Table 123: Global Medical Connectors Industry Revenue Million Forecast, by Country 2019 & 2032
- Table 124: Global Medical Connectors Industry Volume K Unit Forecast, by Country 2019 & 2032
- Table 125: GCC Medical Connectors Industry Revenue (Million) Forecast, by Application 2019 & 2032
- Table 126: GCC Medical Connectors Industry Volume (K Unit) Forecast, by Application 2019 & 2032
- Table 127: South Africa Medical Connectors Industry Revenue (Million) Forecast, by Application 2019 & 2032
- Table 128: South Africa Medical Connectors Industry Volume (K Unit) Forecast, by Application 2019 & 2032
- Table 129: Rest of Middle East and Africa Medical Connectors Industry Revenue (Million) Forecast, by Application 2019 & 2032
- Table 130: Rest of Middle East and Africa Medical Connectors Industry Volume (K Unit) Forecast, by Application 2019 & 2032
- Table 131: Global Medical Connectors Industry Revenue Million Forecast, by Product 2019 & 2032
- Table 132: Global Medical Connectors Industry Volume K Unit Forecast, by Product 2019 & 2032
- Table 133: Global Medical Connectors Industry Revenue Million Forecast, by Application 2019 & 2032
- Table 134: Global Medical Connectors Industry Volume K Unit Forecast, by Application 2019 & 2032
- Table 135: Global Medical Connectors Industry Revenue Million Forecast, by End User 2019 & 2032
- Table 136: Global Medical Connectors Industry Volume K Unit Forecast, by End User 2019 & 2032
- Table 137: Global Medical Connectors Industry Revenue Million Forecast, by Country 2019 & 2032
- Table 138: Global Medical Connectors Industry Volume K Unit Forecast, by Country 2019 & 2032
- Table 139: Brazil Medical Connectors Industry Revenue (Million) Forecast, by Application 2019 & 2032
- Table 140: Brazil Medical Connectors Industry Volume (K Unit) Forecast, by Application 2019 & 2032
- Table 141: Argentina Medical Connectors Industry Revenue (Million) Forecast, by Application 2019 & 2032
- Table 142: Argentina Medical Connectors Industry Volume (K Unit) Forecast, by Application 2019 & 2032
- Table 143: Rest of South America Medical Connectors Industry Revenue (Million) Forecast, by Application 2019 & 2032
- Table 144: Rest of South America Medical Connectors Industry Volume (K Unit) Forecast, by Application 2019 & 2032
Frequently Asked Questions
1. What is the projected Compound Annual Growth Rate (CAGR) of the Medical Connectors Industry?
The projected CAGR is approximately 10.30%.
2. Which companies are prominent players in the Medical Connectors Industry?
Key companies in the market include Fischer Connectors SA, Omnetics Connector Corp, Molex LLC, KEL Corporation, TE Connectivity, Smiths Interconnect, Amphenol Corporation, Souriau, Salter Labs, Shenzhen Xime Connector Technology Co Ltd, Qosina, ITT Interconnect Solutions.
3. What are the main segments of the Medical Connectors Industry?
The market segments include Product, Application, End User.
4. Can you provide details about the market size?
The market size is estimated to be USD XX Million as of 2022.
5. What are some drivers contributing to market growth?
Rising Incidence of Chronic Diseases; Rising Medical Device Market.
6. What are the notable trends driving market growth?
Patient Monitoring Segment is Expected to Hold the Large Share in the Market Studied During the Forecast Period.
7. Are there any restraints impacting market growth?
Stringent Regulatory Standars.
8. Can you provide examples of recent developments in the market?
August 2022: TE Connectivity Corporation, United States, launched a EUR 5 million rapid prototyping center for medical devices at its existing manufacturing facility in Galway.
9. What pricing options are available for accessing the report?
Pricing options include single-user, multi-user, and enterprise licenses priced at USD 4750, USD 5250, and USD 8750 respectively.
10. Is the market size provided in terms of value or volume?
The market size is provided in terms of value, measured in Million and volume, measured in K Unit.
11. Are there any specific market keywords associated with the report?
Yes, the market keyword associated with the report is "Medical Connectors Industry," which aids in identifying and referencing the specific market segment covered.
12. How do I determine which pricing option suits my needs best?
The pricing options vary based on user requirements and access needs. Individual users may opt for single-user licenses, while businesses requiring broader access may choose multi-user or enterprise licenses for cost-effective access to the report.
13. Are there any additional resources or data provided in the Medical Connectors Industry report?
While the report offers comprehensive insights, it's advisable to review the specific contents or supplementary materials provided to ascertain if additional resources or data are available.
14. How can I stay updated on further developments or reports in the Medical Connectors Industry?
To stay informed about further developments, trends, and reports in the Medical Connectors Industry, consider subscribing to industry newsletters, following relevant companies and organizations, or regularly checking reputable industry news sources and publications.
Methodology
Step 1 - Identification of Relevant Samples Size from Population Database


Step 2 - Approaches for Defining Global Market Size (Value, Volume* & Price*)

Note*: In applicable scenarios
Step 3 - Data Sources
Primary Research
- Web Analytics
- Survey Reports
- Research Institute
- Latest Research Reports
- Opinion Leaders
Secondary Research
- Annual Reports
- White Paper
- Latest Press Release
- Industry Association
- Paid Database
- Investor Presentations

Step 4 - Data Triangulation
Involves using different sources of information in order to increase the validity of a study
These sources are likely to be stakeholders in a program - participants, other researchers, program staff, other community members, and so on.
Then we put all data in single framework & apply various statistical tools to find out the dynamic on the market.
During the analysis stage, feedback from the stakeholder groups would be compared to determine areas of agreement as well as areas of divergence
