

Key Insights
The global Cone Beam Computed Tomography (CBCT) market is experiencing robust expansion, projected to reach a significant market size in 2025 and grow at a Compound Annual Growth Rate (CAGR) of 9.90% through 2033. This growth is primarily fueled by the increasing prevalence of dental and craniofacial disorders, coupled with the escalating adoption of advanced imaging technologies in dentistry. The superior diagnostic accuracy and reduced radiation exposure compared to conventional CT scanners are major drivers propelling the demand for CBCT systems. Furthermore, technological advancements leading to enhanced image resolution, faster scan times, and integrated software solutions are making CBCT more accessible and indispensable for a wide range of dental applications, including orthodontics, endodontics, periodontics, and general dentistry. The expanding patient pool seeking advanced dental treatments and the growing awareness among dental professionals about the benefits of CBCT are further contributing to market buoyancy.
The market segmentation reveals a strong focus on dental applications, underscoring the critical role of CBCT in modern dental diagnostics and treatment planning. The Supine Position segment is anticipated to witness considerable growth due to its suitability for complex procedures and patient comfort during extended imaging sessions. Key end-users, including hospitals and specialized imaging centers, are increasingly investing in CBCT technology to offer comprehensive diagnostic services. Geographically, North America and Europe are leading markets, driven by high healthcare expenditure and a well-established infrastructure for adopting advanced medical devices. However, the Asia Pacific region is expected to emerge as a high-growth market due to rapid technological adoption, a rising middle class, and increasing awareness of advanced dental care. Despite the positive outlook, challenges such as the high initial cost of CBCT systems and the need for specialized training for operators can pose some restraints to market penetration in certain developing economies, though the long-term trend points towards widespread adoption.
Cone Beam Computed Tomography Industry Market Report: Analysis and Forecast (2019-2033)
Unlock comprehensive insights into the global Cone Beam Computed Tomography (CBCT) market with our in-depth report. Covering the study period from 2019 to 2033, with a base year of 2025 and a detailed forecast from 2025 to 2033, this report provides critical data and strategic analysis for industry stakeholders. Discover market dynamics, key trends, leading players, and future opportunities in the rapidly evolving CBCT landscape. This report is designed for immediate use, requiring no further modification, and incorporates essential industry developments.
Cone Beam Computed Tomography Industry Market Concentration & Dynamics
The Cone Beam Computed Tomography (CBCT) market exhibits a moderately concentrated landscape, characterized by a blend of established global manufacturers and specialized innovators. Key players like Vatech America, Dentsply Sirona, and Planmeca Group command significant market share through extensive product portfolios and robust distribution networks. The innovation ecosystem is vibrant, driven by continuous advancements in imaging resolution, software capabilities, and integrated workflow solutions. Regulatory frameworks, particularly those governing medical device approvals and data privacy, play a crucial role in market access and product development. While direct substitute products are limited within advanced diagnostic imaging, the rising adoption of AI-powered diagnostic tools and alternative imaging modalities presents a competitive pressure. End-user trends are leaning towards increased demand for minimally invasive diagnostics and integrated treatment planning. Mergers and acquisition (M&A) activities, while not pervasive, are strategic, aimed at consolidating market presence, acquiring novel technologies, or expanding geographical reach. For instance, the acquisition of smaller technology firms by larger corporations often fuels innovation.
Cone Beam Computed Tomography Industry Industry Insights & Trends
The global Cone Beam Computed Tomography (CBCT) market is poised for substantial growth, driven by escalating demand for advanced diagnostic imaging solutions across various medical specialties, primarily dentistry. The market size was valued at approximately $1.5 Billion in 2025 and is projected to reach $3.8 Billion by 2033, exhibiting a robust Compound Annual Growth Rate (CAGR) of 12.5% during the forecast period (2025-2033). This expansion is fueled by several converging factors. Technological advancements are at the forefront, with manufacturers consistently introducing CBCT systems featuring higher resolution, reduced radiation exposure, faster scan times, and enhanced imaging software for precise diagnosis and treatment planning. The integration of Artificial Intelligence (AI) for image analysis and anomaly detection is further revolutionizing the field, offering improved diagnostic accuracy and workflow efficiency.
A significant driver for market growth is the increasing prevalence of dental and craniofacial disorders globally. Conditions like malocclusion, impacted teeth, temporomandibular joint (TMJ) disorders, and oral cancers necessitate sophisticated imaging techniques that CBCT systems provide. In dentistry, applications span orthodontics, endodontics, periodontics, implantology, and maxillofacial surgery, where CBCT offers detailed 3D visualization that conventional radiography cannot match. The growing emphasis on preventive healthcare and early disease detection also contributes to the uptake of CBCT technology.
Furthermore, evolving consumer behaviors, particularly a rising awareness among patients regarding advanced treatment options and a preference for minimally invasive procedures, encourage dentists and other healthcare providers to invest in cutting-edge imaging equipment. The increasing affordability of CBCT systems, coupled with favorable reimbursement policies in certain regions for specific diagnostic procedures, also plays a vital role in expanding market access, especially for smaller clinics and imaging centers.
The market is also witnessing a geographical shift, with emerging economies showing accelerated adoption rates due to improving healthcare infrastructure, increasing disposable incomes, and a growing number of trained healthcare professionals. The expanding scope of CBCT applications beyond dentistry, into fields like ENT (Ear, Nose, and Throat) and veterinary medicine, is another key trend contributing to market diversification and overall growth. The industry is witnessing a sustained trend of technological innovation, focusing on miniaturization of equipment, enhanced portability, and improved patient comfort during scanning. This continuous evolution ensures the CBCT market remains dynamic and responsive to the evolving needs of the healthcare sector.
Key Markets & Segments Leading Cone Beam Computed Tomography Industry
The Cone Beam Computed Tomography (CBCT) market is dominated by Dental Applications, which represent the largest segment due to the inherent precision and detailed visualization CBCT offers for oral and maxillofacial structures. This segment is further segmented into:
- Orthodontics: CBCT plays a crucial role in diagnosing and planning treatments for malocclusion, impacted teeth, and craniofacial abnormalities. Its ability to provide precise 3D measurements and positional data of teeth and jaws is indispensable for orthodontists, leading to personalized treatment plans and improved outcomes. The growing demand for aesthetic orthodontic treatments, such as clear aligners which often benefit from detailed 3D planning, further fuels this sub-segment's growth. Economic growth in developed and developing nations translates to increased discretionary spending on orthodontic care, making it a significant driver.
- Endodontics: CBCT's exceptional resolution allows endodontists to accurately visualize root canal anatomy, detect calcifications, and identify missed canals or periapical lesions. This capability is critical for successful root canal treatments and retreatment. The research study published in April 2022, highlighting CBCT's efficacy in analyzing root canal thickness, underscores its growing importance in this field.
- Periodontics: For periodontists, CBCT provides detailed insights into bone loss, furcation involvement, and the relationship of teeth to adjacent structures, aiding in the diagnosis and management of periodontal disease. Its ability to assess the extent of bone defects allows for more precise surgical planning.
- General Dentistry: General dentists increasingly utilize CBCT for pre-implant assessment, surgical guide fabrication, evaluation of impacted wisdom teeth, and diagnosis of various oral pathologies. The expanding range of diagnostic applications makes it an essential tool for comprehensive dental care.
- Others (Dental Applications): This includes applications in prosthodontics for crown and bridge planning, temporomandibular joint (TMJ) disorder diagnosis, and oral surgery.
Beyond dental applications, Other Applications encompassing ENT imaging and veterinary medicine are also gaining traction, albeit from a smaller base.
In terms of Patient Position, the Standing/Seated Position segment is the most dominant. This is primarily due to the widespread use of CBCT in dental clinics and imaging centers, where standing or seated patient positions are more practical and comfortable for routine dental scans. These systems are often designed for ease of access and quick scanning procedures. While Supine Position CBCT systems exist and are crucial for certain medical applications, their prevalence in the overall CBCT market is lower compared to standing/seated dental CBCT units.
The End User landscape is led by Imaging Centers and Hospitals, which invest heavily in advanced diagnostic equipment for a broad range of patient needs. Dental clinics are also significant end-users, particularly with the increasing adoption of in-office CBCT units.
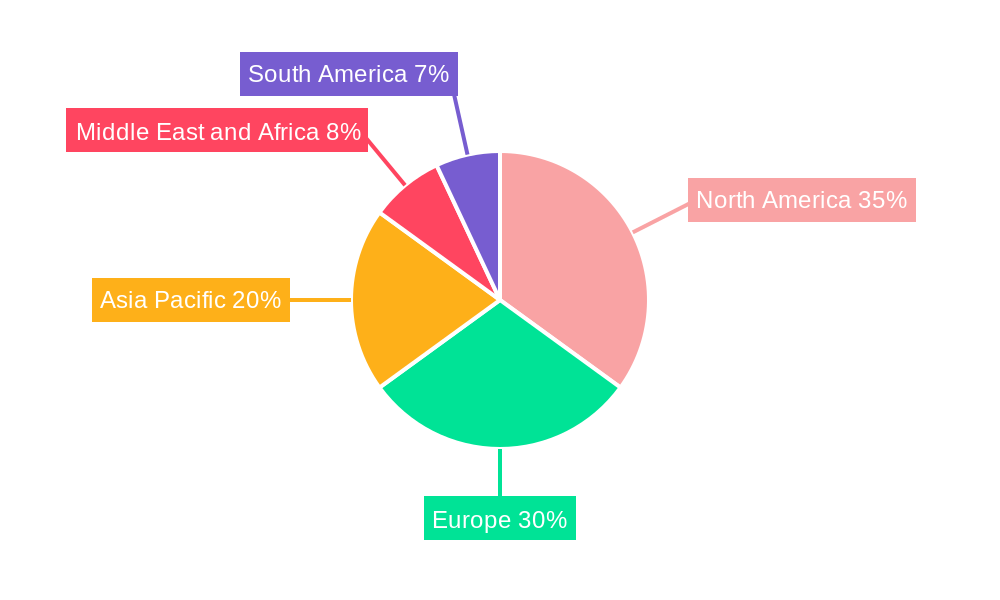
Geographically, North America and Europe currently hold the largest market share due to well-established healthcare infrastructure, high disposable incomes, and early adoption of advanced medical technologies. However, the Asia Pacific region is witnessing the fastest growth, driven by increasing healthcare expenditure, a burgeoning middle class, and a growing demand for advanced dental and medical imaging services. Government initiatives promoting healthcare access and technological adoption in countries like China and India are significant drivers for this regional growth.
Cone Beam Computed Tomography Industry Product Developments
The Cone Beam Computed Tomography (CBCT) market is characterized by continuous product innovation focused on enhancing image quality, reducing radiation dose, and improving user experience. Key developments include the introduction of AI-powered software for automated image analysis, artifact reduction technologies, and integrated workflow solutions that streamline diagnostic processes. Manufacturers are also focusing on miniaturization and portability, enabling easier integration into diverse clinical settings. For instance, the patent received by Xoran Technologies in June 2022 for a modular cone beam computed tomography (CT) system assembly highlights innovation in system design for greater adaptability and efficiency. These advancements aim to improve diagnostic accuracy, patient comfort, and procedural efficiency, thereby strengthening the competitive edge of CBCT technology in healthcare diagnostics.
Challenges in the Cone Beam Computed Tomography Industry Market
Despite its growth trajectory, the Cone Beam Computed Tomography industry faces several challenges. High initial acquisition costs for advanced CBCT systems can be a significant barrier for smaller clinics and healthcare facilities, especially in emerging economies. Stringent regulatory approvals for medical devices, though necessary for patient safety, can lead to prolonged time-to-market for new technologies. Furthermore, the availability of skilled personnel trained in operating and interpreting CBCT scans remains a concern in certain regions. Competitive pressures from alternative imaging modalities and the need for continuous software updates and maintenance also add to the operational challenges. For example, ensuring compliance with evolving radiation safety standards globally requires ongoing investment and expertise.
Forces Driving Cone Beam Computed Tomography Industry Growth
The growth of the Cone Beam Computed Tomography industry is propelled by several key forces. Technological advancements, including improved imaging resolution, reduced radiation exposure, and AI-driven software, are enhancing diagnostic capabilities. The increasing prevalence of dental and craniofacial conditions worldwide necessitates sophisticated diagnostic tools like CBCT. Furthermore, a growing patient awareness and preference for minimally invasive procedures and personalized treatment plans are driving demand. Favorable reimbursement policies in some regions and expanding applications beyond dentistry, such as in ENT and veterinary medicine, also contribute significantly to market expansion.
Challenges in the Cone Beam Computed Tomography Industry Market
Long-term growth catalysts for the Cone Beam Computed Tomography market are deeply rooted in continuous innovation and strategic market expansion. The ongoing development of more sophisticated AI algorithms for image analysis, predictive diagnostics, and treatment planning will further solidify CBCT's indispensable role. Collaborations between CBCT manufacturers, software developers, and academic institutions will accelerate the integration of cutting-edge technologies and validate new clinical applications. Moreover, strategic partnerships and distribution agreements aimed at penetrating underserved markets and expanding the global reach of CBCT systems will be crucial. The increasing focus on interoperability with other healthcare IT systems and the development of portable and cost-effective CBCT solutions will also unlock significant growth potential.
Emerging Opportunities in Cone Beam Computed Tomography Industry
Emerging opportunities in the Cone Beam Computed Tomography industry are abundant, driven by technological convergence and evolving healthcare needs. The integration of CBCT with virtual reality (VR) and augmented reality (AR) technologies presents a significant opportunity for enhanced surgical planning and patient education. The expansion of CBCT applications in fields like sleep apnea diagnosis, headache analysis, and orthopedic imaging offers new market avenues. Furthermore, the growing demand for teledentistry and remote diagnostics creates opportunities for networked CBCT solutions. The development of more compact and affordable CBCT units specifically for smaller dental practices and even mobile clinics will democratize access to advanced imaging technology, opening up vast untapped markets globally.
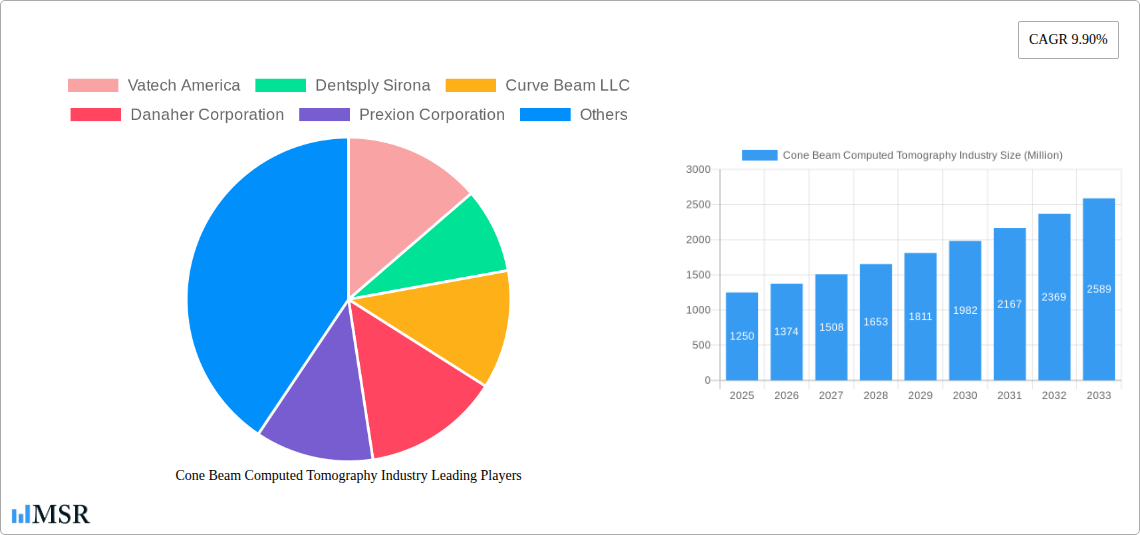
Leading Players in the Cone Beam Computed Tomography Industry Sector
- Vatech America
- Dentsply Sirona
- Curve Beam LLC
- Danaher Corporation
- Prexion Corporation
- Carestream Health Inc
- Planmeca Group
- Asahi RoEntgen Ind Co Ltd
- J Morita Mfg Corp
- Cefla S C
Key Milestones in Cone Beam Computed Tomography Industry Industry
- June 2022: Xoran Technologies received a patent for a modular cone beam computed tomography (CT) system assembly, indicating innovation in system design for greater adaptability.
- April 2022: A research study published titled "Root canal length estimated by cone-beam computed tomography at different slice thicknesses, dedicated endodontic software, or measured by an electronic apex locator" stated that cone-beam computed tomography can be used to analyse the thickness of the root canal, reinforcing its clinical utility in endodontics.
Strategic Outlook for Cone Beam Computed Tomography Industry Market
The strategic outlook for the Cone Beam Computed Tomography industry is exceptionally positive, fueled by a confluence of technological innovation, expanding clinical applications, and growing global demand for advanced diagnostic imaging. Future market potential lies in the seamless integration of AI for predictive analytics and automated diagnostics, further enhancing the precision and efficiency of CBCT. Strategic opportunities abound in developing specialized CBCT solutions for niche medical fields beyond dentistry, such as ENT, neurology, and veterinary medicine. Furthermore, fostering strategic partnerships with healthcare providers and technology developers will accelerate the adoption of novel imaging techniques and software. The development of more cost-effective and user-friendly CBCT systems will be crucial for unlocking growth in emerging markets, making advanced diagnostics accessible to a wider population and solidifying CBCT's indispensable role in modern healthcare.
Cone Beam Computed Tomography Industry Segmentation
-
1. Application
-
1.1. Dental Applications
- 1.1.1. Orthodontics
- 1.1.2. Endodontics
- 1.1.3. Periodontics
- 1.1.4. General Dentistry
- 1.1.5. Others
- 1.2. Other Applications
-
1.1. Dental Applications
-
2. Patient Position
- 2.1. Standing/Seated Position
- 2.2. Supine Position
-
3. End User
- 3.1. Hospitals
- 3.2. Imaging Centers
- 3.3. Others
Cone Beam Computed Tomography Industry Segmentation By Geography
-
1. North America
- 1.1. United States
- 1.2. Canada
- 1.3. Mexico
-
2. Europe
- 2.1. Germany
- 2.2. United Kingdom
- 2.3. France
- 2.4. Italy
- 2.5. Spain
- 2.6. Rest of Europe
-
3. Asia Pacific
- 3.1. China
- 3.2. Japan
- 3.3. India
- 3.4. Australia
- 3.5. South Korea
- 3.6. Rest of Asia Pacific
-
4. Middle East and Africa
- 4.1. GCC
- 4.2. South Africa
- 4.3. Rest of Middle East and Africa
-
5. South America
- 5.1. Brazil
- 5.2. Argentina
- 5.3. Rest of South America
Cone Beam Computed Tomography Industry REPORT HIGHLIGHTS
| Aspects | Details |
|---|---|
| Study Period | 2019-2033 |
| Base Year | 2024 |
| Estimated Year | 2025 |
| Forecast Period | 2025-2033 |
| Historical Period | 2019-2024 |
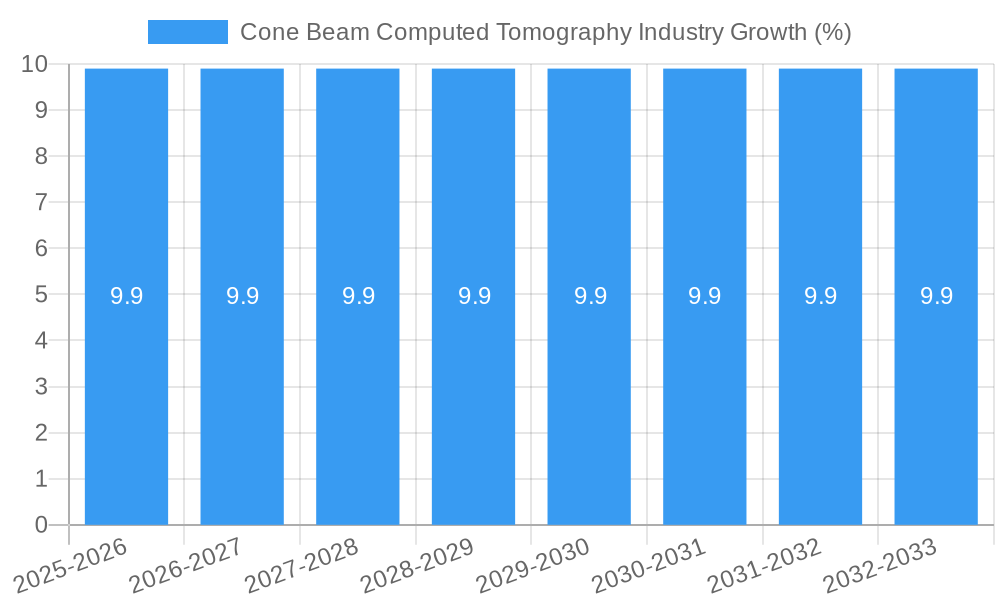
| Growth Rate | CAGR of 9.90% from 2019-2033 |
| Segmentation |
|
Table of Contents
- 1. Introduction
- 1.1. Research Scope
- 1.2. Market Segmentation
- 1.3. Research Methodology
- 1.4. Definitions and Assumptions
- 2. Executive Summary
- 2.1. Introduction
- 3. Market Dynamics
- 3.1. Introduction
- 3.2. Market Drivers
- 3.2.1. Increasing Cases of Dental Disorders; Advancements in Technology; Expanding Application Areas of CBCT Systems
- 3.3. Market Restrains
- 3.3.1. High Cost of CBCT Systems; Imaging Issues
- 3.4. Market Trends
- 3.4.1. Periodontal Applications is Expected to Dominate the Cone Beam Computed Tomography (CBCT) Market During the Forecast Period
- 4. Market Factor Analysis
- 4.1. Porters Five Forces
- 4.2. Supply/Value Chain
- 4.3. PESTEL analysis
- 4.4. Market Entropy
- 4.5. Patent/Trademark Analysis
- 5. Global Cone Beam Computed Tomography Industry Analysis, Insights and Forecast, 2019-2031
- 5.1. Market Analysis, Insights and Forecast - by Application
- 5.1.1. Dental Applications
- 5.1.1.1. Orthodontics
- 5.1.1.2. Endodontics
- 5.1.1.3. Periodontics
- 5.1.1.4. General Dentistry
- 5.1.1.5. Others
- 5.1.2. Other Applications
- 5.1.1. Dental Applications
- 5.2. Market Analysis, Insights and Forecast - by Patient Position
- 5.2.1. Standing/Seated Position
- 5.2.2. Supine Position
- 5.3. Market Analysis, Insights and Forecast - by End User
- 5.3.1. Hospitals
- 5.3.2. Imaging Centers
- 5.3.3. Others
- 5.4. Market Analysis, Insights and Forecast - by Region
- 5.4.1. North America
- 5.4.2. Europe
- 5.4.3. Asia Pacific
- 5.4.4. Middle East and Africa
- 5.4.5. South America
- 5.1. Market Analysis, Insights and Forecast - by Application
- 6. North America Cone Beam Computed Tomography Industry Analysis, Insights and Forecast, 2019-2031
- 6.1. Market Analysis, Insights and Forecast - by Application
- 6.1.1. Dental Applications
- 6.1.1.1. Orthodontics
- 6.1.1.2. Endodontics
- 6.1.1.3. Periodontics
- 6.1.1.4. General Dentistry
- 6.1.1.5. Others
- 6.1.2. Other Applications
- 6.1.1. Dental Applications
- 6.2. Market Analysis, Insights and Forecast - by Patient Position
- 6.2.1. Standing/Seated Position
- 6.2.2. Supine Position
- 6.3. Market Analysis, Insights and Forecast - by End User
- 6.3.1. Hospitals
- 6.3.2. Imaging Centers
- 6.3.3. Others
- 6.1. Market Analysis, Insights and Forecast - by Application
- 7. Europe Cone Beam Computed Tomography Industry Analysis, Insights and Forecast, 2019-2031
- 7.1. Market Analysis, Insights and Forecast - by Application
- 7.1.1. Dental Applications
- 7.1.1.1. Orthodontics
- 7.1.1.2. Endodontics
- 7.1.1.3. Periodontics
- 7.1.1.4. General Dentistry
- 7.1.1.5. Others
- 7.1.2. Other Applications
- 7.1.1. Dental Applications
- 7.2. Market Analysis, Insights and Forecast - by Patient Position
- 7.2.1. Standing/Seated Position
- 7.2.2. Supine Position
- 7.3. Market Analysis, Insights and Forecast - by End User
- 7.3.1. Hospitals
- 7.3.2. Imaging Centers
- 7.3.3. Others
- 7.1. Market Analysis, Insights and Forecast - by Application
- 8. Asia Pacific Cone Beam Computed Tomography Industry Analysis, Insights and Forecast, 2019-2031
- 8.1. Market Analysis, Insights and Forecast - by Application
- 8.1.1. Dental Applications
- 8.1.1.1. Orthodontics
- 8.1.1.2. Endodontics
- 8.1.1.3. Periodontics
- 8.1.1.4. General Dentistry
- 8.1.1.5. Others
- 8.1.2. Other Applications
- 8.1.1. Dental Applications
- 8.2. Market Analysis, Insights and Forecast - by Patient Position
- 8.2.1. Standing/Seated Position
- 8.2.2. Supine Position
- 8.3. Market Analysis, Insights and Forecast - by End User
- 8.3.1. Hospitals
- 8.3.2. Imaging Centers
- 8.3.3. Others
- 8.1. Market Analysis, Insights and Forecast - by Application
- 9. Middle East and Africa Cone Beam Computed Tomography Industry Analysis, Insights and Forecast, 2019-2031
- 9.1. Market Analysis, Insights and Forecast - by Application
- 9.1.1. Dental Applications
- 9.1.1.1. Orthodontics
- 9.1.1.2. Endodontics
- 9.1.1.3. Periodontics
- 9.1.1.4. General Dentistry
- 9.1.1.5. Others
- 9.1.2. Other Applications
- 9.1.1. Dental Applications
- 9.2. Market Analysis, Insights and Forecast - by Patient Position
- 9.2.1. Standing/Seated Position
- 9.2.2. Supine Position
- 9.3. Market Analysis, Insights and Forecast - by End User
- 9.3.1. Hospitals
- 9.3.2. Imaging Centers
- 9.3.3. Others
- 9.1. Market Analysis, Insights and Forecast - by Application
- 10. South America Cone Beam Computed Tomography Industry Analysis, Insights and Forecast, 2019-2031
- 10.1. Market Analysis, Insights and Forecast - by Application
- 10.1.1. Dental Applications
- 10.1.1.1. Orthodontics
- 10.1.1.2. Endodontics
- 10.1.1.3. Periodontics
- 10.1.1.4. General Dentistry
- 10.1.1.5. Others
- 10.1.2. Other Applications
- 10.1.1. Dental Applications
- 10.2. Market Analysis, Insights and Forecast - by Patient Position
- 10.2.1. Standing/Seated Position
- 10.2.2. Supine Position
- 10.3. Market Analysis, Insights and Forecast - by End User
- 10.3.1. Hospitals
- 10.3.2. Imaging Centers
- 10.3.3. Others
- 10.1. Market Analysis, Insights and Forecast - by Application
- 11. North America Cone Beam Computed Tomography Industry Analysis, Insights and Forecast, 2019-2031
- 11.1. Market Analysis, Insights and Forecast - By Country/Sub-region
- 11.1.1 United States
- 11.1.2 Canada
- 11.1.3 Mexico
- 12. Europe Cone Beam Computed Tomography Industry Analysis, Insights and Forecast, 2019-2031
- 12.1. Market Analysis, Insights and Forecast - By Country/Sub-region
- 12.1.1 Germany
- 12.1.2 United Kingdom
- 12.1.3 France
- 12.1.4 Italy
- 12.1.5 Spain
- 12.1.6 Rest of Europe
- 13. Asia Pacific Cone Beam Computed Tomography Industry Analysis, Insights and Forecast, 2019-2031
- 13.1. Market Analysis, Insights and Forecast - By Country/Sub-region
- 13.1.1 China
- 13.1.2 Japan
- 13.1.3 India
- 13.1.4 Australia
- 13.1.5 South Korea
- 13.1.6 Rest of Asia Pacific
- 14. South America Cone Beam Computed Tomography Industry Analysis, Insights and Forecast, 2019-2031
- 14.1. Market Analysis, Insights and Forecast - By Country/Sub-region
- 14.1.1 Brazil
- 14.1.2 Argentina
- 14.1.3 Rest of South America
- 15. Middle East and Africa Cone Beam Computed Tomography Industry Analysis, Insights and Forecast, 2019-2031
- 15.1. Market Analysis, Insights and Forecast - By Country/Sub-region
- 15.1.1 GCC
- 15.1.2 South Africa
- 15.1.3 Rest of Middle East and Africa
- 16. Competitive Analysis
- 16.1. Global Market Share Analysis 2024
- 16.2. Company Profiles
- 16.2.1 Vatech America
- 16.2.1.1. Overview
- 16.2.1.2. Products
- 16.2.1.3. SWOT Analysis
- 16.2.1.4. Recent Developments
- 16.2.1.5. Financials (Based on Availability)
- 16.2.2 Dentsply Sirona
- 16.2.2.1. Overview
- 16.2.2.2. Products
- 16.2.2.3. SWOT Analysis
- 16.2.2.4. Recent Developments
- 16.2.2.5. Financials (Based on Availability)
- 16.2.3 Curve Beam LLC
- 16.2.3.1. Overview
- 16.2.3.2. Products
- 16.2.3.3. SWOT Analysis
- 16.2.3.4. Recent Developments
- 16.2.3.5. Financials (Based on Availability)
- 16.2.4 Danaher Corporation
- 16.2.4.1. Overview
- 16.2.4.2. Products
- 16.2.4.3. SWOT Analysis
- 16.2.4.4. Recent Developments
- 16.2.4.5. Financials (Based on Availability)
- 16.2.5 Prexion Corporation
- 16.2.5.1. Overview
- 16.2.5.2. Products
- 16.2.5.3. SWOT Analysis
- 16.2.5.4. Recent Developments
- 16.2.5.5. Financials (Based on Availability)
- 16.2.6 Carestream Health Inc
- 16.2.6.1. Overview
- 16.2.6.2. Products
- 16.2.6.3. SWOT Analysis
- 16.2.6.4. Recent Developments
- 16.2.6.5. Financials (Based on Availability)
- 16.2.7 Planmeca Group
- 16.2.7.1. Overview
- 16.2.7.2. Products
- 16.2.7.3. SWOT Analysis
- 16.2.7.4. Recent Developments
- 16.2.7.5. Financials (Based on Availability)
- 16.2.8 Asahi RoEntgen Ind Co Ltd
- 16.2.8.1. Overview
- 16.2.8.2. Products
- 16.2.8.3. SWOT Analysis
- 16.2.8.4. Recent Developments
- 16.2.8.5. Financials (Based on Availability)
- 16.2.9 J Morita Mfg Corp
- 16.2.9.1. Overview
- 16.2.9.2. Products
- 16.2.9.3. SWOT Analysis
- 16.2.9.4. Recent Developments
- 16.2.9.5. Financials (Based on Availability)
- 16.2.10 Cefla S C
- 16.2.10.1. Overview
- 16.2.10.2. Products
- 16.2.10.3. SWOT Analysis
- 16.2.10.4. Recent Developments
- 16.2.10.5. Financials (Based on Availability)
- 16.2.1 Vatech America
List of Figures
- Figure 1: Global Cone Beam Computed Tomography Industry Revenue Breakdown (Million, %) by Region 2024 & 2032
- Figure 2: North America Cone Beam Computed Tomography Industry Revenue (Million), by Country 2024 & 2032
- Figure 3: North America Cone Beam Computed Tomography Industry Revenue Share (%), by Country 2024 & 2032
- Figure 4: Europe Cone Beam Computed Tomography Industry Revenue (Million), by Country 2024 & 2032
- Figure 5: Europe Cone Beam Computed Tomography Industry Revenue Share (%), by Country 2024 & 2032
- Figure 6: Asia Pacific Cone Beam Computed Tomography Industry Revenue (Million), by Country 2024 & 2032
- Figure 7: Asia Pacific Cone Beam Computed Tomography Industry Revenue Share (%), by Country 2024 & 2032
- Figure 8: South America Cone Beam Computed Tomography Industry Revenue (Million), by Country 2024 & 2032
- Figure 9: South America Cone Beam Computed Tomography Industry Revenue Share (%), by Country 2024 & 2032
- Figure 10: Middle East and Africa Cone Beam Computed Tomography Industry Revenue (Million), by Country 2024 & 2032
- Figure 11: Middle East and Africa Cone Beam Computed Tomography Industry Revenue Share (%), by Country 2024 & 2032
- Figure 12: North America Cone Beam Computed Tomography Industry Revenue (Million), by Application 2024 & 2032
- Figure 13: North America Cone Beam Computed Tomography Industry Revenue Share (%), by Application 2024 & 2032
- Figure 14: North America Cone Beam Computed Tomography Industry Revenue (Million), by Patient Position 2024 & 2032
- Figure 15: North America Cone Beam Computed Tomography Industry Revenue Share (%), by Patient Position 2024 & 2032
- Figure 16: North America Cone Beam Computed Tomography Industry Revenue (Million), by End User 2024 & 2032
- Figure 17: North America Cone Beam Computed Tomography Industry Revenue Share (%), by End User 2024 & 2032
- Figure 18: North America Cone Beam Computed Tomography Industry Revenue (Million), by Country 2024 & 2032
- Figure 19: North America Cone Beam Computed Tomography Industry Revenue Share (%), by Country 2024 & 2032
- Figure 20: Europe Cone Beam Computed Tomography Industry Revenue (Million), by Application 2024 & 2032
- Figure 21: Europe Cone Beam Computed Tomography Industry Revenue Share (%), by Application 2024 & 2032
- Figure 22: Europe Cone Beam Computed Tomography Industry Revenue (Million), by Patient Position 2024 & 2032
- Figure 23: Europe Cone Beam Computed Tomography Industry Revenue Share (%), by Patient Position 2024 & 2032
- Figure 24: Europe Cone Beam Computed Tomography Industry Revenue (Million), by End User 2024 & 2032
- Figure 25: Europe Cone Beam Computed Tomography Industry Revenue Share (%), by End User 2024 & 2032
- Figure 26: Europe Cone Beam Computed Tomography Industry Revenue (Million), by Country 2024 & 2032
- Figure 27: Europe Cone Beam Computed Tomography Industry Revenue Share (%), by Country 2024 & 2032
- Figure 28: Asia Pacific Cone Beam Computed Tomography Industry Revenue (Million), by Application 2024 & 2032
- Figure 29: Asia Pacific Cone Beam Computed Tomography Industry Revenue Share (%), by Application 2024 & 2032
- Figure 30: Asia Pacific Cone Beam Computed Tomography Industry Revenue (Million), by Patient Position 2024 & 2032
- Figure 31: Asia Pacific Cone Beam Computed Tomography Industry Revenue Share (%), by Patient Position 2024 & 2032
- Figure 32: Asia Pacific Cone Beam Computed Tomography Industry Revenue (Million), by End User 2024 & 2032
- Figure 33: Asia Pacific Cone Beam Computed Tomography Industry Revenue Share (%), by End User 2024 & 2032
- Figure 34: Asia Pacific Cone Beam Computed Tomography Industry Revenue (Million), by Country 2024 & 2032
- Figure 35: Asia Pacific Cone Beam Computed Tomography Industry Revenue Share (%), by Country 2024 & 2032
- Figure 36: Middle East and Africa Cone Beam Computed Tomography Industry Revenue (Million), by Application 2024 & 2032
- Figure 37: Middle East and Africa Cone Beam Computed Tomography Industry Revenue Share (%), by Application 2024 & 2032
- Figure 38: Middle East and Africa Cone Beam Computed Tomography Industry Revenue (Million), by Patient Position 2024 & 2032
- Figure 39: Middle East and Africa Cone Beam Computed Tomography Industry Revenue Share (%), by Patient Position 2024 & 2032
- Figure 40: Middle East and Africa Cone Beam Computed Tomography Industry Revenue (Million), by End User 2024 & 2032
- Figure 41: Middle East and Africa Cone Beam Computed Tomography Industry Revenue Share (%), by End User 2024 & 2032
- Figure 42: Middle East and Africa Cone Beam Computed Tomography Industry Revenue (Million), by Country 2024 & 2032
- Figure 43: Middle East and Africa Cone Beam Computed Tomography Industry Revenue Share (%), by Country 2024 & 2032
- Figure 44: South America Cone Beam Computed Tomography Industry Revenue (Million), by Application 2024 & 2032
- Figure 45: South America Cone Beam Computed Tomography Industry Revenue Share (%), by Application 2024 & 2032
- Figure 46: South America Cone Beam Computed Tomography Industry Revenue (Million), by Patient Position 2024 & 2032
- Figure 47: South America Cone Beam Computed Tomography Industry Revenue Share (%), by Patient Position 2024 & 2032
- Figure 48: South America Cone Beam Computed Tomography Industry Revenue (Million), by End User 2024 & 2032
- Figure 49: South America Cone Beam Computed Tomography Industry Revenue Share (%), by End User 2024 & 2032
- Figure 50: South America Cone Beam Computed Tomography Industry Revenue (Million), by Country 2024 & 2032
- Figure 51: South America Cone Beam Computed Tomography Industry Revenue Share (%), by Country 2024 & 2032
List of Tables
- Table 1: Global Cone Beam Computed Tomography Industry Revenue Million Forecast, by Region 2019 & 2032
- Table 2: Global Cone Beam Computed Tomography Industry Revenue Million Forecast, by Application 2019 & 2032
- Table 3: Global Cone Beam Computed Tomography Industry Revenue Million Forecast, by Patient Position 2019 & 2032
- Table 4: Global Cone Beam Computed Tomography Industry Revenue Million Forecast, by End User 2019 & 2032
- Table 5: Global Cone Beam Computed Tomography Industry Revenue Million Forecast, by Region 2019 & 2032
- Table 6: Global Cone Beam Computed Tomography Industry Revenue Million Forecast, by Country 2019 & 2032
- Table 7: United States Cone Beam Computed Tomography Industry Revenue (Million) Forecast, by Application 2019 & 2032
- Table 8: Canada Cone Beam Computed Tomography Industry Revenue (Million) Forecast, by Application 2019 & 2032
- Table 9: Mexico Cone Beam Computed Tomography Industry Revenue (Million) Forecast, by Application 2019 & 2032
- Table 10: Global Cone Beam Computed Tomography Industry Revenue Million Forecast, by Country 2019 & 2032
- Table 11: Germany Cone Beam Computed Tomography Industry Revenue (Million) Forecast, by Application 2019 & 2032
- Table 12: United Kingdom Cone Beam Computed Tomography Industry Revenue (Million) Forecast, by Application 2019 & 2032
- Table 13: France Cone Beam Computed Tomography Industry Revenue (Million) Forecast, by Application 2019 & 2032
- Table 14: Italy Cone Beam Computed Tomography Industry Revenue (Million) Forecast, by Application 2019 & 2032
- Table 15: Spain Cone Beam Computed Tomography Industry Revenue (Million) Forecast, by Application 2019 & 2032
- Table 16: Rest of Europe Cone Beam Computed Tomography Industry Revenue (Million) Forecast, by Application 2019 & 2032
- Table 17: Global Cone Beam Computed Tomography Industry Revenue Million Forecast, by Country 2019 & 2032
- Table 18: China Cone Beam Computed Tomography Industry Revenue (Million) Forecast, by Application 2019 & 2032
- Table 19: Japan Cone Beam Computed Tomography Industry Revenue (Million) Forecast, by Application 2019 & 2032
- Table 20: India Cone Beam Computed Tomography Industry Revenue (Million) Forecast, by Application 2019 & 2032
- Table 21: Australia Cone Beam Computed Tomography Industry Revenue (Million) Forecast, by Application 2019 & 2032
- Table 22: South Korea Cone Beam Computed Tomography Industry Revenue (Million) Forecast, by Application 2019 & 2032
- Table 23: Rest of Asia Pacific Cone Beam Computed Tomography Industry Revenue (Million) Forecast, by Application 2019 & 2032
- Table 24: Global Cone Beam Computed Tomography Industry Revenue Million Forecast, by Country 2019 & 2032
- Table 25: Brazil Cone Beam Computed Tomography Industry Revenue (Million) Forecast, by Application 2019 & 2032
- Table 26: Argentina Cone Beam Computed Tomography Industry Revenue (Million) Forecast, by Application 2019 & 2032
- Table 27: Rest of South America Cone Beam Computed Tomography Industry Revenue (Million) Forecast, by Application 2019 & 2032
- Table 28: Global Cone Beam Computed Tomography Industry Revenue Million Forecast, by Country 2019 & 2032
- Table 29: GCC Cone Beam Computed Tomography Industry Revenue (Million) Forecast, by Application 2019 & 2032
- Table 30: South Africa Cone Beam Computed Tomography Industry Revenue (Million) Forecast, by Application 2019 & 2032
- Table 31: Rest of Middle East and Africa Cone Beam Computed Tomography Industry Revenue (Million) Forecast, by Application 2019 & 2032
- Table 32: Global Cone Beam Computed Tomography Industry Revenue Million Forecast, by Application 2019 & 2032
- Table 33: Global Cone Beam Computed Tomography Industry Revenue Million Forecast, by Patient Position 2019 & 2032
- Table 34: Global Cone Beam Computed Tomography Industry Revenue Million Forecast, by End User 2019 & 2032
- Table 35: Global Cone Beam Computed Tomography Industry Revenue Million Forecast, by Country 2019 & 2032
- Table 36: United States Cone Beam Computed Tomography Industry Revenue (Million) Forecast, by Application 2019 & 2032
- Table 37: Canada Cone Beam Computed Tomography Industry Revenue (Million) Forecast, by Application 2019 & 2032
- Table 38: Mexico Cone Beam Computed Tomography Industry Revenue (Million) Forecast, by Application 2019 & 2032
- Table 39: Global Cone Beam Computed Tomography Industry Revenue Million Forecast, by Application 2019 & 2032
- Table 40: Global Cone Beam Computed Tomography Industry Revenue Million Forecast, by Patient Position 2019 & 2032
- Table 41: Global Cone Beam Computed Tomography Industry Revenue Million Forecast, by End User 2019 & 2032
- Table 42: Global Cone Beam Computed Tomography Industry Revenue Million Forecast, by Country 2019 & 2032
- Table 43: Germany Cone Beam Computed Tomography Industry Revenue (Million) Forecast, by Application 2019 & 2032
- Table 44: United Kingdom Cone Beam Computed Tomography Industry Revenue (Million) Forecast, by Application 2019 & 2032
- Table 45: France Cone Beam Computed Tomography Industry Revenue (Million) Forecast, by Application 2019 & 2032
- Table 46: Italy Cone Beam Computed Tomography Industry Revenue (Million) Forecast, by Application 2019 & 2032
- Table 47: Spain Cone Beam Computed Tomography Industry Revenue (Million) Forecast, by Application 2019 & 2032
- Table 48: Rest of Europe Cone Beam Computed Tomography Industry Revenue (Million) Forecast, by Application 2019 & 2032
- Table 49: Global Cone Beam Computed Tomography Industry Revenue Million Forecast, by Application 2019 & 2032
- Table 50: Global Cone Beam Computed Tomography Industry Revenue Million Forecast, by Patient Position 2019 & 2032
- Table 51: Global Cone Beam Computed Tomography Industry Revenue Million Forecast, by End User 2019 & 2032
- Table 52: Global Cone Beam Computed Tomography Industry Revenue Million Forecast, by Country 2019 & 2032
- Table 53: China Cone Beam Computed Tomography Industry Revenue (Million) Forecast, by Application 2019 & 2032
- Table 54: Japan Cone Beam Computed Tomography Industry Revenue (Million) Forecast, by Application 2019 & 2032
- Table 55: India Cone Beam Computed Tomography Industry Revenue (Million) Forecast, by Application 2019 & 2032
- Table 56: Australia Cone Beam Computed Tomography Industry Revenue (Million) Forecast, by Application 2019 & 2032
- Table 57: South Korea Cone Beam Computed Tomography Industry Revenue (Million) Forecast, by Application 2019 & 2032
- Table 58: Rest of Asia Pacific Cone Beam Computed Tomography Industry Revenue (Million) Forecast, by Application 2019 & 2032
- Table 59: Global Cone Beam Computed Tomography Industry Revenue Million Forecast, by Application 2019 & 2032
- Table 60: Global Cone Beam Computed Tomography Industry Revenue Million Forecast, by Patient Position 2019 & 2032
- Table 61: Global Cone Beam Computed Tomography Industry Revenue Million Forecast, by End User 2019 & 2032
- Table 62: Global Cone Beam Computed Tomography Industry Revenue Million Forecast, by Country 2019 & 2032
- Table 63: GCC Cone Beam Computed Tomography Industry Revenue (Million) Forecast, by Application 2019 & 2032
- Table 64: South Africa Cone Beam Computed Tomography Industry Revenue (Million) Forecast, by Application 2019 & 2032
- Table 65: Rest of Middle East and Africa Cone Beam Computed Tomography Industry Revenue (Million) Forecast, by Application 2019 & 2032
- Table 66: Global Cone Beam Computed Tomography Industry Revenue Million Forecast, by Application 2019 & 2032
- Table 67: Global Cone Beam Computed Tomography Industry Revenue Million Forecast, by Patient Position 2019 & 2032
- Table 68: Global Cone Beam Computed Tomography Industry Revenue Million Forecast, by End User 2019 & 2032
- Table 69: Global Cone Beam Computed Tomography Industry Revenue Million Forecast, by Country 2019 & 2032
- Table 70: Brazil Cone Beam Computed Tomography Industry Revenue (Million) Forecast, by Application 2019 & 2032
- Table 71: Argentina Cone Beam Computed Tomography Industry Revenue (Million) Forecast, by Application 2019 & 2032
- Table 72: Rest of South America Cone Beam Computed Tomography Industry Revenue (Million) Forecast, by Application 2019 & 2032
Frequently Asked Questions
1. What is the projected Compound Annual Growth Rate (CAGR) of the Cone Beam Computed Tomography Industry?
The projected CAGR is approximately 9.90%.
2. Which companies are prominent players in the Cone Beam Computed Tomography Industry?
Key companies in the market include Vatech America, Dentsply Sirona, Curve Beam LLC, Danaher Corporation, Prexion Corporation, Carestream Health Inc, Planmeca Group, Asahi RoEntgen Ind Co Ltd, J Morita Mfg Corp, Cefla S C.
3. What are the main segments of the Cone Beam Computed Tomography Industry?
The market segments include Application, Patient Position, End User.
4. Can you provide details about the market size?
The market size is estimated to be USD XX Million as of 2022.
5. What are some drivers contributing to market growth?
Increasing Cases of Dental Disorders; Advancements in Technology; Expanding Application Areas of CBCT Systems.
6. What are the notable trends driving market growth?
Periodontal Applications is Expected to Dominate the Cone Beam Computed Tomography (CBCT) Market During the Forecast Period.
7. Are there any restraints impacting market growth?
High Cost of CBCT Systems; Imaging Issues.
8. Can you provide examples of recent developments in the market?
In June 2022, Xoran Technologies received a patent for a modular cone beam computed tomography (CT) system assembly.
9. What pricing options are available for accessing the report?
Pricing options include single-user, multi-user, and enterprise licenses priced at USD 4750, USD 5250, and USD 8750 respectively.
10. Is the market size provided in terms of value or volume?
The market size is provided in terms of value, measured in Million.
11. Are there any specific market keywords associated with the report?
Yes, the market keyword associated with the report is "Cone Beam Computed Tomography Industry," which aids in identifying and referencing the specific market segment covered.
12. How do I determine which pricing option suits my needs best?
The pricing options vary based on user requirements and access needs. Individual users may opt for single-user licenses, while businesses requiring broader access may choose multi-user or enterprise licenses for cost-effective access to the report.
13. Are there any additional resources or data provided in the Cone Beam Computed Tomography Industry report?
While the report offers comprehensive insights, it's advisable to review the specific contents or supplementary materials provided to ascertain if additional resources or data are available.
14. How can I stay updated on further developments or reports in the Cone Beam Computed Tomography Industry?
To stay informed about further developments, trends, and reports in the Cone Beam Computed Tomography Industry, consider subscribing to industry newsletters, following relevant companies and organizations, or regularly checking reputable industry news sources and publications.
Methodology
Step 1 - Identification of Relevant Samples Size from Population Database


Step 2 - Approaches for Defining Global Market Size (Value, Volume* & Price*)

Note*: In applicable scenarios
Step 3 - Data Sources
Primary Research
- Web Analytics
- Survey Reports
- Research Institute
- Latest Research Reports
- Opinion Leaders
Secondary Research
- Annual Reports
- White Paper
- Latest Press Release
- Industry Association
- Paid Database
- Investor Presentations

Step 4 - Data Triangulation
Involves using different sources of information in order to increase the validity of a study
These sources are likely to be stakeholders in a program - participants, other researchers, program staff, other community members, and so on.
Then we put all data in single framework & apply various statistical tools to find out the dynamic on the market.
During the analysis stage, feedback from the stakeholder groups would be compared to determine areas of agreement as well as areas of divergence
