

Key Insights
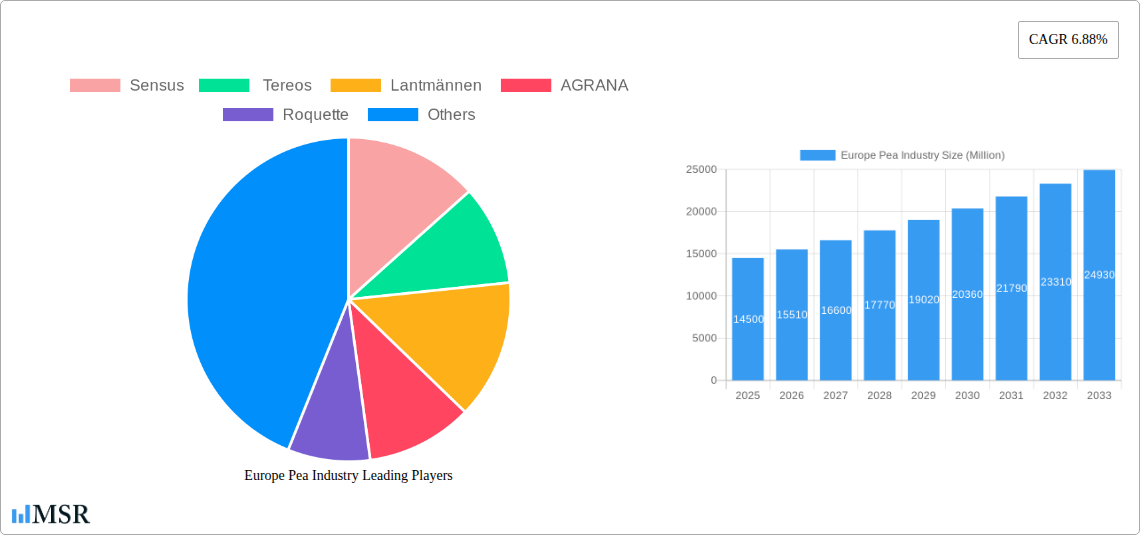
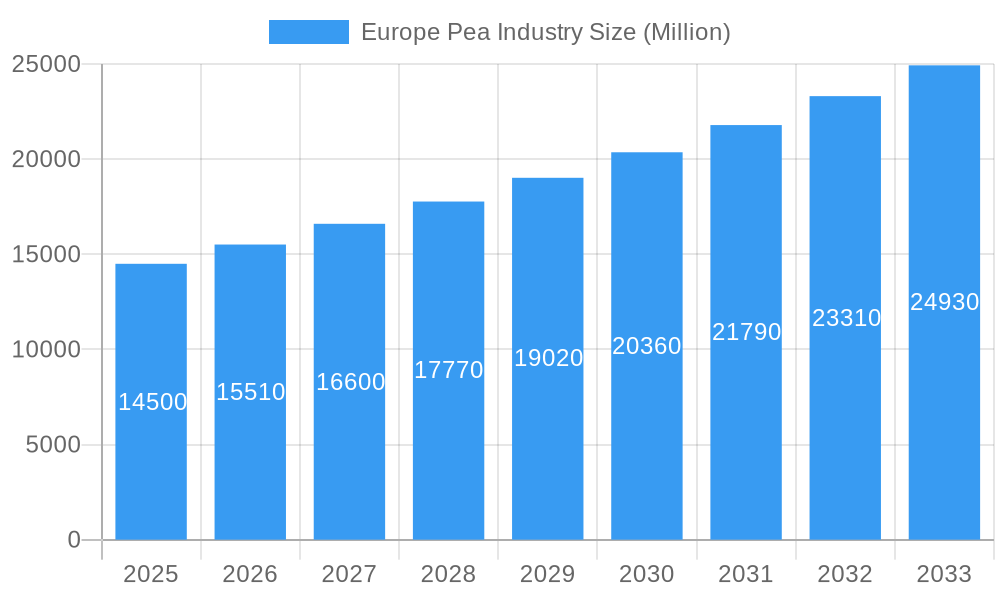
The European pea industry, valued at €14.50 billion in 2025, is projected to experience robust growth, driven by increasing consumer demand for plant-based protein sources and the rising popularity of pea-based food products. This surge in demand is fueled by the growing awareness of the health benefits associated with pea protein, its versatility in various applications (from food and beverages to animal feed), and its sustainable production methods compared to other protein sources. Key trends include the development of innovative pea protein isolates and concentrates with improved functional properties, expansion into new markets (e.g., pea milk alternatives), and the increasing focus on sustainable and traceable sourcing practices within the supply chain. While factors like fluctuating raw material prices and potential yield variations due to weather conditions may pose challenges, the overall growth trajectory remains positive. The market is segmented geographically, with Germany, France, and the United Kingdom representing major players. Competitive dynamics are shaped by a mix of large multinational companies (such as Sensus, Tereos, and AGRANA) and smaller regional producers, each employing varying strategies to capture market share. This competitive landscape fosters innovation and ensures a diverse range of products catering to specific consumer preferences and market niches. The strong growth forecast suggests a bright future for the European pea industry, with significant investment opportunities across production, processing, and marketing.
Europe Pea Industry Market Size (In Billion)
The forecast period (2025-2033) anticipates a continuation of this positive growth trajectory, fueled by continued innovation in pea processing technologies, the expanding food processing industry, and government support for sustainable agriculture within the EU. Russia and Ukraine, while experiencing geopolitical instability which can impact production, remain key players in the European pea supply chain, particularly influencing global price trends. Other countries like France, Spain, and the Netherlands also contribute significantly to the overall production volume, shaping regional dynamics within the European market. The market's success will hinge on effectively managing supply chain resilience, further developing sustainable farming practices, and responding to evolving consumer preferences for healthier and more environmentally friendly food options.
Europe Pea Industry Company Market Share
Europe Pea Industry: A Comprehensive Market Report (2019-2033)
This comprehensive report provides an in-depth analysis of the Europe pea industry, covering market dynamics, key players, emerging trends, and future growth prospects. With a study period spanning 2019-2033, a base year of 2025, and a forecast period from 2025-2033, this report is an invaluable resource for industry stakeholders, investors, and strategic decision-makers. The report utilizes data from the historical period (2019-2024) and incorporates current market trends to offer accurate predictions for the future. The European pea market, valued at approximately XX Million USD in 2025, is poised for significant growth driven by factors detailed within.
Europe Pea Industry Market Concentration & Dynamics
The European pea industry exhibits a moderately concentrated market structure, with a few major players holding significant market share. Sensus, Tereos, Lantmännen, AGRANA, and Roquette are key players, collectively controlling an estimated XX% of the market in 2025. Market share dynamics are influenced by factors including M&A activity, technological innovation, and evolving consumer preferences for plant-based proteins.
- Market Concentration: The Herfindahl-Hirschman Index (HHI) is estimated at XX, indicating a moderately concentrated market.
- Innovation Ecosystems: Significant investments in R&D are driving innovation in pea protein extraction, processing, and application development.
- Regulatory Frameworks: EU regulations concerning food safety and labeling impact market operations. Changes in these regulations can significantly alter market dynamics.
- Substitute Products: Other legume-based proteins and soy protein pose competitive pressure.
- End-User Trends: Growing demand for plant-based foods and increased consumer awareness of health benefits are key growth drivers.
- M&A Activities: The number of M&A deals in the industry averaged XX per year during the historical period, primarily driven by expansion strategies and access to new technologies.
Europe Pea Industry Industry Insights & Trends
The European pea industry is experiencing robust growth, driven by several converging factors. The market size is projected to reach XX Million USD by 2033, exhibiting a Compound Annual Growth Rate (CAGR) of XX% during the forecast period. This growth is fueled by rising consumer demand for plant-based proteins, increasing health consciousness, and the versatility of pea protein in various food applications. Technological advancements in pea protein extraction and processing are enhancing product quality and efficiency, further contributing to market expansion. Evolving consumer preferences towards sustainable and ethically sourced ingredients are also positively influencing market dynamics. The rising popularity of vegan and vegetarian diets is a significant contributor to the surging demand for pea protein across Europe.
Key Markets & Segments Leading Europe Pea Industry
While the entire European market shows significant growth, certain regions and segments stand out.
Russia: Production Analysis: Russia's pea production has fluctuated in recent years, with output averaging XX Million tons annually between 2019 and 2024. This is influenced by climatic conditions and agricultural policies.
Price Trend Analysis:
- Ukraine: Pea prices in Ukraine have experienced significant volatility due to geopolitical factors and supply chain disruptions.
- France: France is a major pea producer and consumer, with relatively stable pricing.
- Spain: Spain’s pea market is characterized by moderate growth and price stability.
- Netherlands: The Netherlands is a significant player in pea processing and exports, experiencing price fluctuations influenced by global market trends.
- Rest of Europe: The rest of Europe shows diverse regional growth based on local consumption patterns and production capacity.
Dominance Analysis: France and the Netherlands currently hold the largest market share within Europe due to established processing infrastructure and high production yields.
- Growth Drivers:
- Economic Growth: Economic prosperity in key European markets increases purchasing power, driving demand for pea-based products.
- Infrastructure Development: Efficient transportation and storage facilities facilitate effective market access.
Europe Pea Industry Product Developments
Recent advancements focus on improving pea protein functionality, taste, and digestibility. Companies are developing novel pea protein isolates, concentrates, and hydrolysates tailored to specific food applications, such as meat alternatives, dairy analogs, and baked goods. The emphasis is on creating products with improved texture, color, and flavor profiles to enhance consumer acceptance and broaden market penetration. Technological advancements, such as advanced extraction methods and enzymatic treatments, are key enablers for these improvements.
Challenges in the Europe Pea Industry Market
The European pea industry faces challenges, including:
- Regulatory Hurdles: Varying food safety and labeling regulations across European countries create complexities for producers.
- Supply Chain Issues: Weather variability, pest infestations, and logistics constraints can disrupt pea supply.
- Competitive Pressures: Competition from other plant-based protein sources, such as soy and lentils, remains a factor.
Forces Driving Europe Pea Industry Growth
- Technological Advancements: Innovations in pea protein processing are increasing efficiency and yield.
- Economic Factors: Rising consumer disposable incomes and increasing health consciousness are boosting demand.
- Regulatory Support: Government initiatives promoting sustainable agriculture and plant-based diets are beneficial.
Long-Term Growth Catalysts in Europe Pea Industry
Long-term growth hinges on continued innovation in pea protein technology, the development of new applications in various food sectors, and strategic partnerships to enhance supply chain efficiency and market access. Expansion into new markets and regional diversification will also play a crucial role.
Emerging Opportunities in Europe Pea Industry
Emerging opportunities include:
- New Markets: Expansion into new food sectors like pet food and cosmetics.
- Technological Innovation: Development of novel pea protein ingredients with enhanced functionalities.
- Consumer Preferences: Catering to growing demands for sustainable, organic, and non-GMO pea products.
Leading Players in the Europe Pea Industry Sector
- Sensus
- Tereos
- Lantmännen
- AGRANA
- Roquette
Key Milestones in Europe Pea Industry Industry
- October 2022: Roquette launched a new line of organic pea ingredients, expanding its product portfolio and addressing the growing demand for organic plant-based options.
- September 2022: Lantmännen invested USD 95.7 Million in a new pea protein production facility, signaling significant long-term commitment to the market.
- May 2022: The phytosanitary protocol between China and Russia opened new export opportunities for Russian pea producers, increasing global competition.
Strategic Outlook for Europe Pea Industry Market
The future of the European pea industry is bright, fueled by sustained consumer demand, technological innovations, and supportive regulatory frameworks. Strategic partnerships, expansion into new markets, and a focus on product differentiation will be key to maximizing long-term growth potential. The focus on sustainability and traceability will be crucial for maintaining market competitiveness and attracting environmentally-conscious consumers.
Europe Pea Industry Segmentation
-
1. Russia
-
1.1. Production Analysis
- 1.1.1. Consumption Analysis and Market Value
- 1.1.2. Import Market Analysis (Volume and Value)
- 1.1.3. Export Market Analysis (Volume and Value)
- 1.1.4. Price Trend Analysis
- 1.2. Ukraine
- 1.3. France
- 1.4. Spain
- 1.5. Netherlands
- 1.6. Rest of Europe
-
1.1. Production Analysis
-
2. Russia
-
2.1. Production Analysis
- 2.1.1. Consumption Analysis and Market Value
- 2.1.2. Import Market Analysis (Volume and Value)
- 2.1.3. Export Market Analysis (Volume and Value)
- 2.1.4. Price Trend Analysis
- 2.2. Ukraine
- 2.3. France
- 2.4. Spain
- 2.5. Netherlands
- 2.6. Rest of Europe
-
2.1. Production Analysis
Europe Pea Industry Segmentation By Geography
-
1. Europe
- 1.1. United Kingdom
- 1.2. Germany
- 1.3. France
- 1.4. Italy
- 1.5. Spain
- 1.6. Netherlands
- 1.7. Belgium
- 1.8. Sweden
- 1.9. Norway
- 1.10. Poland
- 1.11. Denmark
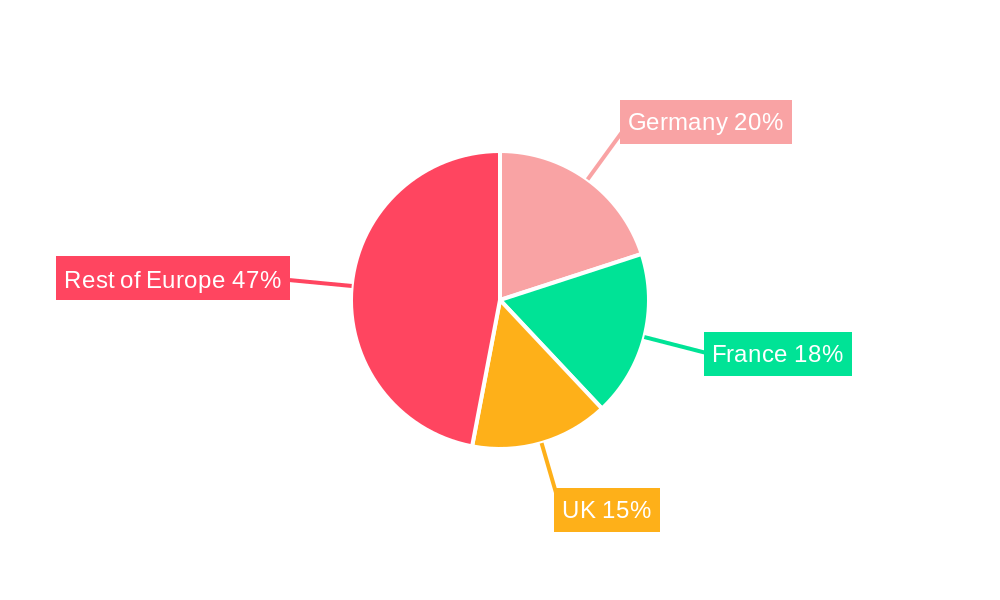
Europe Pea Industry Regional Market Share
Geographic Coverage of Europe Pea Industry
Europe Pea Industry REPORT HIGHLIGHTS
| Aspects | Details |
|---|---|
| Study Period | 2020-2034 |
| Base Year | 2025 |
| Estimated Year | 2026 |
| Forecast Period | 2026-2034 |
| Historical Period | 2020-2025 |
| Growth Rate | CAGR of 6.88% from 2020-2034 |
| Segmentation |
|
Table of Contents
- 1. Introduction
- 1.1. Research Scope
- 1.2. Market Segmentation
- 1.3. Research Objective
- 1.4. Definitions and Assumptions
- 2. Executive Summary
- 2.1. Market Snapshot
- 3. Market Dynamics
- 3.1. Market Drivers
- 3.2. Market Restrains
- 3.3. Market Trends
- 3.4. Market Opportunities
- 4. Market Factor Analysis
- 4.1. Porters Five Forces
- 4.1.1. Bargaining Power of Suppliers
- 4.1.2. Bargaining Power of Buyers
- 4.1.3. Threat of New Entrants
- 4.1.4. Threat of Substitutes
- 4.1.5. Competitive Rivalry
- 4.2. PESTEL analysis
- 4.3. BCG Analysis
- 4.3.1. Stars (High Growth, High Market Share)
- 4.3.2. Cash Cows (Low Growth, High Market Share)
- 4.3.3. Question Mark (High Growth, Low Market Share)
- 4.3.4. Dogs (Low Growth, Low Market Share)
- 4.4. Ansoff Matrix Analysis
- 4.5. Supply Chain Analysis
- 4.6. Regulatory Landscape
- 4.7. Current Market Potential and Opportunity Assessment (TAM–SAM–SOM Framework)
- 4.8. MSR Analyst Note
- 4.1. Porters Five Forces
- 5. Market Analysis, Insights and Forecast 2021-2033
- 5.1. Market Analysis, Insights and Forecast - by Russia
- 5.1.1. Production Analysis
- 5.1.1.1. Consumption Analysis and Market Value
- 5.1.1.2. Import Market Analysis (Volume and Value)
- 5.1.1.3. Export Market Analysis (Volume and Value)
- 5.1.1.4. Price Trend Analysis
- 5.1.2. Ukraine
- 5.1.3. France
- 5.1.4. Spain
- 5.1.5. Netherlands
- 5.1.6. Rest of Europe
- 5.1.1. Production Analysis
- 5.2. Market Analysis, Insights and Forecast - by Russia
- 5.2.1. Production Analysis
- 5.2.1.1. Consumption Analysis and Market Value
- 5.2.1.2. Import Market Analysis (Volume and Value)
- 5.2.1.3. Export Market Analysis (Volume and Value)
- 5.2.1.4. Price Trend Analysis
- 5.2.2. Ukraine
- 5.2.3. France
- 5.2.4. Spain
- 5.2.5. Netherlands
- 5.2.6. Rest of Europe
- 5.2.1. Production Analysis
- 5.3. Market Analysis, Insights and Forecast - by Region
- 5.3.1. Europe
- 5.1. Market Analysis, Insights and Forecast - by Russia
- 6. Europe Pea Industry Analysis, Insights and Forecast, 2021-2033
- 6.1. Market Analysis, Insights and Forecast - by Russia
- 6.1.1. Production Analysis
- 6.1.1.1. Consumption Analysis and Market Value
- 6.1.1.2. Import Market Analysis (Volume and Value)
- 6.1.1.3. Export Market Analysis (Volume and Value)
- 6.1.1.4. Price Trend Analysis
- 6.1.2. Ukraine
- 6.1.3. France
- 6.1.4. Spain
- 6.1.5. Netherlands
- 6.1.6. Rest of Europe
- 6.1.1. Production Analysis
- 6.2. Market Analysis, Insights and Forecast - by Russia
- 6.2.1. Production Analysis
- 6.2.1.1. Consumption Analysis and Market Value
- 6.2.1.2. Import Market Analysis (Volume and Value)
- 6.2.1.3. Export Market Analysis (Volume and Value)
- 6.2.1.4. Price Trend Analysis
- 6.2.2. Ukraine
- 6.2.3. France
- 6.2.4. Spain
- 6.2.5. Netherlands
- 6.2.6. Rest of Europe
- 6.2.1. Production Analysis
- 6.1. Market Analysis, Insights and Forecast - by Russia
- 7. Competitive Analysis
- 7.1. Company Profiles
- 7.1.1 Sensus
- 7.1.1.1. Company Overview
- 7.1.1.2. Products
- 7.1.1.3. Company Financials
- 7.1.1.4. SWOT Analysis
- 7.1.2 Tereos
- 7.1.2.1. Company Overview
- 7.1.2.2. Products
- 7.1.2.3. Company Financials
- 7.1.2.4. SWOT Analysis
- 7.1.3 Lantmännen
- 7.1.3.1. Company Overview
- 7.1.3.2. Products
- 7.1.3.3. Company Financials
- 7.1.3.4. SWOT Analysis
- 7.1.4 AGRANA
- 7.1.4.1. Company Overview
- 7.1.4.2. Products
- 7.1.4.3. Company Financials
- 7.1.4.4. SWOT Analysis
- 7.1.5 Roquette
- 7.1.5.1. Company Overview
- 7.1.5.2. Products
- 7.1.5.3. Company Financials
- 7.1.5.4. SWOT Analysis
- 7.1.1 Sensus
- 7.2. Market Entropy
- 7.2.1 Company's Key Areas Served
- 7.2.2 Recent Developments
- 7.3. Company Market Share Analysis 2025
- 7.3.1 Top 5 Companies Market Share Analysis
- 7.3.2 Top 3 Companies Market Share Analysis
- 7.4. List of Potential Customers
- 8. Research Methodology
List of Figures
- Figure 1: Europe Pea Industry Revenue Breakdown (Million, %) by Product 2025 & 2033
- Figure 2: Europe Pea Industry Share (%) by Company 2025
List of Tables
- Table 1: Europe Pea Industry Revenue Million Forecast, by Russia 2020 & 2033
- Table 2: Europe Pea Industry Volume million units Forecast, by Russia 2020 & 2033
- Table 3: Europe Pea Industry Revenue Million Forecast, by Russia 2020 & 2033
- Table 4: Europe Pea Industry Volume million units Forecast, by Russia 2020 & 2033
- Table 5: Europe Pea Industry Revenue Million Forecast, by Region 2020 & 2033
- Table 6: Europe Pea Industry Volume million units Forecast, by Region 2020 & 2033
- Table 7: Europe Pea Industry Revenue Million Forecast, by Russia 2020 & 2033
- Table 8: Europe Pea Industry Volume million units Forecast, by Russia 2020 & 2033
- Table 9: Europe Pea Industry Revenue Million Forecast, by Russia 2020 & 2033
- Table 10: Europe Pea Industry Volume million units Forecast, by Russia 2020 & 2033
- Table 11: Europe Pea Industry Revenue Million Forecast, by Country 2020 & 2033
- Table 12: Europe Pea Industry Volume million units Forecast, by Country 2020 & 2033
- Table 13: United Kingdom Europe Pea Industry Revenue (Million) Forecast, by Application 2020 & 2033
- Table 14: United Kingdom Europe Pea Industry Volume (million units) Forecast, by Application 2020 & 2033
- Table 15: Germany Europe Pea Industry Revenue (Million) Forecast, by Application 2020 & 2033
- Table 16: Germany Europe Pea Industry Volume (million units) Forecast, by Application 2020 & 2033
- Table 17: France Europe Pea Industry Revenue (Million) Forecast, by Application 2020 & 2033
- Table 18: France Europe Pea Industry Volume (million units) Forecast, by Application 2020 & 2033
- Table 19: Italy Europe Pea Industry Revenue (Million) Forecast, by Application 2020 & 2033
- Table 20: Italy Europe Pea Industry Volume (million units) Forecast, by Application 2020 & 2033
- Table 21: Spain Europe Pea Industry Revenue (Million) Forecast, by Application 2020 & 2033
- Table 22: Spain Europe Pea Industry Volume (million units) Forecast, by Application 2020 & 2033
- Table 23: Netherlands Europe Pea Industry Revenue (Million) Forecast, by Application 2020 & 2033
- Table 24: Netherlands Europe Pea Industry Volume (million units) Forecast, by Application 2020 & 2033
- Table 25: Belgium Europe Pea Industry Revenue (Million) Forecast, by Application 2020 & 2033
- Table 26: Belgium Europe Pea Industry Volume (million units) Forecast, by Application 2020 & 2033
- Table 27: Sweden Europe Pea Industry Revenue (Million) Forecast, by Application 2020 & 2033
- Table 28: Sweden Europe Pea Industry Volume (million units) Forecast, by Application 2020 & 2033
- Table 29: Norway Europe Pea Industry Revenue (Million) Forecast, by Application 2020 & 2033
- Table 30: Norway Europe Pea Industry Volume (million units) Forecast, by Application 2020 & 2033
- Table 31: Poland Europe Pea Industry Revenue (Million) Forecast, by Application 2020 & 2033
- Table 32: Poland Europe Pea Industry Volume (million units) Forecast, by Application 2020 & 2033
- Table 33: Denmark Europe Pea Industry Revenue (Million) Forecast, by Application 2020 & 2033
- Table 34: Denmark Europe Pea Industry Volume (million units) Forecast, by Application 2020 & 2033
Frequently Asked Questions
1. What is the projected Compound Annual Growth Rate (CAGR) of the Europe Pea Industry?
The projected CAGR is approximately 6.88%.
2. Which companies are prominent players in the Europe Pea Industry?
Key companies in the market include Sensus, Tereos , Lantmännen , AGRANA, Roquette .
3. What are the main segments of the Europe Pea Industry?
The market segments include Russia, Russia.
4. Can you provide details about the market size?
The market size is estimated to be USD 14.50 Million as of 2022.
5. What are some drivers contributing to market growth?
Rising Consumption of Cashew Nuts in the Country; Favorable Government Initiatives.
6. What are the notable trends driving market growth?
Growing Export Opportunity.
7. Are there any restraints impacting market growth?
Hazardous Climatic Condition Hinders Cashew Production; Stringent Regulations Related to Food Quality Standards.
8. Can you provide examples of recent developments in the market?
October 2022: Roquette, a global leader in plant-based ingredients and a pioneer of plant proteins, launched a new line of organic pea ingredients: organic pea starch and organic pea protein to the Europe market.
9. What pricing options are available for accessing the report?
Pricing options include single-user, multi-user, and enterprise licenses priced at USD 4750, USD 4950, and USD 6800 respectively.
10. Is the market size provided in terms of value or volume?
The market size is provided in terms of value, measured in Million and volume, measured in million units.
11. Are there any specific market keywords associated with the report?
Yes, the market keyword associated with the report is "Europe Pea Industry," which aids in identifying and referencing the specific market segment covered.
12. How do I determine which pricing option suits my needs best?
The pricing options vary based on user requirements and access needs. Individual users may opt for single-user licenses, while businesses requiring broader access may choose multi-user or enterprise licenses for cost-effective access to the report.
13. Are there any additional resources or data provided in the Europe Pea Industry report?
While the report offers comprehensive insights, it's advisable to review the specific contents or supplementary materials provided to ascertain if additional resources or data are available.
14. How can I stay updated on further developments or reports in the Europe Pea Industry?
To stay informed about further developments, trends, and reports in the Europe Pea Industry, consider subscribing to industry newsletters, following relevant companies and organizations, or regularly checking reputable industry news sources and publications.
Methodology
Step 1 - Identification of Relevant Samples Size from Population Database


Step 2 - Approaches for Defining Global Market Size (Value, Volume* & Price*)

Note*: In applicable scenarios
Step 3 - Data Sources
Primary Research
- Web Analytics
- Survey Reports
- Research Institute
- Latest Research Reports
- Opinion Leaders
Secondary Research
- Annual Reports
- White Paper
- Latest Press Release
- Industry Association
- Paid Database
- Investor Presentations

Step 4 - Data Triangulation
Involves using different sources of information in order to increase the validity of a study
These sources are likely to be stakeholders in a program - participants, other researchers, program staff, other community members, and so on.
Then we put all data in single framework & apply various statistical tools to find out the dynamic on the market.
During the analysis stage, feedback from the stakeholder groups would be compared to determine areas of agreement as well as areas of divergence