

Key Insights
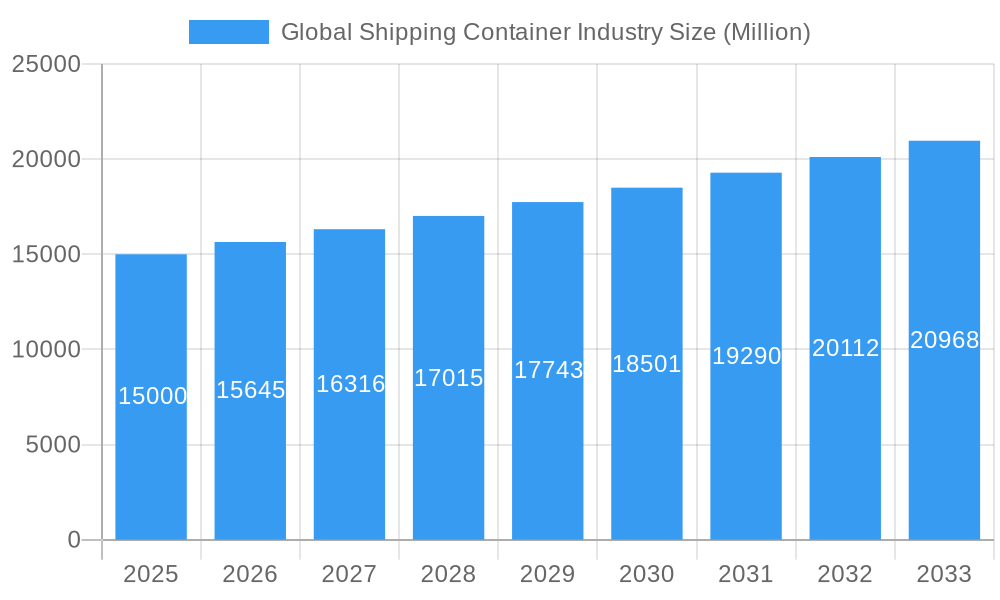
The global shipping container market is projected to reach $12.32 billion by 2025, exhibiting a robust Compound Annual Growth Rate (CAGR) of 3.4% through 2033. Key growth drivers include expanding global trade, particularly from e-commerce, and increasing demand for efficient logistics. Innovations such as high-cube and specialized containers, coupled with port infrastructure development and IoT adoption for tracking, further propel market expansion. Persistent challenges involve fluctuating freight rates, supply chain vulnerabilities, and environmental considerations.

Global Shipping Container Industry Market Size (In Billion)
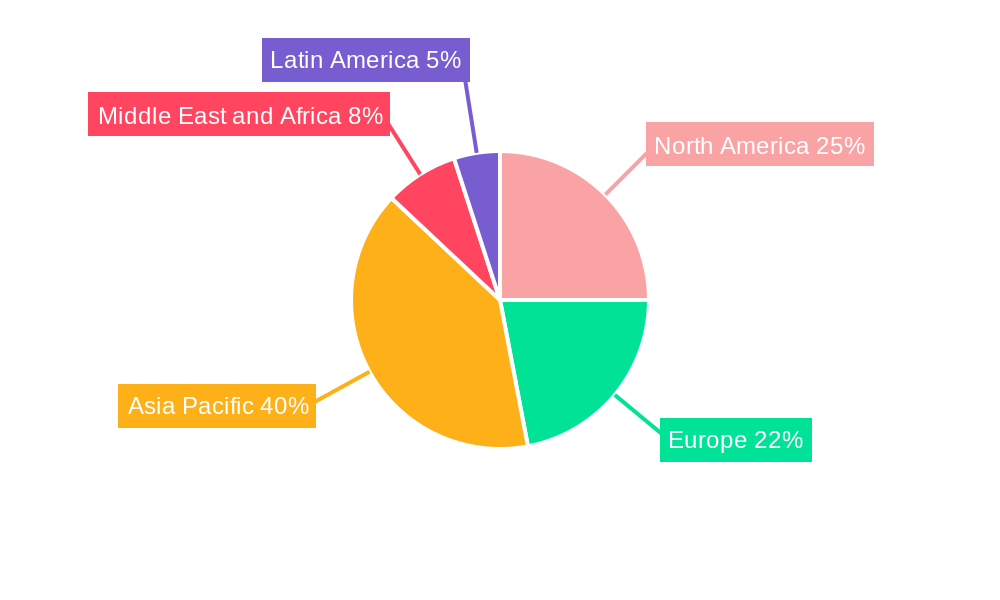
Market segmentation highlights key opportunities. The 40-foot container segment dominates due to its cost-efficiency for bulk shipping. The refrigerated container segment is experiencing significant growth, driven by demand for perishable goods transportation. Geographically, Asia-Pacific leads, supported by its manufacturing prowess and trade activities. North America and Europe also represent substantial markets. Leading players like Maersk Container Industry and Singamas Container Holdings are investing in innovation to meet evolving demand and enhance their competitive positions. The future outlook for the market is positive, anticipating continued growth fueled by global trade and technological advancements optimizing efficiency and sustainability.
Global Shipping Container Industry Company Market Share
Global Shipping Container Industry: A Comprehensive Market Report (2019-2033)
This comprehensive report provides an in-depth analysis of the global shipping container industry, covering market dynamics, key players, emerging trends, and future growth prospects. The study period spans from 2019 to 2033, with 2025 serving as the base and estimated year. This report is crucial for industry stakeholders, investors, and businesses seeking to navigate this dynamic sector. With a focus on actionable insights and data-driven analysis, this report illuminates the path to success in the global shipping container market.
Global Shipping Container Industry Market Concentration & Dynamics
The global shipping container industry exhibits a moderately concentrated market structure, dominated by a handful of major players like Maersk Container Industry AS and CIMC, alongside numerous smaller regional manufacturers. Market share dynamics are influenced by factors such as production capacity, technological innovation, and strategic alliances. The industry's innovation ecosystem is characterized by ongoing advancements in container design, materials, and tracking technologies. Stringent safety and environmental regulations, particularly concerning emissions and hazardous material transport, significantly shape industry practices. Substitute products, while limited, include alternative transportation methods like rail and trucking, influencing the industry's competitive landscape. End-user trends reflect the growth of e-commerce and global trade, driving demand for specialized containers like refrigerated and tank containers. The industry witnesses frequent mergers and acquisitions (M&A) activity, as evidenced by the attempted (but ultimately failed) merger between CIMC and Maersk Container Industry in 2022.
- Market Share Concentration: The top 5 players hold approximately xx% of the global market share (2024).
- M&A Activity (2019-2024): An estimated xx major M&A deals have been concluded.
- Regulatory Landscape: Stringent international maritime regulations significantly impact operational costs and safety standards.
- Substitute Products: Competition from alternative transportation modes like rail and trucking exerts pressure on pricing and market share.
Global Shipping Container Industry Industry Insights & Trends
The global shipping container market experienced significant growth in the historical period (2019-2024), driven by robust global trade and increasing demand for efficient logistics solutions. The market size reached an estimated USD xx Million in 2024, with a Compound Annual Growth Rate (CAGR) of xx%. Technological disruptions, such as the integration of IoT sensors and data analytics in container tracking and management, are transforming industry operations. Evolving consumer behaviors, such as increasing demand for faster delivery and improved supply chain transparency, are pushing for container innovations and optimized logistics solutions. Despite challenges such as geopolitical instability and supply chain disruptions, the long-term outlook for the industry remains positive, fueled by the continuous growth of global trade and e-commerce. The forecast period (2025-2033) projects a CAGR of xx%, resulting in a market size of USD xx Million by 2033.
Key Markets & Segments Leading Global Shipping Container Industry
The Asia-Pacific region holds the leading position in the global shipping container market, driven by rapid economic growth, expanding manufacturing industries, and significant port infrastructure development. China, specifically, remains a dominant player in both manufacturing and consumption.
By Size:
- Large Container (40 Feet): This segment dominates the market due to its high cargo capacity and cost-effectiveness for long-distance shipping. Drivers include increased global trade and the expansion of major shipping routes.
- Small Container (20 Feet): Demand is driven by smaller shipments and regional trade, especially in emerging markets.
- High Cube Container: This specialized container caters to the growing demand for goods requiring greater vertical space. Its growth is driven by the need to optimize cargo capacity and reduce shipping costs.
By Type:
- Dry Storage Container: Remains the largest segment, reflecting the continued dominance of dry cargo shipments in global trade. Economic growth and global trade are primary drivers.
- Refrigerated Container (Reefer): Significant growth is projected due to rising demand for perishable goods across the world. Advances in refrigeration technology and efficient supply chains will continue to fuel this segment.
- Tank Container: Growth is driven by the transportation of liquids and gases, particularly in the chemical and food industries. Regulations related to the transportation of hazardous materials continue to shape this segment.
Global Shipping Container Industry Product Developments
Recent advancements in shipping container technology have focused on enhancing durability, efficiency, and sustainability. Innovations include the development of lightweight yet stronger materials, improved temperature control systems in reefer containers, and the integration of IoT sensors for real-time tracking and condition monitoring. These advancements provide manufacturers with a competitive edge by offering enhanced cargo security, reduced fuel consumption, and improved supply chain visibility. The focus on creating more sustainable and eco-friendly containers is also gaining traction.
Challenges in the Global Shipping Container Industry Market
The global shipping container industry faces several challenges, including fluctuating raw material prices which impact production costs, supply chain disruptions that lead to delays and increased costs, and intense competition among manufacturers impacting pricing. Geopolitical instability, trade wars and port congestion contribute to inconsistent market conditions. Regulatory hurdles relating to environmental protection and safety regulations add complexity to business operations. These combined factors can impact profitability and market growth negatively.
Forces Driving Global Shipping Container Industry Growth
The industry’s growth is propelled by expanding global trade, particularly e-commerce, which necessitates efficient and reliable container shipping solutions. Technological innovations like smart containers and improved logistics software optimize supply chains and improve tracking. Government initiatives supporting infrastructure development and port modernization further enhance global container shipping capabilities.
Long-Term Growth Catalysts in the Global Shipping Container Industry
Long-term growth in this sector hinges on continuous innovation in container design and materials, leading to greater efficiency and sustainability. Strategic partnerships between manufacturers and logistics providers will facilitate optimized supply chain solutions. The expansion into new markets and adoption of sustainable practices will further enhance market potential.
Emerging Opportunities in Global Shipping Container Industry
Emerging markets in developing economies present substantial growth opportunities. The rising adoption of technologies like blockchain for enhanced supply chain traceability and the integration of AI for predictive maintenance offer significant potential. Increased demand for specialized containers catering to specific industry needs (e.g., pharmaceuticals, chemicals) provides further opportunities for market expansion.
Leading Players in the Global Shipping Container Industry Sector
- W&K Container Inc
- American Intermodal Container Manufacturing Company (AICM)
- CARU Containers BV
- Sea Box Inc
- Storstac Inc
- China International Marine Containers Co Ltd
- Singamas Container Holdings Limited
- Valisons & Co
- CXIC (Changzhou Xinhuachang Int'l Containers) Co Ltd
- YMC Container Solutions
- Ritveyraaj Cargo Shipping Containers
- Maersk Container Industry AS
- TLS Offshore Containers International Pvt Ltd
- Dong Fang International Container (Hong Kong) Co Ltd
- China Eastern Containers
Key Milestones in Global Shipping Container Industry Industry
- August 2022: CIMC and Maersk Container Industry abandon a USD 987.3 Million merger plan due to regulatory challenges, highlighting the significant impact of regulatory scrutiny on industry consolidation.
- May 2022: Mazagon Dock Shipbuilders enters the container manufacturing business with a USD 12.18 Million order from CONCOR, signaling a potential shift in regional manufacturing dynamics and a response to previous container shortages.
Strategic Outlook for Global Shipping Container Industry Market
The future of the global shipping container market is bright, driven by the continued growth of global trade and e-commerce. Strategic investments in technological innovation, sustainable practices, and expansion into new markets will be crucial for companies to capitalize on emerging opportunities and maintain a competitive edge. The focus will be on efficient, sustainable, and technologically advanced container solutions that meet the evolving demands of a globalized world.
Global Shipping Container Industry Segmentation
-
1. Size
- 1.1. Small Container (20 Feet)
- 1.2. Large Container (40 Feet)
- 1.3. High Cube Container
-
2. Type
- 2.1. Dry Storage Container
- 2.2. Refrigerated Container
- 2.3. Tank Container
Global Shipping Container Industry Segmentation By Geography
-
1. North America
- 1.1. United States
- 1.2. Canada
-
2. Europe
- 2.1. Germany
- 2.2. United Kingdom
- 2.3. France
- 2.4. Rest of Europe
-
3. Asia Pacific
- 3.1. China
- 3.2. Japan
- 3.3. India
- 3.4. Rest of Asia Pacific
-
4. Middle East and Africa
- 4.1. South Africa
- 4.2. United Arab Emirates
- 4.3. Saudi Arabia
- 4.4. Rest of the Middle East and Africa
-
5. Latin America
- 5.1. Mexico
- 5.2. Brazil
- 5.3. Argentina
- 5.4. Rest of the Latin America
Global Shipping Container Industry Regional Market Share
Geographic Coverage of Global Shipping Container Industry
Global Shipping Container Industry REPORT HIGHLIGHTS
| Aspects | Details |
|---|---|
| Study Period | 2020-2034 |
| Base Year | 2025 |
| Estimated Year | 2026 |
| Forecast Period | 2026-2034 |
| Historical Period | 2020-2025 |
| Growth Rate | CAGR of 3.4% from 2020-2034 |
| Segmentation |
|
Table of Contents
- 1. Introduction
- 1.1. Research Scope
- 1.2. Market Segmentation
- 1.3. Research Objective
- 1.4. Definitions and Assumptions
- 2. Executive Summary
- 2.1. Market Snapshot
- 3. Market Dynamics
- 3.1. Market Drivers
- 3.2. Market Restrains
- 3.3. Market Trends
- 3.4. Market Opportunities
- 4. Market Factor Analysis
- 4.1. Porters Five Forces
- 4.1.1. Bargaining Power of Suppliers
- 4.1.2. Bargaining Power of Buyers
- 4.1.3. Threat of New Entrants
- 4.1.4. Threat of Substitutes
- 4.1.5. Competitive Rivalry
- 4.2. PESTEL analysis
- 4.3. BCG Analysis
- 4.3.1. Stars (High Growth, High Market Share)
- 4.3.2. Cash Cows (Low Growth, High Market Share)
- 4.3.3. Question Mark (High Growth, Low Market Share)
- 4.3.4. Dogs (Low Growth, Low Market Share)
- 4.4. Ansoff Matrix Analysis
- 4.5. Supply Chain Analysis
- 4.6. Regulatory Landscape
- 4.7. Current Market Potential and Opportunity Assessment (TAM–SAM–SOM Framework)
- 4.8. MSR Analyst Note
- 4.1. Porters Five Forces
- 5. Market Analysis, Insights and Forecast 2021-2033
- 5.1. Market Analysis, Insights and Forecast - by Size
- 5.1.1. Small Container (20 Feet)
- 5.1.2. Large Container (40 Feet)
- 5.1.3. High Cube Container
- 5.2. Market Analysis, Insights and Forecast - by Type
- 5.2.1. Dry Storage Container
- 5.2.2. Refrigerated Container
- 5.2.3. Tank Container
- 5.3. Market Analysis, Insights and Forecast - by Region
- 5.3.1. North America
- 5.3.2. Europe
- 5.3.3. Asia Pacific
- 5.3.4. Middle East and Africa
- 5.3.5. Latin America
- 5.1. Market Analysis, Insights and Forecast - by Size
- 6. Global Shipping Container Industry Analysis, Insights and Forecast, 2021-2033
- 6.1. Market Analysis, Insights and Forecast - by Size
- 6.1.1. Small Container (20 Feet)
- 6.1.2. Large Container (40 Feet)
- 6.1.3. High Cube Container
- 6.2. Market Analysis, Insights and Forecast - by Type
- 6.2.1. Dry Storage Container
- 6.2.2. Refrigerated Container
- 6.2.3. Tank Container
- 6.1. Market Analysis, Insights and Forecast - by Size
- 7. North America Global Shipping Container Industry Analysis, Insights and Forecast, 2020-2032
- 7.1. Market Analysis, Insights and Forecast - by Size
- 7.1.1. Small Container (20 Feet)
- 7.1.2. Large Container (40 Feet)
- 7.1.3. High Cube Container
- 7.2. Market Analysis, Insights and Forecast - by Type
- 7.2.1. Dry Storage Container
- 7.2.2. Refrigerated Container
- 7.2.3. Tank Container
- 7.1. Market Analysis, Insights and Forecast - by Size
- 8. Europe Global Shipping Container Industry Analysis, Insights and Forecast, 2020-2032
- 8.1. Market Analysis, Insights and Forecast - by Size
- 8.1.1. Small Container (20 Feet)
- 8.1.2. Large Container (40 Feet)
- 8.1.3. High Cube Container
- 8.2. Market Analysis, Insights and Forecast - by Type
- 8.2.1. Dry Storage Container
- 8.2.2. Refrigerated Container
- 8.2.3. Tank Container
- 8.1. Market Analysis, Insights and Forecast - by Size
- 9. Asia Pacific Global Shipping Container Industry Analysis, Insights and Forecast, 2020-2032
- 9.1. Market Analysis, Insights and Forecast - by Size
- 9.1.1. Small Container (20 Feet)
- 9.1.2. Large Container (40 Feet)
- 9.1.3. High Cube Container
- 9.2. Market Analysis, Insights and Forecast - by Type
- 9.2.1. Dry Storage Container
- 9.2.2. Refrigerated Container
- 9.2.3. Tank Container
- 9.1. Market Analysis, Insights and Forecast - by Size
- 10. Middle East and Africa Global Shipping Container Industry Analysis, Insights and Forecast, 2020-2032
- 10.1. Market Analysis, Insights and Forecast - by Size
- 10.1.1. Small Container (20 Feet)
- 10.1.2. Large Container (40 Feet)
- 10.1.3. High Cube Container
- 10.2. Market Analysis, Insights and Forecast - by Type
- 10.2.1. Dry Storage Container
- 10.2.2. Refrigerated Container
- 10.2.3. Tank Container
- 10.1. Market Analysis, Insights and Forecast - by Size
- 11. Latin America Global Shipping Container Industry Analysis, Insights and Forecast, 2020-2032
- 11.1. Market Analysis, Insights and Forecast - by Size
- 11.1.1. Small Container (20 Feet)
- 11.1.2. Large Container (40 Feet)
- 11.1.3. High Cube Container
- 11.2. Market Analysis, Insights and Forecast - by Type
- 11.2.1. Dry Storage Container
- 11.2.2. Refrigerated Container
- 11.2.3. Tank Container
- 11.1. Market Analysis, Insights and Forecast - by Size
- 12. Competitive Analysis
- 12.1. Company Profiles
- 12.1.1 W&K Container Inc
- 12.1.1.1. Company Overview
- 12.1.1.2. Products
- 12.1.1.3. Company Financials
- 12.1.1.4. SWOT Analysis
- 12.1.2 American Intermodal Container Manufacturing Company (AICM)
- 12.1.2.1. Company Overview
- 12.1.2.2. Products
- 12.1.2.3. Company Financials
- 12.1.2.4. SWOT Analysis
- 12.1.3 CARU Containers BV
- 12.1.3.1. Company Overview
- 12.1.3.2. Products
- 12.1.3.3. Company Financials
- 12.1.3.4. SWOT Analysis
- 12.1.4 Sea Box Inc
- 12.1.4.1. Company Overview
- 12.1.4.2. Products
- 12.1.4.3. Company Financials
- 12.1.4.4. SWOT Analysis
- 12.1.5 Storstac Inc
- 12.1.5.1. Company Overview
- 12.1.5.2. Products
- 12.1.5.3. Company Financials
- 12.1.5.4. SWOT Analysis
- 12.1.6 China International Marine Containers Co Ltd
- 12.1.6.1. Company Overview
- 12.1.6.2. Products
- 12.1.6.3. Company Financials
- 12.1.6.4. SWOT Analysis
- 12.1.7 Singamas Container Holdings Limited
- 12.1.7.1. Company Overview
- 12.1.7.2. Products
- 12.1.7.3. Company Financials
- 12.1.7.4. SWOT Analysis
- 12.1.8 Valisons & Co
- 12.1.8.1. Company Overview
- 12.1.8.2. Products
- 12.1.8.3. Company Financials
- 12.1.8.4. SWOT Analysis
- 12.1.9 CXIC (Changzhou Xinhuachang Int'l Containers) Co Ltd
- 12.1.9.1. Company Overview
- 12.1.9.2. Products
- 12.1.9.3. Company Financials
- 12.1.9.4. SWOT Analysis
- 12.1.10 YMC Container Solutions
- 12.1.10.1. Company Overview
- 12.1.10.2. Products
- 12.1.10.3. Company Financials
- 12.1.10.4. SWOT Analysis
- 12.1.11 Ritveyraaj Cargo Shipping Containers**List Not Exhaustive
- 12.1.11.1. Company Overview
- 12.1.11.2. Products
- 12.1.11.3. Company Financials
- 12.1.11.4. SWOT Analysis
- 12.1.12 Maersk Container Industry AS
- 12.1.12.1. Company Overview
- 12.1.12.2. Products
- 12.1.12.3. Company Financials
- 12.1.12.4. SWOT Analysis
- 12.1.13 TLS Offshore Containers International Pvt Ltd
- 12.1.13.1. Company Overview
- 12.1.13.2. Products
- 12.1.13.3. Company Financials
- 12.1.13.4. SWOT Analysis
- 12.1.14 Dong Fang International Container (Hong Kong) Co Ltd
- 12.1.14.1. Company Overview
- 12.1.14.2. Products
- 12.1.14.3. Company Financials
- 12.1.14.4. SWOT Analysis
- 12.1.15 China Eastern Containers
- 12.1.15.1. Company Overview
- 12.1.15.2. Products
- 12.1.15.3. Company Financials
- 12.1.15.4. SWOT Analysis
- 12.1.1 W&K Container Inc
- 12.2. Market Entropy
- 12.2.1 Company's Key Areas Served
- 12.2.2 Recent Developments
- 12.3. Company Market Share Analysis 2025
- 12.3.1 Top 5 Companies Market Share Analysis
- 12.3.2 Top 3 Companies Market Share Analysis
- 12.4. List of Potential Customers
- 13. Research Methodology
List of Figures
- Figure 1: Global Global Shipping Container Industry Revenue Breakdown (billion, %) by Region 2025 & 2033
- Figure 2: North America Global Shipping Container Industry Revenue (billion), by Size 2025 & 2033
- Figure 3: North America Global Shipping Container Industry Revenue Share (%), by Size 2025 & 2033
- Figure 4: North America Global Shipping Container Industry Revenue (billion), by Type 2025 & 2033
- Figure 5: North America Global Shipping Container Industry Revenue Share (%), by Type 2025 & 2033
- Figure 6: North America Global Shipping Container Industry Revenue (billion), by Country 2025 & 2033
- Figure 7: North America Global Shipping Container Industry Revenue Share (%), by Country 2025 & 2033
- Figure 8: Europe Global Shipping Container Industry Revenue (billion), by Size 2025 & 2033
- Figure 9: Europe Global Shipping Container Industry Revenue Share (%), by Size 2025 & 2033
- Figure 10: Europe Global Shipping Container Industry Revenue (billion), by Type 2025 & 2033
- Figure 11: Europe Global Shipping Container Industry Revenue Share (%), by Type 2025 & 2033
- Figure 12: Europe Global Shipping Container Industry Revenue (billion), by Country 2025 & 2033
- Figure 13: Europe Global Shipping Container Industry Revenue Share (%), by Country 2025 & 2033
- Figure 14: Asia Pacific Global Shipping Container Industry Revenue (billion), by Size 2025 & 2033
- Figure 15: Asia Pacific Global Shipping Container Industry Revenue Share (%), by Size 2025 & 2033
- Figure 16: Asia Pacific Global Shipping Container Industry Revenue (billion), by Type 2025 & 2033
- Figure 17: Asia Pacific Global Shipping Container Industry Revenue Share (%), by Type 2025 & 2033
- Figure 18: Asia Pacific Global Shipping Container Industry Revenue (billion), by Country 2025 & 2033
- Figure 19: Asia Pacific Global Shipping Container Industry Revenue Share (%), by Country 2025 & 2033
- Figure 20: Middle East and Africa Global Shipping Container Industry Revenue (billion), by Size 2025 & 2033
- Figure 21: Middle East and Africa Global Shipping Container Industry Revenue Share (%), by Size 2025 & 2033
- Figure 22: Middle East and Africa Global Shipping Container Industry Revenue (billion), by Type 2025 & 2033
- Figure 23: Middle East and Africa Global Shipping Container Industry Revenue Share (%), by Type 2025 & 2033
- Figure 24: Middle East and Africa Global Shipping Container Industry Revenue (billion), by Country 2025 & 2033
- Figure 25: Middle East and Africa Global Shipping Container Industry Revenue Share (%), by Country 2025 & 2033
- Figure 26: Latin America Global Shipping Container Industry Revenue (billion), by Size 2025 & 2033
- Figure 27: Latin America Global Shipping Container Industry Revenue Share (%), by Size 2025 & 2033
- Figure 28: Latin America Global Shipping Container Industry Revenue (billion), by Type 2025 & 2033
- Figure 29: Latin America Global Shipping Container Industry Revenue Share (%), by Type 2025 & 2033
- Figure 30: Latin America Global Shipping Container Industry Revenue (billion), by Country 2025 & 2033
- Figure 31: Latin America Global Shipping Container Industry Revenue Share (%), by Country 2025 & 2033
List of Tables
- Table 1: Global Shipping Container Industry Revenue billion Forecast, by Size 2020 & 2033
- Table 2: Global Shipping Container Industry Revenue billion Forecast, by Type 2020 & 2033
- Table 3: Global Shipping Container Industry Revenue billion Forecast, by Region 2020 & 2033
- Table 4: Global Shipping Container Industry Revenue billion Forecast, by Size 2020 & 2033
- Table 5: Global Shipping Container Industry Revenue billion Forecast, by Type 2020 & 2033
- Table 6: Global Shipping Container Industry Revenue billion Forecast, by Country 2020 & 2033
- Table 7: United States Global Shipping Container Industry Revenue (billion) Forecast, by Application 2020 & 2033
- Table 8: Canada Global Shipping Container Industry Revenue (billion) Forecast, by Application 2020 & 2033
- Table 9: Global Shipping Container Industry Revenue billion Forecast, by Size 2020 & 2033
- Table 10: Global Shipping Container Industry Revenue billion Forecast, by Type 2020 & 2033
- Table 11: Global Shipping Container Industry Revenue billion Forecast, by Country 2020 & 2033
- Table 12: Germany Global Shipping Container Industry Revenue (billion) Forecast, by Application 2020 & 2033
- Table 13: United Kingdom Global Shipping Container Industry Revenue (billion) Forecast, by Application 2020 & 2033
- Table 14: France Global Shipping Container Industry Revenue (billion) Forecast, by Application 2020 & 2033
- Table 15: Rest of Europe Global Shipping Container Industry Revenue (billion) Forecast, by Application 2020 & 2033
- Table 16: Global Shipping Container Industry Revenue billion Forecast, by Size 2020 & 2033
- Table 17: Global Shipping Container Industry Revenue billion Forecast, by Type 2020 & 2033
- Table 18: Global Shipping Container Industry Revenue billion Forecast, by Country 2020 & 2033
- Table 19: China Global Shipping Container Industry Revenue (billion) Forecast, by Application 2020 & 2033
- Table 20: Japan Global Shipping Container Industry Revenue (billion) Forecast, by Application 2020 & 2033
- Table 21: India Global Shipping Container Industry Revenue (billion) Forecast, by Application 2020 & 2033
- Table 22: Rest of Asia Pacific Global Shipping Container Industry Revenue (billion) Forecast, by Application 2020 & 2033
- Table 23: Global Shipping Container Industry Revenue billion Forecast, by Size 2020 & 2033
- Table 24: Global Shipping Container Industry Revenue billion Forecast, by Type 2020 & 2033
- Table 25: Global Shipping Container Industry Revenue billion Forecast, by Country 2020 & 2033
- Table 26: South Africa Global Shipping Container Industry Revenue (billion) Forecast, by Application 2020 & 2033
- Table 27: United Arab Emirates Global Shipping Container Industry Revenue (billion) Forecast, by Application 2020 & 2033
- Table 28: Saudi Arabia Global Shipping Container Industry Revenue (billion) Forecast, by Application 2020 & 2033
- Table 29: Rest of the Middle East and Africa Global Shipping Container Industry Revenue (billion) Forecast, by Application 2020 & 2033
- Table 30: Global Shipping Container Industry Revenue billion Forecast, by Size 2020 & 2033
- Table 31: Global Shipping Container Industry Revenue billion Forecast, by Type 2020 & 2033
- Table 32: Global Shipping Container Industry Revenue billion Forecast, by Country 2020 & 2033
- Table 33: Mexico Global Shipping Container Industry Revenue (billion) Forecast, by Application 2020 & 2033
- Table 34: Brazil Global Shipping Container Industry Revenue (billion) Forecast, by Application 2020 & 2033
- Table 35: Argentina Global Shipping Container Industry Revenue (billion) Forecast, by Application 2020 & 2033
- Table 36: Rest of the Latin America Global Shipping Container Industry Revenue (billion) Forecast, by Application 2020 & 2033
Frequently Asked Questions
1. What is the projected Compound Annual Growth Rate (CAGR) of the Global Shipping Container Industry?
The projected CAGR is approximately 3.4%.
2. Which companies are prominent players in the Global Shipping Container Industry?
Key companies in the market include W&K Container Inc, American Intermodal Container Manufacturing Company (AICM), CARU Containers BV, Sea Box Inc, Storstac Inc, China International Marine Containers Co Ltd, Singamas Container Holdings Limited, Valisons & Co, CXIC (Changzhou Xinhuachang Int'l Containers) Co Ltd, YMC Container Solutions, Ritveyraaj Cargo Shipping Containers**List Not Exhaustive, Maersk Container Industry AS, TLS Offshore Containers International Pvt Ltd, Dong Fang International Container (Hong Kong) Co Ltd, China Eastern Containers.
3. What are the main segments of the Global Shipping Container Industry?
The market segments include Size, Type.
4. Can you provide details about the market size?
The market size is estimated to be USD 12.32 billion as of 2022.
5. What are some drivers contributing to market growth?
4.; Increasing Consumption of Frozen Food Driving the Market.
6. What are the notable trends driving market growth?
Increase in Demand for Cargo Transportation through Ships Driving the Market.
7. Are there any restraints impacting market growth?
4.; Constantly Increasing Fuel Costs.
8. Can you provide examples of recent developments in the market?
August 2022: Global shipping container suppliers China International Marine Containers and Maersk Container Industry in a joint statement said they have abandoned a merger plan, citing significant regulatory challenges. China International Marine Containers (CIMC) in September 2021 had agreed to buy the Danish shipping company AP Moeller - Maersk refrigerated containers maker for USD 987.3 million. The U.S. Justice Department said the deal would have combined two of the world's four suppliers of refrigerated shipping containers and further concentrated the global cold supply chain.
9. What pricing options are available for accessing the report?
Pricing options include single-user, multi-user, and enterprise licenses priced at USD 4750, USD 5250, and USD 8750 respectively.
10. Is the market size provided in terms of value or volume?
The market size is provided in terms of value, measured in billion.
11. Are there any specific market keywords associated with the report?
Yes, the market keyword associated with the report is "Global Shipping Container Industry," which aids in identifying and referencing the specific market segment covered.
12. How do I determine which pricing option suits my needs best?
The pricing options vary based on user requirements and access needs. Individual users may opt for single-user licenses, while businesses requiring broader access may choose multi-user or enterprise licenses for cost-effective access to the report.
13. Are there any additional resources or data provided in the Global Shipping Container Industry report?
While the report offers comprehensive insights, it's advisable to review the specific contents or supplementary materials provided to ascertain if additional resources or data are available.
14. How can I stay updated on further developments or reports in the Global Shipping Container Industry?
To stay informed about further developments, trends, and reports in the Global Shipping Container Industry, consider subscribing to industry newsletters, following relevant companies and organizations, or regularly checking reputable industry news sources and publications.
Methodology
Step 1 - Identification of Relevant Samples Size from Population Database


Step 2 - Approaches for Defining Global Market Size (Value, Volume* & Price*)

Note*: In applicable scenarios
Step 3 - Data Sources
Primary Research
- Web Analytics
- Survey Reports
- Research Institute
- Latest Research Reports
- Opinion Leaders
Secondary Research
- Annual Reports
- White Paper
- Latest Press Release
- Industry Association
- Paid Database
- Investor Presentations

Step 4 - Data Triangulation
Involves using different sources of information in order to increase the validity of a study
These sources are likely to be stakeholders in a program - participants, other researchers, program staff, other community members, and so on.
Then we put all data in single framework & apply various statistical tools to find out the dynamic on the market.
During the analysis stage, feedback from the stakeholder groups would be compared to determine areas of agreement as well as areas of divergence