

Key Insights
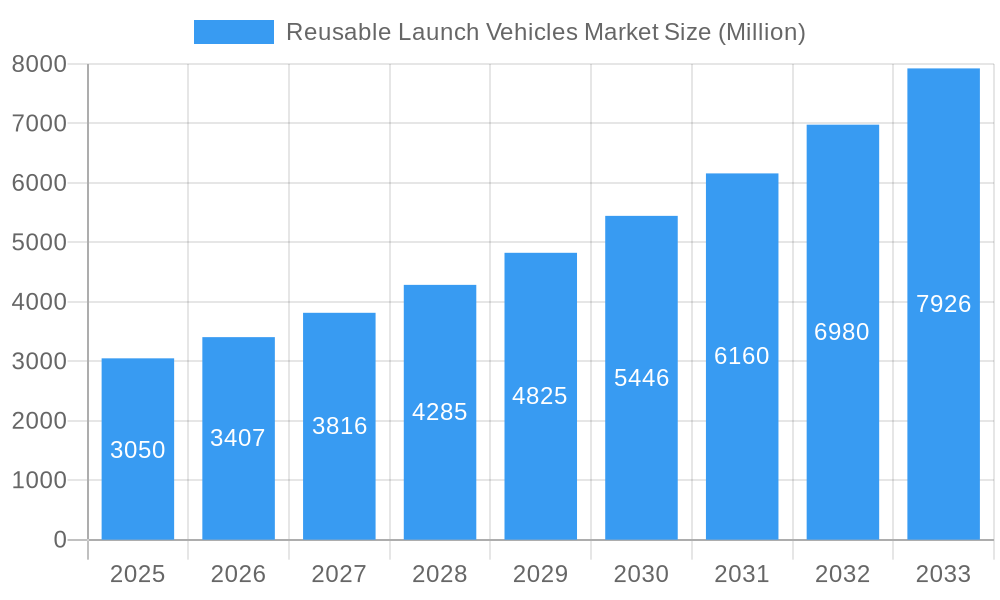
The Reusable Launch Vehicles (RLV) market is experiencing robust growth, projected to reach \$3.05 billion in 2025 and expand significantly over the forecast period (2025-2033). A compound annual growth rate (CAGR) of 11.65% indicates a substantial increase in market value driven by several key factors. The increasing demand for cost-effective space access, fueled by burgeoning commercial space activities, satellite constellations, and space tourism initiatives, is a primary driver. Technological advancements leading to improved reusability rates and reduced refurbishment times further contribute to market expansion. Government initiatives and investments in space exploration programs across nations like the US, China, and India are also bolstering market growth. The market is segmented by reusability (partially and fully reusable) and configuration (single-stage and multi-stage), with fully reusable, multi-stage vehicles expected to dominate due to their superior cost-efficiency and payload capacity. While technological challenges and high initial investment costs pose some restraints, ongoing R&D and private sector investments are mitigating these limitations. North America currently holds a significant market share, driven by the presence of major players like SpaceX and Blue Origin, but the Asia-Pacific region is poised for rapid growth due to increasing government spending and burgeoning private space industries in countries such as China and India. Competition among established players and emerging entrants is intensifying, leading to innovation and price reductions, making space access more affordable and driving market expansion.
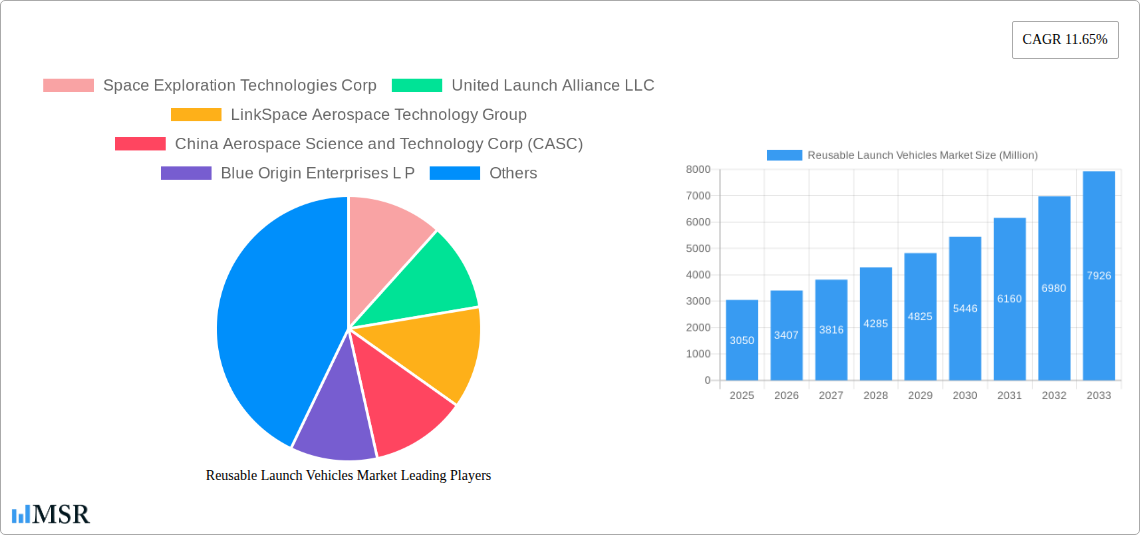
Reusable Launch Vehicles Market Market Size (In Billion)
The competitive landscape features a mix of established aerospace giants like Boeing (through ULA) and government agencies such as NASA and ISRO, alongside innovative private companies such as SpaceX and Blue Origin. These companies are constantly vying for market share through technological advancements, strategic partnerships, and cost-optimization strategies. The market's future trajectory hinges on continued technological breakthroughs, regulatory frameworks supporting commercial space activities, and the sustained growth of the space economy. Further research into advanced materials, propulsion systems, and landing technologies will be crucial for improving RLV performance and reducing operational costs, thereby further fueling market expansion. The increasing focus on sustainability in space exploration further benefits the RLV market, as reusable systems contribute to a greener space environment compared to traditional expendable rockets.
Reusable Launch Vehicles Market Company Market Share
Reusable Launch Vehicles Market: A Comprehensive Analysis 2019-2033
This comprehensive report provides an in-depth analysis of the Reusable Launch Vehicles market, offering invaluable insights for industry stakeholders, investors, and researchers. Covering the period from 2019 to 2033, with a focus on 2025, this study unveils the market's dynamics, growth drivers, and future potential. The report leverages rigorous data analysis and expert insights to provide actionable recommendations for navigating this rapidly evolving sector. The global Reusable Launch Vehicles market is projected to reach xx Million by 2033, exhibiting a CAGR of xx% during the forecast period (2025-2033).
Reusable Launch Vehicles Market Market Concentration & Dynamics
The Reusable Launch Vehicles market exhibits a moderately concentrated landscape, dominated by a few key players like SpaceX (Space Exploration Technologies Corp), United Launch Alliance LLC, and Blue Origin Enterprises L P. However, increasing participation from emerging players like LinkSpace Aerospace Technology Group and government agencies such as NASA and ISRO is intensifying competition.
Market Concentration Metrics:
- Market Share: SpaceX holds an estimated xx% market share in 2025, followed by ULA with xx% and Blue Origin with xx%. The remaining market share is distributed among other players.
- M&A Activity: The historical period (2019-2024) witnessed xx M&A deals, primarily focused on technology integration and expansion into new markets. The forecast period is expected to see a rise in M&A activity driven by the need for increased market share and technological advancements.
Market Dynamics:
- Innovation Ecosystems: Robust innovation ecosystems are driving technological advancements in propulsion systems, materials science, and reusable vehicle design, fostering competition.
- Regulatory Frameworks: Stringent safety regulations and licensing requirements influence market growth and pose challenges for new entrants.
- Substitute Products: While currently limited, alternative launch technologies like space tethers and spaceplanes could emerge as substitutes in the long term.
- End-User Trends: Growing demand for satellite constellations, space tourism, and deep-space exploration fuels market growth.
- M&A Activities: Strategic acquisitions and mergers are expected to increase as companies seek to consolidate their market position and access new technologies.
Reusable Launch Vehicles Market Industry Insights & Trends
The Reusable Launch Vehicles (RLV) market is experiencing a period of unprecedented expansion, propelled by a synergistic interplay of economic, technological, and societal forces. The fundamental advantage of reusability lies in its dramatic reduction of the cost per launch, democratizing access to space for a wider array of government agencies, research institutions, and a burgeoning commercial sector. This economic impetus is further amplified by rapid advancements across critical domains, including novel materials science enabling lighter and more resilient structures, next-generation propulsion systems delivering enhanced efficiency and thrust, and sophisticated autonomous flight control systems ensuring precision and safety. Beyond technological evolution, evolving consumer preferences are significantly shaping market dynamics. A growing appetite for space tourism, coupled with increased private sector investment in lunar and Martian exploration, is creating a robust demand for dependable and cost-effective launch solutions. The market, valued at approximately [Insert specific value in Million] in 2025, is projected to reach a staggering [Insert specific value in Million] by 2033, signifying a compound annual growth rate (CAGR) of [Insert specific CAGR percentage]%. This trajectory presents a compelling landscape of opportunity for established players and innovative newcomers alike. Disruptive innovations, such as the development of fully reusable orbital-class launch systems and the continuous improvement of payload capacity and delivery precision, are actively reshaping the competitive arena and paving the way for more ambitious space endeavors.
Key Markets & Segments Leading Reusable Launch Vehicles Market
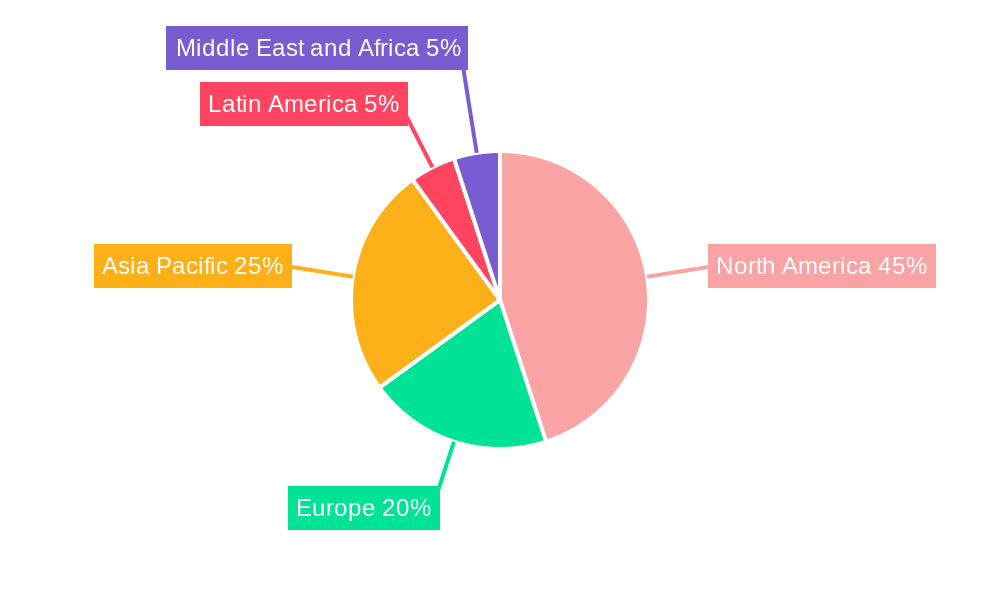
The North American market currently leads the global Reusable Launch Vehicles market, driven by significant government investment, a robust private space industry, and established infrastructure. However, Asia-Pacific is expected to witness significant growth in the forecast period due to increasing space exploration initiatives by countries like China and India.
Dominant Segments:
- Type: Fully reusable launch vehicles are gaining traction due to their cost-effectiveness, though partially reusable systems continue to hold significant market share.
- Configuration: Multi-stage configurations dominate the market currently, offering greater flexibility and payload capacity. However, single-stage-to-orbit (SSTO) vehicles are being actively developed and could disrupt the market in the future.
Key Market Drivers:
- North America: Strong government support (NASA), thriving private sector, and advanced technological capabilities.
- Europe: Significant contributions from ArianeGroup and DLR, focused on developing sustainable and efficient launch systems.
- Asia-Pacific: Rising investments in space exploration by China and India, fueled by national space programs.
Reusable Launch Vehicles Market Product Developments
The RLV market is a hotbed of innovation, characterized by a relentless pursuit of technological breakthroughs that enhance performance, reliability, and affordability. Key areas of development include the refinement of reusable rocket engines, focusing on extended lifespans, rapid turnaround times, and optimized thrust profiles. The adoption of advanced materials, such as high-strength carbon composites and heat-resistant alloys, is leading to lighter, more durable, and aerodynamically superior vehicle designs. Furthermore, the integration of cutting-edge autonomous flight control systems, powered by AI and machine learning, is instrumental in enabling precise trajectory control, automated landing sequences, and enhanced mission flexibility. These advancements collectively contribute to a significant competitive advantage for companies that can effectively integrate and operationalize these technologies. The market is witnessing a diversification of launch vehicle architectures, with an increasing focus on designs tailored for specific mission profiles and payload requirements, ranging from small satellite constellations to heavy cargo delivery for deep space exploration.
Challenges in the Reusable Launch Vehicles Market Market
The Reusable Launch Vehicles market faces several challenges, including stringent regulatory hurdles and high development costs. Supply chain complexities and competition from established players pose significant barriers to entry. These factors can impact the market's growth trajectory. For instance, delays in regulatory approvals can result in project delays and increased costs.
Forces Driving Reusable Launch Vehicles Market Growth
Several factors drive the Reusable Launch Vehicles market's growth. Technological advancements, such as reusable engines and improved avionics, are reducing launch costs. Government funding for space exploration programs and increasing commercial demand for satellite launches and space tourism boost market expansion. Favorable regulatory environments in certain regions also promote investment and innovation.
Long-Term Growth Catalysts in the Reusable Launch Vehicles Market
Long-term growth will be fueled by continued innovation in propulsion systems, materials science, and autonomous flight control. Strategic partnerships between private companies and government agencies will further accelerate market development. Expansion into new markets, such as space tourism and lunar missions, will create additional growth opportunities.
Emerging Opportunities in Reusable Launch Vehicles Market
Emerging opportunities include the development of reusable launch vehicles optimized for specific missions (e.g., small satellite constellations). The expansion into new markets, like point-to-point space travel and in-space servicing, presents significant potential. New technologies, such as hypersonic vehicles and advanced propulsion systems, will further revolutionize the market.
Leading Players in the Reusable Launch Vehicles Market Sector
- Space Exploration Technologies Corp (SpaceX)
- United Launch Alliance LLC (ULA)
- LinkSpace Aerospace Technology Group
- China Aerospace Science and Technology Corp (CASC)
- Blue Origin Enterprises L P
- ArianeGroup
- Deutsches Zentrum für Luft- und Raumfahrt e V (DLR)
- Indian Space Research Organisation (ISRO)
- National Aeronautics and Space Administration (NASA)
- Rocket Lab USA, Inc.
- Virgin Galactic Holdings, Inc.
Key Milestones in Reusable Launch Vehicles Market Industry
- 2015: SpaceX achieves a landmark feat with the successful vertical landing of a Falcon 9 first-stage booster, proving the viability of reusable orbital-class rocket technology.
- 2018: Blue Origin successfully demonstrates multiple vertical landings of its New Shepard suborbital vehicle, paving the way for future space tourism applications.
- 2020: SpaceX's historic Crew Dragon mission, carrying astronauts to the International Space Station using a previously flown capsule, marks a new era in human spaceflight accessibility.
- 2023: Several key players announce significant breakthroughs in reusable engine technology, promising increased engine life and reduced refurbishment costs. The development and testing of novel reusable upper stages gain momentum.
- 2024-2025 (Projected): Anticipated first flight tests of next-generation fully reusable super heavy-lift launch vehicles. Increased operational cadence of reusable vehicles for satellite deployment and cargo missions.
Strategic Outlook for Reusable Launch Vehicles Market Market
The Reusable Launch Vehicles market is poised for sustained and robust growth, driven by an ever-expanding array of applications and increasing global investment in space infrastructure. Continued innovation in propulsion, materials, and autonomous systems will be paramount in unlocking new frontiers and reducing costs further. Strategic alliances and collaborations among industry players, research institutions, and government agencies will be crucial for navigating the complex development cycles and large-scale capital requirements inherent in this sector. Companies that demonstrate agility in adapting to evolving market demands, a commitment to safety and reliability, and a forward-thinking approach to technological integration are strategically positioned to capitalize on the immense opportunities within this dynamic and transformative market.
Reusable Launch Vehicles Market Segmentation
-
1. Type
- 1.1. Partially Reusable
- 1.2. Fully Reusable
-
2. Configuration
- 2.1. Single-Stage
- 2.2. Multi-Stage
Reusable Launch Vehicles Market Segmentation By Geography
-
1. North America
- 1.1. North America
- 1.2. Canada
-
2. Europe
- 2.1. United Kingdom
- 2.2. Germany
- 2.3. France
- 2.4. Italy
- 2.5. Russia
- 2.6. Rest of Europe
-
3. Asia Pacific
- 3.1. China
- 3.2. India
- 3.3. Japan
- 3.4. South Korea
- 3.5. Rest of Asia Pacific
-
4. Latin America
- 4.1. Brazil
- 4.2. Mexico
- 4.3. Rest of Latin America
-
5. Middle East and Africa
- 5.1. Saudi Arabia
- 5.2. United Arab Emirates
- 5.3. Israel
- 5.4. South Africa
- 5.5. Rest of Middle East and Africa
Reusable Launch Vehicles Market Regional Market Share
Geographic Coverage of Reusable Launch Vehicles Market
Reusable Launch Vehicles Market REPORT HIGHLIGHTS
| Aspects | Details |
|---|---|
| Study Period | 2020-2034 |
| Base Year | 2025 |
| Estimated Year | 2026 |
| Forecast Period | 2026-2034 |
| Historical Period | 2020-2025 |
| Growth Rate | CAGR of 11.65% from 2020-2034 |
| Segmentation |
|
Table of Contents
- 1. Introduction
- 1.1. Research Scope
- 1.2. Market Segmentation
- 1.3. Research Objective
- 1.4. Definitions and Assumptions
- 2. Executive Summary
- 2.1. Market Snapshot
- 3. Market Dynamics
- 3.1. Market Drivers
- 3.2. Market Restrains
- 3.3. Market Trends
- 3.4. Market Opportunities
- 4. Market Factor Analysis
- 4.1. Porters Five Forces
- 4.1.1. Bargaining Power of Suppliers
- 4.1.2. Bargaining Power of Buyers
- 4.1.3. Threat of New Entrants
- 4.1.4. Threat of Substitutes
- 4.1.5. Competitive Rivalry
- 4.2. PESTEL analysis
- 4.3. BCG Analysis
- 4.3.1. Stars (High Growth, High Market Share)
- 4.3.2. Cash Cows (Low Growth, High Market Share)
- 4.3.3. Question Mark (High Growth, Low Market Share)
- 4.3.4. Dogs (Low Growth, Low Market Share)
- 4.4. Ansoff Matrix Analysis
- 4.5. Supply Chain Analysis
- 4.6. Regulatory Landscape
- 4.7. Current Market Potential and Opportunity Assessment (TAM–SAM–SOM Framework)
- 4.8. MSR Analyst Note
- 4.1. Porters Five Forces
- 5. Market Analysis, Insights and Forecast 2021-2033
- 5.1. Market Analysis, Insights and Forecast - by Type
- 5.1.1. Partially Reusable
- 5.1.2. Fully Reusable
- 5.2. Market Analysis, Insights and Forecast - by Configuration
- 5.2.1. Single-Stage
- 5.2.2. Multi-Stage
- 5.3. Market Analysis, Insights and Forecast - by Region
- 5.3.1. North America
- 5.3.2. Europe
- 5.3.3. Asia Pacific
- 5.3.4. Latin America
- 5.3.5. Middle East and Africa
- 5.1. Market Analysis, Insights and Forecast - by Type
- 6. Global Reusable Launch Vehicles Market Analysis, Insights and Forecast, 2021-2033
- 6.1. Market Analysis, Insights and Forecast - by Type
- 6.1.1. Partially Reusable
- 6.1.2. Fully Reusable
- 6.2. Market Analysis, Insights and Forecast - by Configuration
- 6.2.1. Single-Stage
- 6.2.2. Multi-Stage
- 6.1. Market Analysis, Insights and Forecast - by Type
- 7. North America Reusable Launch Vehicles Market Analysis, Insights and Forecast, 2020-2032
- 7.1. Market Analysis, Insights and Forecast - by Type
- 7.1.1. Partially Reusable
- 7.1.2. Fully Reusable
- 7.2. Market Analysis, Insights and Forecast - by Configuration
- 7.2.1. Single-Stage
- 7.2.2. Multi-Stage
- 7.1. Market Analysis, Insights and Forecast - by Type
- 8. Europe Reusable Launch Vehicles Market Analysis, Insights and Forecast, 2020-2032
- 8.1. Market Analysis, Insights and Forecast - by Type
- 8.1.1. Partially Reusable
- 8.1.2. Fully Reusable
- 8.2. Market Analysis, Insights and Forecast - by Configuration
- 8.2.1. Single-Stage
- 8.2.2. Multi-Stage
- 8.1. Market Analysis, Insights and Forecast - by Type
- 9. Asia Pacific Reusable Launch Vehicles Market Analysis, Insights and Forecast, 2020-2032
- 9.1. Market Analysis, Insights and Forecast - by Type
- 9.1.1. Partially Reusable
- 9.1.2. Fully Reusable
- 9.2. Market Analysis, Insights and Forecast - by Configuration
- 9.2.1. Single-Stage
- 9.2.2. Multi-Stage
- 9.1. Market Analysis, Insights and Forecast - by Type
- 10. Latin America Reusable Launch Vehicles Market Analysis, Insights and Forecast, 2020-2032
- 10.1. Market Analysis, Insights and Forecast - by Type
- 10.1.1. Partially Reusable
- 10.1.2. Fully Reusable
- 10.2. Market Analysis, Insights and Forecast - by Configuration
- 10.2.1. Single-Stage
- 10.2.2. Multi-Stage
- 10.1. Market Analysis, Insights and Forecast - by Type
- 11. Middle East and Africa Reusable Launch Vehicles Market Analysis, Insights and Forecast, 2020-2032
- 11.1. Market Analysis, Insights and Forecast - by Type
- 11.1.1. Partially Reusable
- 11.1.2. Fully Reusable
- 11.2. Market Analysis, Insights and Forecast - by Configuration
- 11.2.1. Single-Stage
- 11.2.2. Multi-Stage
- 11.1. Market Analysis, Insights and Forecast - by Type
- 12. Competitive Analysis
- 12.1. Company Profiles
- 12.1.1 Space Exploration Technologies Corp
- 12.1.1.1. Company Overview
- 12.1.1.2. Products
- 12.1.1.3. Company Financials
- 12.1.1.4. SWOT Analysis
- 12.1.2 United Launch Alliance LLC
- 12.1.2.1. Company Overview
- 12.1.2.2. Products
- 12.1.2.3. Company Financials
- 12.1.2.4. SWOT Analysis
- 12.1.3 LinkSpace Aerospace Technology Group
- 12.1.3.1. Company Overview
- 12.1.3.2. Products
- 12.1.3.3. Company Financials
- 12.1.3.4. SWOT Analysis
- 12.1.4 China Aerospace Science and Technology Corp (CASC)
- 12.1.4.1. Company Overview
- 12.1.4.2. Products
- 12.1.4.3. Company Financials
- 12.1.4.4. SWOT Analysis
- 12.1.5 Blue Origin Enterprises L P
- 12.1.5.1. Company Overview
- 12.1.5.2. Products
- 12.1.5.3. Company Financials
- 12.1.5.4. SWOT Analysis
- 12.1.6 ArianeGroup
- 12.1.6.1. Company Overview
- 12.1.6.2. Products
- 12.1.6.3. Company Financials
- 12.1.6.4. SWOT Analysis
- 12.1.7 Deutsches Zentrum für Luft- und Raumfahrt e V (DLR
- 12.1.7.1. Company Overview
- 12.1.7.2. Products
- 12.1.7.3. Company Financials
- 12.1.7.4. SWOT Analysis
- 12.1.8 Indian Space Research Organisation (ISRO)
- 12.1.8.1. Company Overview
- 12.1.8.2. Products
- 12.1.8.3. Company Financials
- 12.1.8.4. SWOT Analysis
- 12.1.9 National Aeronautics and Space Administration (NASA)
- 12.1.9.1. Company Overview
- 12.1.9.2. Products
- 12.1.9.3. Company Financials
- 12.1.9.4. SWOT Analysis
- 12.1.1 Space Exploration Technologies Corp
- 12.2. Market Entropy
- 12.2.1 Company's Key Areas Served
- 12.2.2 Recent Developments
- 12.3. Company Market Share Analysis 2025
- 12.3.1 Top 5 Companies Market Share Analysis
- 12.3.2 Top 3 Companies Market Share Analysis
- 12.4. List of Potential Customers
- 13. Research Methodology
List of Figures
- Figure 1: Global Reusable Launch Vehicles Market Revenue Breakdown (Million, %) by Region 2025 & 2033
- Figure 2: North America Reusable Launch Vehicles Market Revenue (Million), by Type 2025 & 2033
- Figure 3: North America Reusable Launch Vehicles Market Revenue Share (%), by Type 2025 & 2033
- Figure 4: North America Reusable Launch Vehicles Market Revenue (Million), by Configuration 2025 & 2033
- Figure 5: North America Reusable Launch Vehicles Market Revenue Share (%), by Configuration 2025 & 2033
- Figure 6: North America Reusable Launch Vehicles Market Revenue (Million), by Country 2025 & 2033
- Figure 7: North America Reusable Launch Vehicles Market Revenue Share (%), by Country 2025 & 2033
- Figure 8: Europe Reusable Launch Vehicles Market Revenue (Million), by Type 2025 & 2033
- Figure 9: Europe Reusable Launch Vehicles Market Revenue Share (%), by Type 2025 & 2033
- Figure 10: Europe Reusable Launch Vehicles Market Revenue (Million), by Configuration 2025 & 2033
- Figure 11: Europe Reusable Launch Vehicles Market Revenue Share (%), by Configuration 2025 & 2033
- Figure 12: Europe Reusable Launch Vehicles Market Revenue (Million), by Country 2025 & 2033
- Figure 13: Europe Reusable Launch Vehicles Market Revenue Share (%), by Country 2025 & 2033
- Figure 14: Asia Pacific Reusable Launch Vehicles Market Revenue (Million), by Type 2025 & 2033
- Figure 15: Asia Pacific Reusable Launch Vehicles Market Revenue Share (%), by Type 2025 & 2033
- Figure 16: Asia Pacific Reusable Launch Vehicles Market Revenue (Million), by Configuration 2025 & 2033
- Figure 17: Asia Pacific Reusable Launch Vehicles Market Revenue Share (%), by Configuration 2025 & 2033
- Figure 18: Asia Pacific Reusable Launch Vehicles Market Revenue (Million), by Country 2025 & 2033
- Figure 19: Asia Pacific Reusable Launch Vehicles Market Revenue Share (%), by Country 2025 & 2033
- Figure 20: Latin America Reusable Launch Vehicles Market Revenue (Million), by Type 2025 & 2033
- Figure 21: Latin America Reusable Launch Vehicles Market Revenue Share (%), by Type 2025 & 2033
- Figure 22: Latin America Reusable Launch Vehicles Market Revenue (Million), by Configuration 2025 & 2033
- Figure 23: Latin America Reusable Launch Vehicles Market Revenue Share (%), by Configuration 2025 & 2033
- Figure 24: Latin America Reusable Launch Vehicles Market Revenue (Million), by Country 2025 & 2033
- Figure 25: Latin America Reusable Launch Vehicles Market Revenue Share (%), by Country 2025 & 2033
- Figure 26: Middle East and Africa Reusable Launch Vehicles Market Revenue (Million), by Type 2025 & 2033
- Figure 27: Middle East and Africa Reusable Launch Vehicles Market Revenue Share (%), by Type 2025 & 2033
- Figure 28: Middle East and Africa Reusable Launch Vehicles Market Revenue (Million), by Configuration 2025 & 2033
- Figure 29: Middle East and Africa Reusable Launch Vehicles Market Revenue Share (%), by Configuration 2025 & 2033
- Figure 30: Middle East and Africa Reusable Launch Vehicles Market Revenue (Million), by Country 2025 & 2033
- Figure 31: Middle East and Africa Reusable Launch Vehicles Market Revenue Share (%), by Country 2025 & 2033
List of Tables
- Table 1: Global Reusable Launch Vehicles Market Revenue Million Forecast, by Type 2020 & 2033
- Table 2: Global Reusable Launch Vehicles Market Revenue Million Forecast, by Configuration 2020 & 2033
- Table 3: Global Reusable Launch Vehicles Market Revenue Million Forecast, by Region 2020 & 2033
- Table 4: Global Reusable Launch Vehicles Market Revenue Million Forecast, by Type 2020 & 2033
- Table 5: Global Reusable Launch Vehicles Market Revenue Million Forecast, by Configuration 2020 & 2033
- Table 6: Global Reusable Launch Vehicles Market Revenue Million Forecast, by Country 2020 & 2033
- Table 7: North America Reusable Launch Vehicles Market Revenue (Million) Forecast, by Application 2020 & 2033
- Table 8: Canada Reusable Launch Vehicles Market Revenue (Million) Forecast, by Application 2020 & 2033
- Table 9: Global Reusable Launch Vehicles Market Revenue Million Forecast, by Type 2020 & 2033
- Table 10: Global Reusable Launch Vehicles Market Revenue Million Forecast, by Configuration 2020 & 2033
- Table 11: Global Reusable Launch Vehicles Market Revenue Million Forecast, by Country 2020 & 2033
- Table 12: United Kingdom Reusable Launch Vehicles Market Revenue (Million) Forecast, by Application 2020 & 2033
- Table 13: Germany Reusable Launch Vehicles Market Revenue (Million) Forecast, by Application 2020 & 2033
- Table 14: France Reusable Launch Vehicles Market Revenue (Million) Forecast, by Application 2020 & 2033
- Table 15: Italy Reusable Launch Vehicles Market Revenue (Million) Forecast, by Application 2020 & 2033
- Table 16: Russia Reusable Launch Vehicles Market Revenue (Million) Forecast, by Application 2020 & 2033
- Table 17: Rest of Europe Reusable Launch Vehicles Market Revenue (Million) Forecast, by Application 2020 & 2033
- Table 18: Global Reusable Launch Vehicles Market Revenue Million Forecast, by Type 2020 & 2033
- Table 19: Global Reusable Launch Vehicles Market Revenue Million Forecast, by Configuration 2020 & 2033
- Table 20: Global Reusable Launch Vehicles Market Revenue Million Forecast, by Country 2020 & 2033
- Table 21: China Reusable Launch Vehicles Market Revenue (Million) Forecast, by Application 2020 & 2033
- Table 22: India Reusable Launch Vehicles Market Revenue (Million) Forecast, by Application 2020 & 2033
- Table 23: Japan Reusable Launch Vehicles Market Revenue (Million) Forecast, by Application 2020 & 2033
- Table 24: South Korea Reusable Launch Vehicles Market Revenue (Million) Forecast, by Application 2020 & 2033
- Table 25: Rest of Asia Pacific Reusable Launch Vehicles Market Revenue (Million) Forecast, by Application 2020 & 2033
- Table 26: Global Reusable Launch Vehicles Market Revenue Million Forecast, by Type 2020 & 2033
- Table 27: Global Reusable Launch Vehicles Market Revenue Million Forecast, by Configuration 2020 & 2033
- Table 28: Global Reusable Launch Vehicles Market Revenue Million Forecast, by Country 2020 & 2033
- Table 29: Brazil Reusable Launch Vehicles Market Revenue (Million) Forecast, by Application 2020 & 2033
- Table 30: Mexico Reusable Launch Vehicles Market Revenue (Million) Forecast, by Application 2020 & 2033
- Table 31: Rest of Latin America Reusable Launch Vehicles Market Revenue (Million) Forecast, by Application 2020 & 2033
- Table 32: Global Reusable Launch Vehicles Market Revenue Million Forecast, by Type 2020 & 2033
- Table 33: Global Reusable Launch Vehicles Market Revenue Million Forecast, by Configuration 2020 & 2033
- Table 34: Global Reusable Launch Vehicles Market Revenue Million Forecast, by Country 2020 & 2033
- Table 35: Saudi Arabia Reusable Launch Vehicles Market Revenue (Million) Forecast, by Application 2020 & 2033
- Table 36: United Arab Emirates Reusable Launch Vehicles Market Revenue (Million) Forecast, by Application 2020 & 2033
- Table 37: Israel Reusable Launch Vehicles Market Revenue (Million) Forecast, by Application 2020 & 2033
- Table 38: South Africa Reusable Launch Vehicles Market Revenue (Million) Forecast, by Application 2020 & 2033
- Table 39: Rest of Middle East and Africa Reusable Launch Vehicles Market Revenue (Million) Forecast, by Application 2020 & 2033
Frequently Asked Questions
1. What is the projected Compound Annual Growth Rate (CAGR) of the Reusable Launch Vehicles Market?
The projected CAGR is approximately 11.65%.
2. Which companies are prominent players in the Reusable Launch Vehicles Market?
Key companies in the market include Space Exploration Technologies Corp, United Launch Alliance LLC, LinkSpace Aerospace Technology Group, China Aerospace Science and Technology Corp (CASC), Blue Origin Enterprises L P, ArianeGroup, Deutsches Zentrum für Luft- und Raumfahrt e V (DLR, Indian Space Research Organisation (ISRO), National Aeronautics and Space Administration (NASA).
3. What are the main segments of the Reusable Launch Vehicles Market?
The market segments include Type, Configuration.
4. Can you provide details about the market size?
The market size is estimated to be USD 3.05 Million as of 2022.
5. What are some drivers contributing to market growth?
N/A
6. What are the notable trends driving market growth?
Fully Reusable Launch Vehicles to hold the Largest Market Share in 2023.
7. Are there any restraints impacting market growth?
N/A
8. Can you provide examples of recent developments in the market?
N/A
9. What pricing options are available for accessing the report?
Pricing options include single-user, multi-user, and enterprise licenses priced at USD 4750, USD 5250, and USD 8750 respectively.
10. Is the market size provided in terms of value or volume?
The market size is provided in terms of value, measured in Million.
11. Are there any specific market keywords associated with the report?
Yes, the market keyword associated with the report is "Reusable Launch Vehicles Market," which aids in identifying and referencing the specific market segment covered.
12. How do I determine which pricing option suits my needs best?
The pricing options vary based on user requirements and access needs. Individual users may opt for single-user licenses, while businesses requiring broader access may choose multi-user or enterprise licenses for cost-effective access to the report.
13. Are there any additional resources or data provided in the Reusable Launch Vehicles Market report?
While the report offers comprehensive insights, it's advisable to review the specific contents or supplementary materials provided to ascertain if additional resources or data are available.
14. How can I stay updated on further developments or reports in the Reusable Launch Vehicles Market?
To stay informed about further developments, trends, and reports in the Reusable Launch Vehicles Market, consider subscribing to industry newsletters, following relevant companies and organizations, or regularly checking reputable industry news sources and publications.
Methodology
Step 1 - Identification of Relevant Samples Size from Population Database


Step 2 - Approaches for Defining Global Market Size (Value, Volume* & Price*)

Note*: In applicable scenarios
Step 3 - Data Sources
Primary Research
- Web Analytics
- Survey Reports
- Research Institute
- Latest Research Reports
- Opinion Leaders
Secondary Research
- Annual Reports
- White Paper
- Latest Press Release
- Industry Association
- Paid Database
- Investor Presentations

Step 4 - Data Triangulation
Involves using different sources of information in order to increase the validity of a study
These sources are likely to be stakeholders in a program - participants, other researchers, program staff, other community members, and so on.
Then we put all data in single framework & apply various statistical tools to find out the dynamic on the market.
During the analysis stage, feedback from the stakeholder groups would be compared to determine areas of agreement as well as areas of divergence